]http://www.chalmers.se/rss/
Gyrokinetic modelling of stationary electron and impurity profiles in tokamaks
Abstract
Particle transport due to Ion Temperature Gradient/Trapped Electron (ITG/TE) mode turbulence is investigated using the gyrokinetic code GENE. Both a reduced quasilinear (QL) treatment and nonlinear (NL) simulations are performed for typical tokamak parameters corresponding to ITG dominated turbulence.
A selfconsistent treatment is used, where the stationary local profiles are calculated corresponding to zero particle flux simultaneously for electrons and trace impurities. The scaling of the stationary profiles with magnetic shear, safety factor, electron-to-ion temperature ratio, collisionality, toroidal sheared rotation, triangularity, and elongation is investigated. In addition, the effect of different main ion mass on the zero flux condition is discussed.
The electron density gradient can significantly affect the stationary impurity profile scaling. It is therefore expected, that a selfconsistent treatment will yield results more comparable to experimental results for parameter scans where the stationary background density profile is sensitive. This is shown to be the case in scans over magnetic shear, collisionality, elongation, and temperature ratio, for which the simultaneous zero flux electron and impurity profiles are calculated.
A slight asymmetry between hydrogen, deuterium and tritium with respect to profile peaking is obtained, in particular for scans in collisionality and temperature ratio.
pacs:
28.52.Av, 52.25.Vy, 52.30.Ex, 52.30.Gz, 52.35.Ra, 52.55.Fa, 52.65.TtI Introduction
It is well known that the shape of the main ion density and impurity profiles are crucial for the performance of a fusion device. Inward peaking of the main ion (electron) density profile is beneficial for the fusion performance since it enhances the fusion power production. For impurities on the other hand, a flat or hollow profile is preferred, since impurity accumulation in the core leads to fuel dilution and radiation losses which degrades performance.
The particle profiles are determined by a balance between particle sources and particle fluxes, a subject which historically has been given much less attention than energy transport and the associated temperature profiles. Hence, electron density profiles are often treated as a parameter in theoretical studies of transport rather than being selfconsistently calculated.
Turbulent transport in the core of tokamaks is expected to be driven mainly by Ion Temperature Gradient (ITG) and Trapped Electron (TE) modes. Impurity transport driven by ITG/TE mode turbulence has been investigated in a number of theoretical studies.Frojdh1992 ; Basu2003 ; Angioni2005 ; Estrada-Mila2005 ; Naulin2005 ; Angioni2006 ; Guirlet2006 ; Bourdelle2007 ; Dubuit2007 ; Nordman2007a ; Angioni2008 ; Nordman2008 ; Angioni2009a ; Angioni2009c ; Camenen2009 ; Moradi2009 ; Fable2010 ; Fulop2010 ; Futatani2010 ; Hein2010 ; Angioni2011 ; Nordman2011 ; Skyman2011a ; Skyman2011b ; Casson2013 ; Skyman2014 Most work in this area has been focused on either scalings of stationary electron profiles or on impurity transport using prescribed electron density profiles.
It is well established theoretically that turbulent particle transport in tokamaks has contributions from both diagonal (diffusive) and non-diagonal (convective) terms. The non-diagonal transport contributions may give rise to an inward pinch which can support an inwardly peaked profile even in the absence of particle sources in the core. The stationary peaked profile is then obtained from a balance between diffusion and convection.
It is known that the electron density gradient can significantly affect the stationary impurity profile scaling.Skyman2011b In the present work, therefore, the background electron density and impurity peaking is treated selfconsistently, by simultaneously calculating the local profiles corresponding to zero turbulent particle flux of both electrons and impurities.
Linear and nonlinear gyrokinetic simulations using the code GENE111http://www.ipp.mpg.de/~fsj/gene/ are employed.Jenko2000 ; Merz2008a The scaling of the stationary profiles with key plasma parameters like magnetic shear, temperature ratio and temperature gradient, toroidal sheared rotation, safety factor, and collisionality is investigated for a deuterium (D) plasma. The isotope scaling of stationary profiles, for hydrogen (H) and tritium (T) plasmas, is also studied.
The parameters are taken from the Cyclone Base Case (CBCDimits2000 ), but with deuterium as main ions; see Tab. 1 for the main parameters. It is an ITG mode dominated scenario and, though set far from marginal stability, is an interesting case for study, and is widely used as a testing ground and benchmark for theoretical and numerical studies.
The rest of the paper is organised as follows: In section II the theoretical background is given, including considerations regarding analysis and numerics; the main results are presented in section III, where scalings of the stationary profiles for electrons and impurities are presented; results for background peaking for different main ion isotopes is presented and discussed in section IV; finally, in section V, follow the concluding remarks.
| † |
|---|
II Background
The local particle transport for species can be formally divided into its diagonal and off-diagonal parts
| (1) |
Here, the first term on the right hand side is the diffusion and the second and third constitute the off-diagonal pinch. The first of the pinch terms is the particle transport due to the temperature gradient (thermo-diffusion) and the second is the convective velocity, which includes contributions from curvature, parallel compression and roto-diffusion. In equation (1), are the local gradient scale lengths of density and temperature, normalised to the major radius (). In general, the transport coefficients dependent on the gradients, though in the trace impurity limit the transport is linear in both and . A review of the off-diagonal contributions is given in Ref. Angioni2012, .
At steady state, the contributions from the different terms in the particle transport will tend to cancel, resulting in zero particle flux. Solving equation (1) for zero particle flux, with yields
| (2) |
which is the steady state gradient of zero particle flux for species . This measure quantifies the balance between diffusion and advection, and gives a measure of how “peaked” the local density profile is at steady state. It is therefore referred to as the “peaking factor” and denoted .
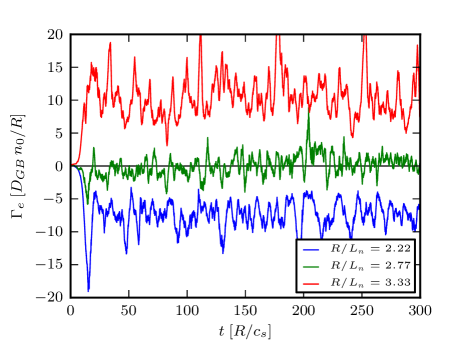
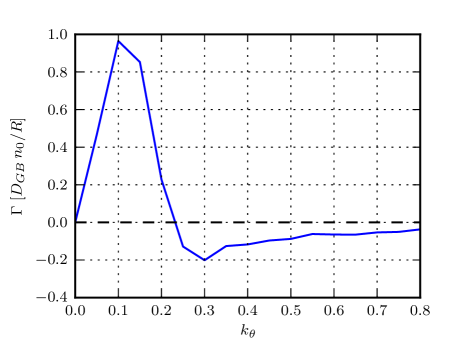
In order to investigate the transport, nonlinear (NL) GENE simulations were performed from which for the stationary electron profiles were calculated. The results were compared with quasilinear (QL) results, also obtained using GENE. The background peaking factor was found by explicitly seeking the gradient of zero particle flux by calculating the electron flux for several values of the density gradient. A typical set of simulations is displayed in Fig. 1(a), where the time evolution of the electron flux for three density gradients near the gradient of zero particle flux is shown (fluxes are in gyro-Bohm units, with ). A second order polynomial was then fitted to the data closest to the zero flux gradient and then the was found as the appropriate root of . The error for was approximated by finding the corresponding roots of , and using the difference between these roots as a measure of the error. In Fig. 1(b) the particle flux spectrum for a NL simulation for CBC near this gradient is shown. The figure illustrates that the total flux is zero due to a balance of inward and outward transport occurring at different wavenumbers. The method for finding from the QL simulations is the same, but here a reduced treatment was used, including only the dominant mode, which is an ITG mode for CBC-like parameters. This was done for a range of values of several key plasma parameters.
In the trace impurity limit, i.e. when the fraction of impurities is sufficiently small, the impurity dynamics do not affect the turbulence dynamics. Therefore, when finding the simultaneous peaking factor of the background and impurities, the former can be found first and used in the simulations of the latter without loss of generality. Furthermore, in the trace impurity limit, the transport coefficients of Eq. (1) for trace impurities do not depend on the species’ gradients of density and temperature, meaning that (1) is a linear relation in those gradients. This means that the impurity peaking, as well as the contribution to from the thermodiffusion () and the convective velocity (), can be found from simulations with appropriately chosen gradients using the method outlined in Casson2010 . The peaking factors are calculated for several impurity species, using the reduced QL model. The difference in impurity peaking factors between NL and QL models has been covered in previous work.Nordman2011 ; Skyman2011a ; Skyman2011b ; Skyman2014
The simulations have been performed in a circular equilibrium with aspect ratio , using kinetic ions, electrons and impurities, except when studying the effects of shaping. Then the Miller equilibrium model was used instead.Miller1998 Impurities were included at trace amounts (), so as not to affect the turbulent dynamics. The impurities mass was assumed to be , where is the charge number. The dynamics were further assumed to be electrostatic ().
For the simulation domain, a flux tube with periodic boundary conditions in the perpendicular plane was used. The nonlinear simulations were performed using a grid in the normal, bi-normal, and parallel spatial directions respectively; in the parallel and perpendicular momentum directions, a grid was used. For the linear and quasilinear computations, a typical resolution was grid points in the parallel and normal directions, with grid points in momentum space. The nonlinear simulations were typically run up to for the experimental geometry scenario, where is the major radius and .
III Simultaneous stationary profiles of electrons and impurities
First, we examine the dependence of the transport and of on the ion temperature gradient. The result is shown in Fig. 2, where the ion energy transport from NL simulations is displayed, together with electron peaking factors from NL and QL simulations. Though the ion energy transport shows a stiff increase with the driving gradient, only a moderate reduction is seen in the peaking factor.
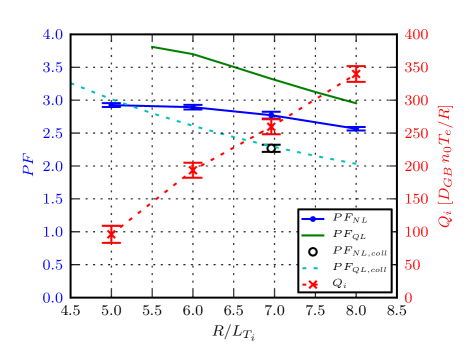

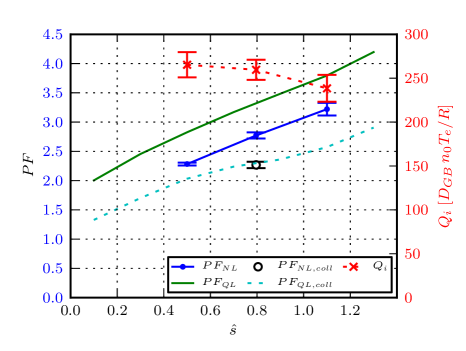
It is worth noting that the steady state peaking found in the simulations is considerably higher than that in the original CBC experiment (). As is knownAngioni2005 ; Angioni2009b ; Angioni2009c ; Fable2010 , this is due to the neglect of collisions, as they normally are in the CBC. The collisionality for the CBC parameters is , which is of the same order as the growthrates and real frequencies observed, and collisions can be expected to have a notable impact on the transport. When collisions are added, the background peaking factor is indeed lowered to a level consistent with the prescribed background gradient for the CBC, as seen in Fig. 2. The QL peaking factor shows a stronger decrease than its NL counterpart. Below , the ITG mode is stable, and the TE mode dominates. In the following, focus is on the collisionless case, but the simulations have been complemented with scalings including collisions.
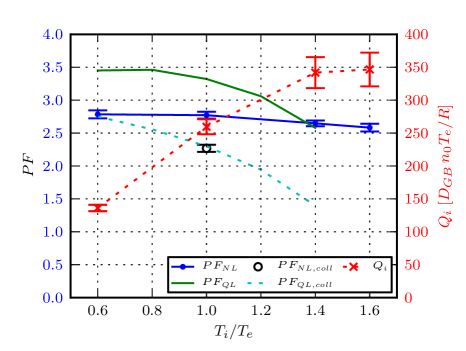
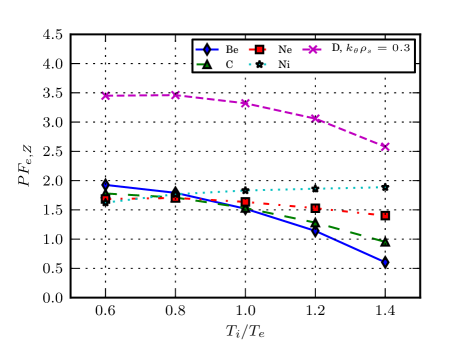
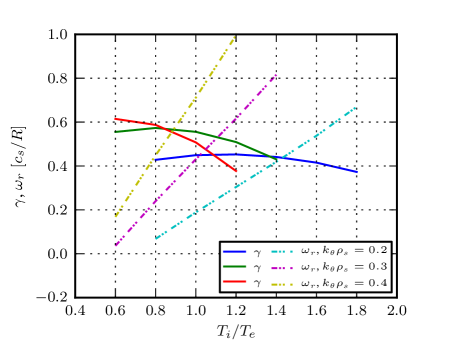
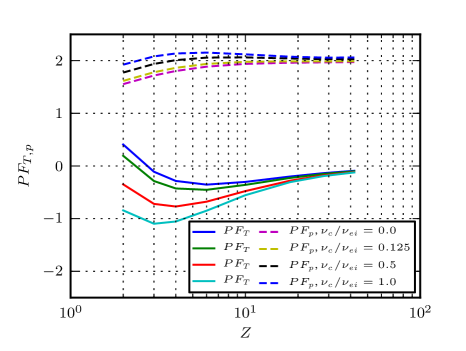
The electron peaking factor is reduced with increasing ion–electron temperature ratio () for CBC parameters, as can be seen in Fig. 3(a). As with the temperature gradient, the NL results show only a weak scaling, while the trend is more pronounced for the QL simulations. This may be a result of the QL treatment, which only includes the dominant mode, while the contribution from the subdominant TE mode is non-negligible for low values of . A more complete QL treatment may give a better agreement.Bourdelle2007 ; Fable2010 In Fig. 3(b), the selfconsistently obtained quasilinear peaking of electrons and impurities (Be (), C (), Ne (), and Ni ()) is shown. Impurities with lower charge numbers (), as well as the background, show the same dependence on , with a decrease in the peaking as the ion temperature is increased, and a weaker tendency for smaller wavenumbers. For the impurities with higher , on the other hand, increased ion temperature leads to slightly more peaked impurity profiles. In Fig. 3(c) it is shown that the effect for the impurities is mainly due to an increase in the relative contribution from the outward thermopinch () with increased ion temperature, which affects the low impurities more strongly. To first order, the thermopinch is proportional to the real frequency. As seen in Fig. 3(d) it increases with increasing , which explains its increasing importance for higher ion temperatures.
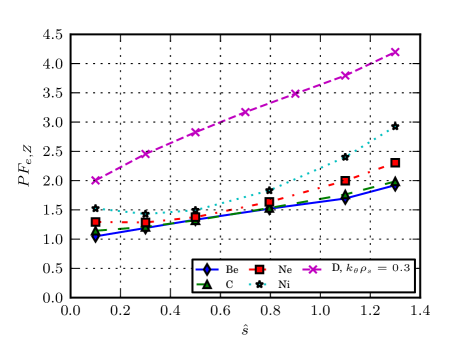
In Fig. 4(a), the scaling with magnetic shear () is studied. The electron peaking shows a strong and near linear dependence on . This is similar to the results reported in Ref. Fable2010, and is due to the shear dependence of the curvature pinch. This trend is as strong in both the QL and NL simulations. The effect of shear on the linear eigenvalues is not monotonous, with a destabilisation in the low to medium shear region followed by stabilisation as is increased further. The selfconsistent results are shown in Fig. 4(b). For the impurities, the change in peaking factors due to magnetic shear follows the trend seen for the electrons, and impurities with higher are more strongly affected. This is seen in Fig. 4(c) to be due mainly to a stronger inward convective pinch with increasing shear.
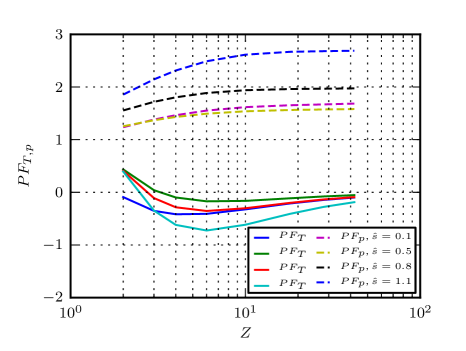
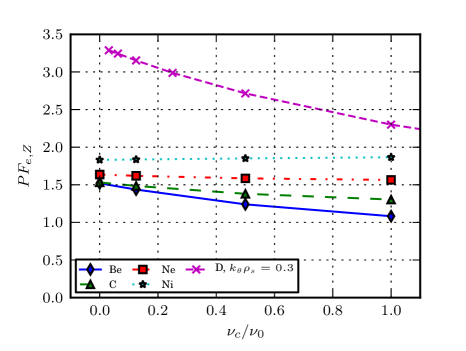
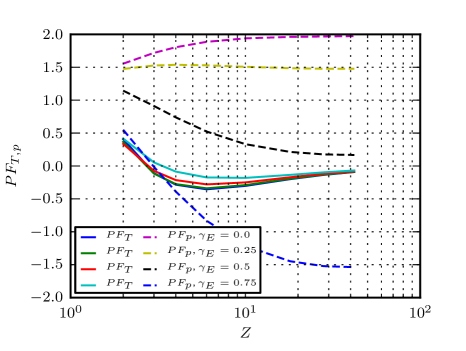
Next we cover the effect of electron–ion collisions on the peaking factors. Collisionality is known to affect the background by reducing the peaking factor.Angioni2005 ; Angioni2009a ; Angioni2009c ; Fable2010 In Fig. 5(a), the selfconsistent results for a range of collisionalities are shown. The reduction in peaking factors with collisionality is also seen for low impurities, while the high- impurities show little or no change in peaking due to collisions. The effect on the impurities is mainly due to an increase in the outward thermopinch () with increased collisionality (Fig. 5(b)), due to a change of the real frequency.
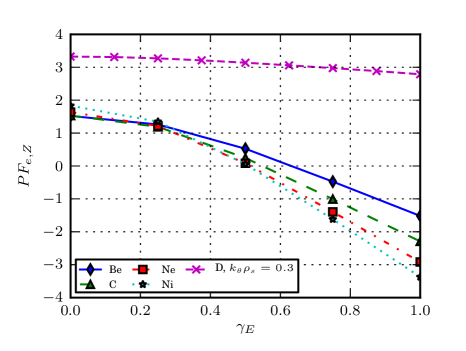
The influence of sheared toroidal flows on the selfconsistent impurity peaking was also studied. Only purely toroidal rotation was considered, included through the shearing rate, defined as . Hence, we flow shear in the limit where the flow is small, neglecting effects of centrifugal and Coriolis forces. These may, however, be important for heavier impurities.Camenen2009 The results are shown in Fig. 6(a), where it can be seen that impurities are much more strongly affected by the rotation than the electrons, due to the difference in thermal velocity. For large values of , a strong decrease in impurity peaking is seen. The effect is due to the outward roto-pinch which becomes important for large values of , as shown in Fig. 6(b). As with the shearing rate, this effect is more pronounced for high- impurities, since the thermopinch dominates for low values. In ASDEX U roto-diffusion has been found to be a critical ingredient to include in order to reproduce the Boron profiles seen in experiments.Angioni2011 ; Casson2013
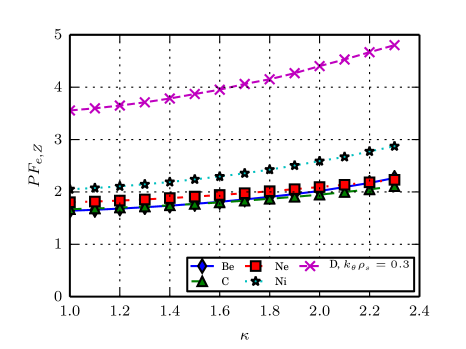
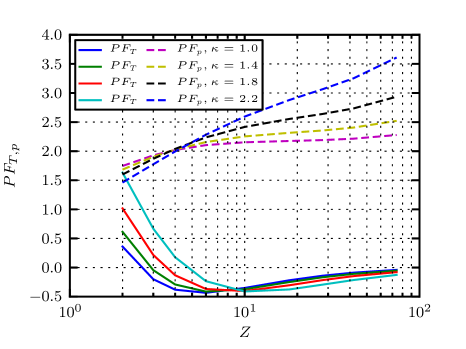
Finally, shaping effects were studied using the Miller equilibrium model. The quasi-linear electron peaking factor as well as the self-consistent impurity peaking factors increase with higher elongation as shown in Fig. 7(a). For impurities with low charge number the increase in peaking is mainly due to a larger inward thermopinch while for high- impurities it is caused by an increased pure convection, as seen in Fig. 7(b).
The dependence of the selfconsistent peaking factors on the safety factor () and triangularity () was also studied, and the scalings were found to be very weak.
IV Isotope effects on the background peaking
The CBC prescribes hydrogen ions as the main ions, however, for future fusion power plants, a deuterium/tritium mixture will be used. Due to the difference in mass, it is known that D and T plasmas will behave differently from pure H plasmas. Differences in steady state peaking factors are expected, since both collisions and non-adiabatic electrons can break the gyro-Bohm scaling.Pusztai2011 To get an insight into the effect of the main ion isotope, the scalings for the normal CBC were compared with simulations where D was substituted for H and T.
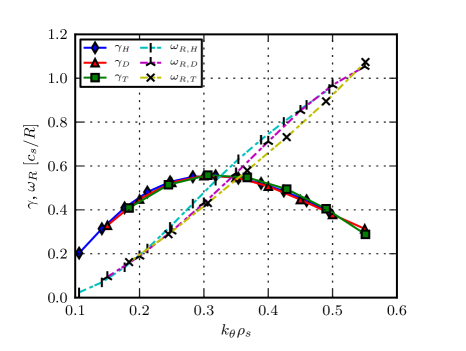
First, we review the known isotope effects on linear eigenvalues. Figure 8 displays the ITG eigenvalues in the collisionless case for H, D, and T in species units. The slight difference in eigenvalues obtained is due to the non-adiabatic electron response into which the mass ratio enters, as discussed in Ref. Pusztai2011, .
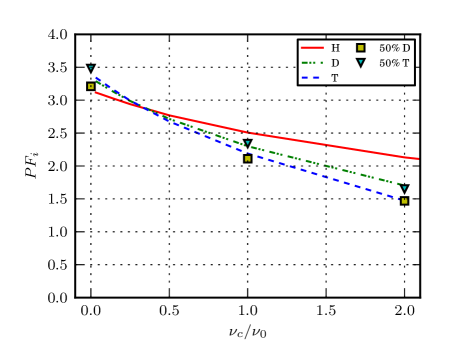
The QL background peaking versus collisionality is displayed in Fig. 9(a) for in species units, corresponding to the peaks in the growthrate spectra. For , a slight difference in is observed, with . This is consistent with the asymmetry in D and T transport reported in Refs. Estrada-Mila2005, ; Nordman2005, . For larger values of the collisionality, however, the order is reversed.
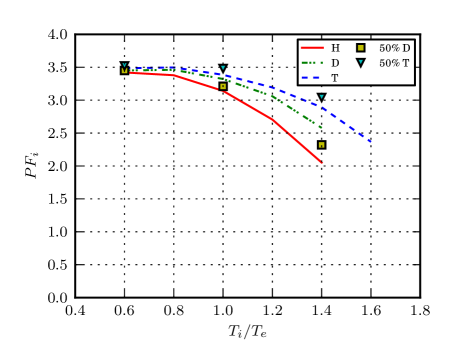
Next, the effect of the ion mass on the stationary profile scaling with ion to electron temperature ratio () is studied. In Fig. 9(b), the peaking factor is seen to decrease with increasing ion temperature, but in this case the lighter isotopes are more sensitive, showing a stronger decrease with . The other parameter scalings discussed in section III show only a very weak isotope effect.
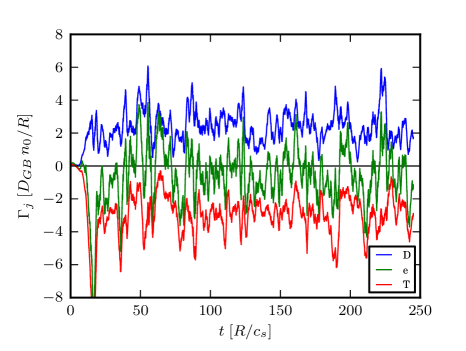
The scenario with a 50/50 mixture of D and T was also studied, and the simultaneous peaking of D and T calculated. The results were seen to follow the pure D and pure T results closely, albeit with the T profile approximately 10% more peaked than the D profile for all values of the collisionality; see Fig. 9(a). For the scan with , the self-consistent case gave a larger difference in D and T peaking than the corresponding pure cases, as seen in Fig. 9(b). These results were corroborated by NL simulations using the standard CBC parameters, with the background electron density gradient corresponding to zero flux for the pure D case (). The results are shown in Fig. 10. For these parameters, the electron particle flux remained close to zero, while the deuterium flux was postivive and the tritium flux negative, indicating a more peaked steady state D profile, and a less peaked T profile in the mixed scenario.
The effect of main ion mass on the stationary profiles discussed here are weak, but may result in a D–T fuel separation in a fusion plasma.Estrada-Mila2005
V Conclusions
In the present paper electron and impurity particle transport due to Ion Temperature Gradient/Trapped Electron (ITG/TE) mode turbulence was studied using gyrokinetic simulations. A reduced quasilinear (QL) treatment was used together with nonlinear (NL) simulations using the code GENE. Neoclassical contributions to the impurity transport, which may be relevant for high- impurities, were neglected. The impurities, with impurity charge in the region , were included in low concentrations as trace species. The focus was on a selfconsistent treatment of particle transport, where the stationary local profiles of electrons and impurities are calculated simultaneously corresponding to zero particle flux. The zero flux condition is relevant to the core region of tokamaks where the particle sources are absent or small. The parameters were taken from the Cyclone Base Case, corresponding to ITG dominated turbulence with a subdominant TE mode relevant for the core region of tokamaks, and scalings of the stationary profiles with magnetic shear, safety factor, electron-to-ion temperature ratio, collisionality, sheared toroidal rotation, elongation and triangularity were investigated.
It was shown that the stationary background density profile was sensitive in scans over magnetic shear, collisionality, elongation, and temperature ratio, for which the simultaneous zero flux electron and impurity profiles are calculated. The selfconsistent treatment mainly tended to enhance these parameter scalings of the impurity profile peaking. For safety factor, sheared toroidal rotation and triangularity on the other hand, the effects on the electron profile were weak and hence a selfconsistent treatment did not add significant new results to the previous investigations in this area. For all considered cases, both the electron profile and the impurity profile were found to be inwardly peaked, with peaking factors typically in the range –, i.e. substantially below neoclassical expectations. For large sheared toroidal rotation (), a flux reversal resulting in outwardly peaked impurity profiles was seen. Furthermore, the electrons were consistently more peaked than the impurities.
In addition, a slight asymmetry between hydrogen, deuterium and tritium with respect to profile peaking was obtained. The effect was more pronounced for high collisionality plasmas and large ion to electron temperature ratios. The effect may have consequences for fuel separation in D–T fusion plasmas.
Acknowledgements
This work was funded by a grant from The Swedish Research Council (C0338001).
The main simulations were performed on resources provided on the Lindgren222See http://www.pdc.kth.se/resources/computers/lindgren/ for details on Lindgren high performance computer, by the Swedish National Infrastructure for Computing (SNIC) at Paralleldatorcentrum (PDC).
The authors would like to thank F Jenko, T Görler, MJ Püschel, D Told, and the rest of the GENE team at IPP–Garching for their valuable support and input.
References
- (1) M. Fröjdh, M. Liljeström, and H. Nordman, Nucl. Fusion 32, 419 (1992).
- (2) R. Basu, T. Jessen, V. Naulin, and J. J. Rasmussen, Phys. Plasmas 10, 2696 (2003).
- (3) C. Angioni, A. G. Peeters, F. Jenko, and T. Dannert, Phys. Plasmas 12, 112310 (2005).
- (4) C. Estrada-Mila, J. Candy, and R. W. Waltz, Phys. Plasmas 12, 022305 (2005).
- (5) V. Naulin, Phys. Rev. E 71, 015402 (2005).
- (6) C. Angioni and A. G. Peeters, Phys. Rev. Lett. 96, 095003 (2006).
- (7) R. Guirlet, C. Giroud, T. Parisot, M. E. Puiatti, C. Bourdelle, L. Carraro, N. Dubuit, X. Garbet, and P. R. Thomas, Plasma Phys. Contr. F. 48, B63 (2006).
- (8) C. Bourdelle, X. Garbet, F. Imbeaux, A. Casati, N. Dubuit, R. Guirlet, and T. Parisot, Phys. Plasmas 14, 112501 (2007).
- (9) N. Dubuit, X. Garbet, T. Parisot, R. Guirlet, and C. Bourdelle, Phys. Plasmas 14, 042301 (2007).
- (10) H. Nordman, T. Fülöp, J. Candy, P. Strand, and J. Weiland, Phys. Plasmas 14, 052303 (2007).
- (11) C. Angioni and A. G. Peeters, Phys. Plasmas 15, 052307 (2008).
- (12) H. Nordman, R. Singh, T. Fülöp, L.-G. Eriksson, R. Dumont, J. Anderson, P. Kaw, P. Strand, M. Tokar, and J. Weiland, Phys. Plasmas 15, 042316 (2008).
- (13) C. Angioni, A. G. Peeters, G. V. Pereverzev, A. Bottino, J. Candy, R. Dux, E. Fable, T. Hein, and R. E. Waltz, Nucl. Fusion 49, 055013 (2009).
- (14) C. Angioni, E. Fable, M. Greenwald, M. Maslov, A. G. Peeters, H. Takenaga, and H. Weisen, Plasma Phys. Contr. F. 51, 124017 (2009).
- (15) Y. Camenen, A. G. Peeters, C. Angioni, F. J. Casson, W. A. Hornsby, A. P. Snodin, and D. Strintzi, Phys. Plasmas 16, 012503 (2009).
- (16) S. Moradi, M. Z. Tokar, R. Singh, and B. Weyssow, Nucl. Fusion 49, 085007 (2009).
- (17) E. Fable, C. Angioni, and O. Sauter, Plasma Phys. Contr. F. 52, 015007 (2010).
- (18) T. Fülöp, S. Braun, and I. Pusztai, Phys. Plasmas 17, 062501 (2010).
- (19) S. Futatani, X. Garbet, S. Benkadda, and N. Dubuit, Phys. Rev. Lett. 104, 015003 (2010).
- (20) T. Hein and C. Angioni, Phys. Plasmas 17, 012307 (2010).
- (21) C. Angioni, R. McDermott, E. Fable, R. Fischer, T. Pütterich, F. Ryter, G. Tardini, and the ASDEX Upgrade Team, Nucl. Fusion 51, 023006 (2011).
- (22) H. Nordman, A. Skyman, P. Strand, C. Giroud, F. Jenko, F. Merz, V. Naulin, T. Tala, and the JET–EFDA contributors, Plasma Phys. Contr. F. 53, 105005 (2011).
- (23) A. Skyman, H. Nordman, and P. Strand, Phys. Plasmas 19, 032313 (2012).
- (24) A. Skyman, H. Nordman, and P. Strand, Nucl. Fusion 52, 114015 (2012).
- (25) F. J. Casson, R. M. McDermott, C. Angioni, Y. Camenen, R. Dux, E. Fable, R. Fischer, B. Geiger, P. Manas, L. Menchero, G. Tardini, and the ASDEX Upgrade Team, Nucl. Fusion 53, 063026 (2013).
- (26) A. Skyman, L. Fazendeiro, D. Tegnered, H. Nordman, J. Anderson, and P. Strand, Nucl. Fusion 54, 013009 (2014).
- (27) http://www.ipp.mpg.de/~fsj/gene/.
- (28) F. Jenko, W. Dorland, M. Kotschenreuther, and B. N. Rogers, Phys. Plasmas 7, 1904 (2000).
- (29) F. Merz, Gyrokinetic Simulation of Multimode Plasma Turbulence, Ph.d. thesis (monography), Westfälischen Wilhelms-Universität Münster (2008).
- (30) A. M. Dimits, G. Bateman, M. A. Beer, B. I. Cohen, W. Dorland, G. W. Hammett, C. Kim, J. E. Kinsey, M. Kotschenreuther, A. H. Kritz, L. L. Lao, J. Mandrekas, W. M. Nevins, S. E. Parker, A. J. Redd, D. E. Shu-maker, R. Sydora, and J. Weiland, Phys. Plasmas 7, 969 (2000).
- (31) C. Angioni, Y. Camenen, F. J. Casson, E. Fable, R. M. McDermott, A. G. Peeters, and J. E. Rice, Nucl. Fusion 52, 114003 (2012).
- (32) F. J. Casson, A. G. Peeters, C. Angioni, Y. Camenen, W. A. Hornsby, A. P. Snodin, and G. Szepesi, Phys. Plasmas 17, 102305 (2010).
- (33) R. L. Miller, M. S. Chu, J. M. Greene, Y. R. Lin-Liu, and R. E. Waltz, Phys. Plasmas 5, 973 (1998).
- (34) C. Angioni, J. Candy, E. Fable, M. Maslov, A. G. Peeters, R. E. Waltz, and H. Weisen, Phys. Plasmas 16, 060702 (2009).
- (35) I. Pusztai, J. Candy, and P. Gohil, Phys. Plasmas 18, 122501 (2011).
- (36) H. Nordman, P. Strand, A. Eriksson, and J. Weiland, Plasma Phys. Contr. F. 47, L11 (2005).
- (37) See http://www.pdc.kth.se/resources/computers/lindgren/ for details on Lindgren.