Coarse-grained modeling of protein unspecifically bound to DNA
Abstract
There is now a certain consensus that Transcription Factors (TFs) reach their target sites, where they regulate gene transcription, via a mechanism dubbed facilitated diffusion (FD). In FD, the TF cycles between events of 3D-diffusion in solution (jumps), 1D-diffusion along DNA (sliding), and small jumps (hopping) achieving association rates higher than for 3D-diffusion only. We investigate the FD phenomenology through Molecular Dynamics simulations in the framework of coarse-grained modeling. Despite the crude approximations, we show that the model generates, upon varying equilibrium distance of the DNA-TF interaction, a phenomenology matching a number of experimental and numerical results obtained with more refined models. In particular, by focusing on the kinematics of the process, we characterize the geometrical properties of TF trajectories during sliding. We find that sliding occurs via helical paths around the DNA helix leading to a coupling of translation along the DNA-axis with rotation around it. The 1D-diffusion constant measured in simulations is found to be interwoven with the geometrical properties of sliding and we develop a simple argument able to quantitatively reproduce the measured values.
pacs:
87.10.Tf, 87.14.gk, 87.15.VvKeywords: Facilitated Diffusion, Coarse-Grained Modelling, Transcription Factor, Molecular Dynamics.
1 Introduction
Transcription Factors (TFs) play a key role in the regulation of gene expression acting as gene-transcription activators or inhibitors both in prokaryotes and eukaryotes [1]. One of the most fundamental issues in protein-DNA recognition is the ability of TFs to selectively identify their specific target sites that are embedded among tens of millions of competing non-specific DNA sequences. A related issue pertains to the high rate of recognition of the specific target sites. As early as 1970, Riggs et al. [2] observed that the lac repressor in E. coli can associate to the cognate operator sequence at a rate about two orders of magnitude higher than that predicted by Smoluchowski equation for a diffusion-limited association reaction.
Berg, Winter and von Hippel [3] explained this paradox suggesting that TFs do not target their sequences through pure 3D-diffusion but they can also diffuse while being unspecifically associated (mainly due to electrostatic interactions [4]) to the DNA. Such a dimensional reduction, dubbed facilitated diffusion (FD), can make the search more efficient speeding up the identification of target sites. More specifically, FD proceeds by means of four pathways [3]: sliding along the DNA, hopping, jumping and intersegmental transfer. During sliding, the TF remains in unspecific contact with the DNA chain performing monodimensional diffusion along its contour. During hopping, the TF detaches from the DNA but reassociates with it at a short distance from the dissociation point. During jumping, the TF dissociates from the DNA undergoing free 3D-diffusion and rebounds to the DNA in a completely uncorrelated location. Finally, in the intersegmental transfer, relevant to compact DNA conformation, the TF transiently binds two non-contiguous DNA branches allowing its transfer from one DNA segment to the other. The latter process requires the possibility for the TF to bind at multiple loci.
Facilitated diffusion has been extensively studied through analytical models [3, 4, 5, 6] which achieve closed-form solutions at the price of a drastic simplification in the complexity and the heterogeneity of the genome. The approximation of the TF-DNA affinity landscape, for instance, may lead to significant deviations from the experimental patterns. A more detailed level of description is based on computational stochastic models which allow large-scale simulations involving DNA stretches of the order of bp, tens of thousands of TFs and can reach the time-scale of a few seconds [7, 8]. This high performance, however, relies on a set of assumptions that are considered quite controversial and that need further elucidation. More specifically, the issues include (i) the proportion of sliding and hopping during 1D-diffusion; (ii) the fraction of time the TF spends in 3D- and 1D-diffusion; (iii) the effects of molecular crowding related to the presence of multiple copies of the TF that prevent each other’s movement acting as moving roadblocks.
In order to clarify these issues, experimental studies can be profitably integrated with coarse-grained molecular simulations. For instance, while fluorescence experiments have allowed the direct observation of a single TF moving along DNA (confirming the facilitated diffusion theory) [9], the spatial resolution of the technique does not discriminate hopping from sliding. Thus a quantitative characterization of the two kinds of motion still remains elusive. Another source of ambiguity concerns the values of the mono- and tri-dimensional diffusion constants. While there is a general consensus on the fact that , the measured values of these constants vary by several orders of magnitude according to the particular DNA sequence and the experimental set-up [10, 11]. This variability is anything but irrelevant since it is closely related to the so-called speed-stability paradox [5, 12]. In fact, on the one hand, a high diffusion constant allows a fast scanning of non-specific sites improving the search of the target sequences, on the other hand, high values can only be attained at the price of a low TF-DNA affinity that may destabilize the complex formed by the TF with its specific target site.
Another problem that has not yet come to a conclusive answer is the fraction of time spent by the TF in 3D-diffusion and in sliding. Assuming that only sliding and jumping are at work, simple analytical arguments [4, 5] suggest that the average time necessary to reach the target is , where is the total number of sites, is the average number of sites scanned during a sliding event and and are the average durations of individual episodes of sliding and 3D-diffusion, respectively. Assuming that the search time has been to some extent optimized by evolution, is minimal if , i.e. when the TF spends exactly the same amount of time in sliding and 3D-diffusion. This hypothesis of optimality, however, contrasts with experimental studies in bacteria suggesting that the TF spends much more time in sliding than in 3D-diffusion () [9]. Even though the discrepancy may be due to the absence of hopping in the above argument, of course, one cannot exclude that evolution has selected a suboptimal solution.
All of these problems can be addressed through Molecular Dynamics simulations but unfortunately not in the framework of atomistic methods. The longest atomistic simulation on DNA reported to date has been a few microseconds [13] while sliding events typically involve timescales of and sliding length of bp [14]. Thus, it is clear why atomistic MD is unfit to the study of facilitated diffusion and the resorting to a coarse-grained phenomenological modeling is mandatory. Recently, Brackley et al. [15] introduced a coarse-grained model portraying the TF as a sphere with a binding site on its surface and the DNA as a chain of beads. The model, also accounting for both DNA flexibility and sequence heterogeneity, showed that the search time could be minimized by an appropriate tuning of the TF-DNA affinity. Givaty and Levy [16] proposed a much more detailed model whereby DNA is simplified as a double stranded helix with three beads per nucleotide, while the TF is described as a bead for each residue. Levy’s simulations show that during sliding the TF remains deeply buried into the major groove and presumably makes use of the same binding interfaces for both specific and non-specific DNA interactions.
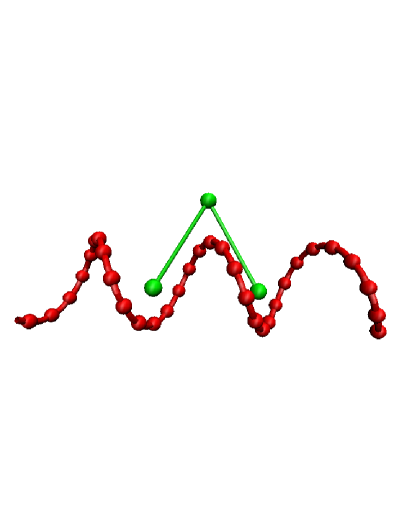
In this work, we introduce and study a model with a level of resolution intermediate between those mentioned above. With reference to Fig. 1, a TF is portrayed as a triangular object with the first and last bead representing the DNA binding regions, so to mimic the basic features of homodimeric prokaryotic TFs. The central bead models the scaffold of the protein imparting the correct orientation to the DNA-binding domains. The DNA is represented by a single helix frozen in its equilibrium conformation as it greatly facilitates the identification of the various searching regimes.
The aim of our work is to develop a toy model including as few ingredients as possible, yet able to capture the known phenomenology of TF dynamics unspecifically bound to DNA. The approach enabled us to connect the mono-dimensional diffusion coefficient to the geometrical properties of the TF trajectories confirming previous results [17, 18]. This suggests that two minimal key-elements are sufficient: the helical topology of DNA and a confining DNA-TF interaction tethering the TF in the neighborhood of DNA.
We restricted our study to the case of purely non-specific TF-DNA interaction whose importance cannot be underestimated, as it is reasonable to assume that a TF before reaching its target spends most of the time in non-specific attraction with DNA sites. On the other hand, this is at the core of the searching process, which being “unproductive”, requires speeding mechanisms or optimal pathways to be shortened.
A preliminary exploration of parameter space has been performed to obtain behaviors that reasonably matched the principal features of the facilitated diffusion phenomenology. Then we run simulations to analyze the TF dynamics in the DNA proximity in order to characterize the interplay between three searching modes: sliding, hopping, and free diffusion. As we shall see, our simulations show the existence of these three different regimes whose mutual prominence depends on , the minimum of the Lennard-Jones (LJ) potential, that dramatically affects the energy landscape. Specifically, we found that sliding occurs via the coupling of rotation and translation along the DNA, in which the TF propagates one- dimensionally along the DNA while rotating along the DNA-helical contour. This characteristic motion is consistent with experimental observations for several proteins [19].
Finally we have also quantified how each mechanism contributes to search efficiency.
2 MATERIALS AND METHODS
2.1 Model
In the following we briefly describe the coarse-grained representation used in this study for the DNA chain and the transcription Factor.
DNA helix During the simulations the DNA was kept frozen in its initial configuration so that DNA beads, used to represent DNA bases, do not interact with one another. The DNA configuration is chosen to be a straight helix as, unlike Ref. [15], we want to retain the helical geometry in order to understand its effect on the FD process. However, since we adopt a very crude model for the TF (see below), we do not need the detailed description of the DNA double helix proposed in Ref. [16]. We thus consider a minimal representation in terms of a single straight helix where each bead represents a base-pair (bp). In particular, to mimic the typical conformation of B-DNA [1] we consider an helix of radius Å with base-pairs per helix turn and the distance between two consecutive bases along the DNA axis (here chosen to be along ) is taken to be Å , so that the helix pitch is Å . In this way the coordinates of the -th bead are simply obtained from the parametric equations of the helix
| (1) |
The total number of base-pairs in our simulations is which is larger than the DNA persistence length (about bp in physiological conditions [1]). However, assuming a linear conformation longer than that found in vivo is relevant to single molecule experiments, where DNA chains are typically stretched (see, e.g., [20]).
Transcription Factor The modeling of the TF requires some discussion. In prokaryotes, TFs are typically homodimeric as they target palindromic DNA sequences [21]. In each monomeric subunit the DNA recognition region is an helix-loop-helix motif whereby the second helix is designed to fit into the major groove establishing hydrogen bonds and hydrophobic interactions with the nucleotide bases. Since the helix-loop-helix motifs of the two subunits must fit into two adjacent major grooves, they are located at the typical distance of one pitch Å. In eukaryotes, TFs can be both homodimeric and heterodimeric so as to increase the range of DNA sequences to be recognized. For instance, steroid hormones receptors are typical homodimeric receptors while the TFs containing the leucine zipper motif are normally heterodimeric and the helix-loop-helix TF can be both homo- and heterodimeric [21]. Our modeling approach aims at reproducing the basic features of prokaryotic TFs. Therefore, we portray the TF as three beads arranged at the vertices of an equilateral triangle of side 32 Å, to roughly fit the distance between two major grooves. A variation of the side in the range Å or isosceles TF conformations do not affect the essence of the results. The first and third bead can be thought of as the centers of mass of the DNA-recognizing regions of the two subunits. The third bead represents the center of mass of the portion of the TF not directly involved in DNA recognition, which typically stays away from the DNA helix.
The TF triangular structure is enforced by the following interactions. The 1-2 and 2-3 distances of the TF beads are allowed to undergo small oscillations around their equilibrium value, , via a stiff harmonic potential [22]
| (2) |
whereas the distance 1-3 is maintained via a bending potential
| (3) |
Being interested in the phenomenology of FD and not in the target search time, we assume only unspecific interactions between the TF and the DNA chain, which are modeled as described below. Bead 1 and bead 3 interact with the DNA beads through a standard 12-10 Lennard-Jones (LJ) potential
| (4) |
where is the distance between bead of the TF and bead of the DNA. The parameter determines the well depth of the LJ potential while tunes the position of the minimum. Thus determines the equilibrium distance of the TF from the helix axis, the larger is the farther is the equilibrium position of TF from DNA. Conversely, the bead 2 of the TF interacts with the nucleotides of DNA through a repulsive, excluded-volume potential
| (5) |
This potential forces the central bead of the TF to point away from the DNA axis imparting the correct orientation to the transcription factor. In our simulation, we keep fixed to set the energy scale and varied in a wide range of values. For the sake of clarity, the list and the values of the parameters defining the DNA-TF model are summarized in Table 1.
Simulation box Since the focus of our investigation was the sliding behavior of the TF, we introduced a cylindrical confinement potential [23]:
| (6) |
In this expression is the distance between a TF bead and the DNA axis that was set to coincide with the -axis, is the distance along the -axis between the bead of the TF and the center of mass of the DNA, Å is the radius of the cylindrical confinement region. The parameter represents half the height of the confinement region that we set equal to half the length of DNA plus 1.5 helical turns. The component of the confinement potential forces the TF to remain in a circular region of radius centered on the DNA axis while the component prevents the TF to exceed a distance equal to from the DNA center of mass along the -axis.
The value Å for the simulation box can be justified using the following argument. The average volume available to interphasic-DNA spans the range Å3. We can assume that this is the volume of a spherical region with being the DNA gyration radius. Following Berg and Blomberg [24], we can construct around the DNA contour a coaxial cylinder with a volume equivalent to the sphere , where Å is the typical DNA-length. This yields values of in the range Å. On not too long timescales, the TF may be reasonably assumed to be confined in a cylindrical region of radius around a DNA segment. Since metaphasic DNA is more condensed, it can be assumed to be confined in a cylindrical region with a smaller radius . In this situation, the TF can be expected to spend a smaller fraction of time in 3D-diffusion similar to what happens for small values of (see Sect. 3.1). Moreover the TF will have a greater tendency to rebind the DNA in the neighborhood of the point of detachment. In this regime there will be only a weak interplay between sliding and 3D-diffusion, leading to a low efficiency of exploration of new sites (see Sect. 3.4). This appears to be consistent with the fact that tightly packed DNA is normally not transcribed nor replicated but rigidly transferred to daughter cell during mitosis.
We performed Langevin Molecular Dynamics simulations using a stochastic position Verlet integration scheme [25] with time step and friction coefficient (see Table 1). The simulation time unit can be converted to the physical one by using the time scale [26]. With J, Å , and assuming an average mass KDa for each bead of the TF, we obtain ps.
As customary, the Lennard Jones interactions were truncated to a cutoff distance to speed up the calculations.
| Parameter | Value | Parameter | Value |
|---|---|---|---|
| Å | |||
| Å | |||
2.1.1 Statistical analysis
2.1.2 Determination of sliding, hopping and jumping events
As discussed in the introduction, the process of facilitated diffusion proceeds by means of four pathways [3]: (i) sliding along the DNA, (ii) hopping, (iii) jumping and (iv) intersegmental transfer. In our model, due to the chosen conformation for the DNA chain, only the first three mechanisms are at work. In order to compute the statistics of sliding, jumping and hopping, it is necessary to define the criteria discriminating each event, which are described below.
We consider the TF to be in the sliding regime if the closest DNA neighbor of bead-1 or bead-3 of the TF is below a distance cutoff of . This criterion allows the identification of a number of sliding and non-sliding windows. With this criterion it may happen that the TF is bound to the DNA with only one bead while the other is detached. We have studied the statistics of such events and found that when sliding occurs the percentage of time spent in two-bead sliding is: higher than for Å; between and for ÅÅ; and decreases up to a few for Å.
For each value of , the average sliding length, is measured as the average distance covered by TF between an attachment and the first subsequent detachment. Non-sliding windows are classified as hopping events if the displacement of the TF along the DNA axis is smaller than twice , otherwise the event is considered as jumping. The idea underlying this choice is that hopping implies short-range flights between dissociation and reassociation points [27].
Clearly, the discrimination between sliding and hopping, and hopping and jumping suffers of a certain degree of arbitrariness due to the necessity to introduce specific thresholds on distances. However, upon varying the threshold values, we verified the results are qualitatively the same but for some quantitative effects on hopping statistics.
2.1.3 Computation of the sliding diffusion constant
The monodimensional diffusion process of the TF during sliding is characterized by the diffusion coefficient, , along the DNA axis. The constant can be estimated through the trajectories of molecular dynamics from the mean square deviation (MSD) along the -axis during the sliding events. First, the trajectory of the TF is segmented into sliding, hopping and jumping events as described above. Second, in each sliding window one computes the MSD on the window as (see e.g. [28])
| (7) |
where is the time interval between two successive measurements, the total number of measurements in and indicates the z-coordinate of an attractive bead of the TF at time . The square deviations (7) are then averaged over all the sliding windows of all trajectories such that :
| (8) |
Since our TF is perfectly symmetric, the calculation is independent on the chosen bead apart from statistical fluctuations whose impact can be minimized by averaging the results of the two equivalent attractive beads. This averaged quantity provides an estimation of the mean square displacement along over a time interval , which for a diffusive process behaves as
| (9) |
The constant is finally obtained by linear regression.
2.1.4 Computation of exploration efficiency
The efficiency of DNA exploration by the TF can be estimated from the fraction of DNA sites not yet visited by the TF during the sliding . The procedure we used follows Ref. [16] and is described below. At the beginning of each run the counter of newly probed DNA basis is set to zero. Then, at the beginning of every sliding window within the run, each DNA bead is marked with a flag ”zero”. Then if the DNA bead closest to one of the TF attractive bead is within a distance of 1.2 from the latter, the corresponding flag is switched to “1” and the counter of probed sites increased by 1. At the end of each sliding event, when the TF detaches from DNA, the counter is normalized to the number of DNA sites to get the fraction of sites explored in that sliding event. Then the flag vector is reset to zero. The overall fraction of visited sites is just the sum of the fractions of sites visited in all the sliding windows in each run. This quantity is then averaged over all runs to yield . The strategy to reset the flag vector to zero is motivated by the assumption that when the TF detaches from DNA, it is likely to reassociate to a completely uncorrelated sequence exploring a completely new patch of DNA.
3 RESULTS
Experimental studies of facilitated diffusion in vitro are conducted by varying the salt concentration which influences the occurrence of the different transport modes [29, 30, 31]. As we shall see, in our model a similar behavior is obtained by changing the parameter , the equilibrium distance between TF and DNA helix. An increase in the salt concentration enhances the screening of electrostatic interactions and thus increases the TF-DNA equilibrium distance, which in our model is controlled by .
3.1 Statistics of sliding, hopping and jumping
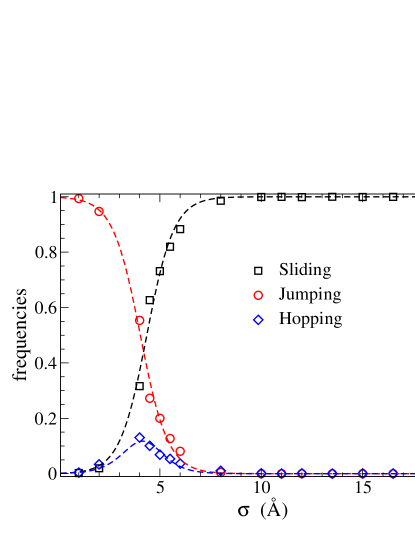
In order to understand the importance of the the different transport modes (sliding, hopping and jumping) of TFs while interacting with the DNA, we need first to evaluate their occurrence statistics. In Figure 2, we show the empirical transport-mode frequencies of occurrence measured in simulations. The various modes were identified and analyzed as discussed in Methods. We find that sliding and jumping frequencies follow a sigmoidal profile with a prevalence of 3D-diffusion at low and a dominance of sliding at high . Hopping events are rare for every value of except for a small hump around Å. This a likely consequence of the strongly confining features of the 12-10 LJ interactions. When the equilibrium distance between TF and DNA, , is too small complete dissociation with enduring jumps are the most probable events. Conversely, for large values the TF tends to linger bound to the DNA with sliding events lasting for about the entire duration of the simulation runs (Fig 3a). Hopping events are statistically significant only at the transition between the jumping dominated and sliding dominated regimes.

Sliding is the most relevant transport mode in determining the TF-DNA interaction, as only when in sliding the TF can actually probe the sequence of nucleotides of the DNA. We thus studied the average distance along the DNA axis, , explored by the TF during a single sliding event. Due to the random walk character of sliding, in the interval between the times of attachment and detachment the TF might have moved past the future point of detachment. Therefore, we also measured the maximal distance from the point of attachment reached by the TF within the time of detachment, . Both and , normalized by the base pair distance , are shown in Fig. 3b. These quantities provide a proxy of the number of basis probed between the point of association to the DNA and the subsequent point of detachment from it. As one can see when sliding is dominating the number of bases probed by the TF can be as large as . However, for values of larger than while sliding remains the prevailing mechanism of transport (Fig. 2 and 3a), the number of probed bases drops dramatically. This behavior will be rationalized later while investigating the behavior of the one-dimensional diffusion constant .
3.2 Geometry of sliding TF trajectories
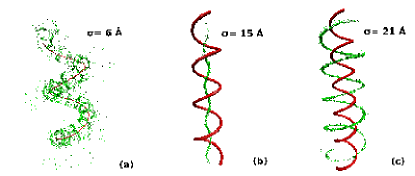
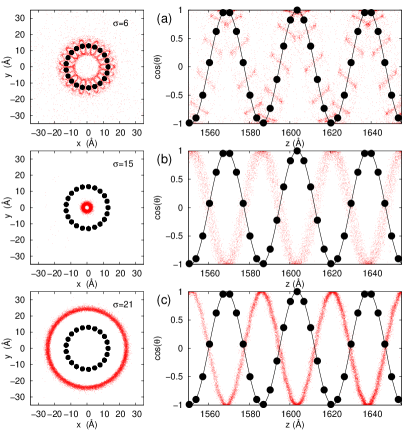
We now focus on the geometrical properties of TF trajectories during sliding. The basic phenomenological features are illustrated in Figs. 4 and 5, showing the positions of one of the attractive beads (i.e. bead-1 or bead-3) during sliding, for three representative values of . Figure 4 shows a three-dimensional view, whilst, Figure 5 displays two dimensional projections. Denoting with the Cartesian coordinates of the bead position, the left panels show the projection onto the -plane, transversal to the DNA axis, while the right ones the cosine of the angle of rotation around the DNA-axis as a function of the position along the DNA axis, i.e. .
For all values of we found that, during sliding, the TF traces the helical path of the DNA as clear from the 3D-plots (Fig. 4), so that diffusion along the DNA chains proceeds with a characteristic roto-translation as suggested by experimental studies [20, 32, 33, 34, 35], see also the review [19]. However, some differences are observed at varying , as discussed in the following.
For Å , the TF traces circular orbits orthogonal to the helix contour around each DNA bead so that the overall motion draws a super-helical trajectory (Fig. 4 and 5a-left). In this case the envelope path is in phase with the DNA helix, as demonstrated by the behavior of the points representing vs (Fig. 5a-right) which accumulate around the curve ( being the DNA-helix pitch). For smaller values of sliding becomes less frequent but always in phase with the DNA helix (not reported). For larger values of , the TF sliding beads tread an helix in antiphase with respect to the DNA helix (Figs. 4 and 5b-c (right)), meaning that the TF recognition domains reside in the DNA groove. As far as the distance from the DNA axis is concerned, for Å the TF bead moves both in and out the DNA helix (Fig. 5a-right), while it remains well inside and outside it for Å and Å , respectively (as shown in (Fig. 5b-c (left)). As we will show in the next section these observations will be key to understand the behavior of the one-dimensional diffusion coefficient .
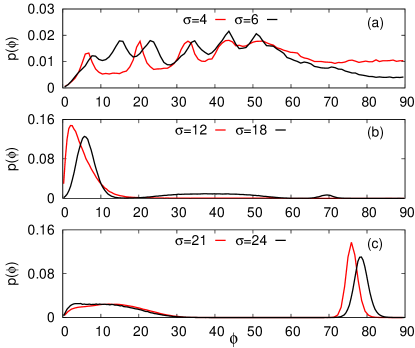
We complete the description of the geometrical aspects of TF sliding motion by discussing its orientation with respect to DNA. Given the TF triangular geometry, its orientation can be characterized in terms of the angle between the segment joining bead-1 and bead-3 and the DNA-axis. Since the dynamics is fully symmetric under the exchange of bead-1 and bead-3, we can restrict the angle in degrees. Measurements are made only when the TF is associated to DNA, i.e. in the sliding windows. Figure 6 shows that the orientation statistics depends on . For Å (Fig. 6a), sliding occurs very rarely and typically only one of the attractive bead is in contact with DNA, this can be appreciated from Figs. 4a and 5a-left where the spots out of the superhelical path corresponds to the instants in which the TF is in sliding but with one of the beads not attached to DNA. As a consequence, the probability density, , is rather broad with no preferential orientation. The peaks observed in the figure result from the loops TF makes around DNA beads. For intermediate values of (ÅÅ Fig. 6b), the TF describes an helical path at the interior of the DNA helix (central panel of Fig. 4 and Fig. 5b) and the takes on a well defined peak around meaning that the TF slides along DNA in parallel orientation, with bead-1 and -3 residing in two consecutive grooves of the DNA. As we shall discuss below this appears to be the fastest TF-DNA configuration in terms of diffusive properties. For Å (Fig. 6c) the peak around zero broadens and a new peak appears between and . These features signal that now the attractive beads, while performing an helical motion outside the DNA helix, flip between a parallel orientation with respect to the DNA axis and an almost orthogonal one, whereby the two beads straddle the helix.
3.3 One-dimensional diffusion coefficient
To characterize the TF sliding along the DNA, we estimated from the runs the one-dimensional diffusion coefficient from the linear behavior of the mean square displacement along the DNA-axis, see Eq. (9) in Methods.
The results reported in Fig. 7a show the dependence of on . The diffusion constant displays small values for both large and small , while exhibiting a bump for intermediate values. Figure 7b shows the average distance of the attractive beads (1 and 3) from the z-axis. A negative correlation between and is apparent indicating that high values of require a TF deeply embedded into the DNA groove as highlighted by the horizontal line that marks the DNA radius .
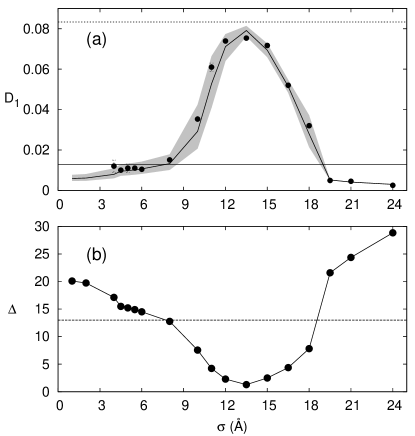
The observed behavior of the diffusion constant, can be rationalized by a simple phenomenological argument based on the geometrical properties of TF sliding motion that have been characterized in the previous section. Basically, during sliding, TF beads diffuse drawing an helical path (Fig 4) at distance from the DNA axis (Fig. 7b ). Such helical path has the same pitch of the DNA helix with, possibly, a phase shift (Fig 5b-c), which is inessential for the following derivation. This scenario occurs for large enough (Fig. 4b-c). For smaller the path drawn by the TF is slightly more complex (Fig. 4(a)), but on average still helical. Assuming an ideal helical motion, the displacement along the axis, , is linked to the arc-length of a curvilinear displacement, , along the helix by the formula
| (10) |
From Einstein equation for a three-atom molecule, like our TF, the mean square curvilinear displacement along the helical path is with , while along the -axis we have . Then, using Eq. (10) to convert displacements along the helix to displacements along the DNA axis yields
| (11) |
which relates the diffusion constant along the z-axis to the geometrical properties of the helical path followed by the TF. The shaded region in Fig. 7a is bracketed by the upper and lower bounds of obtained using Eq. (11) by replacing with , where is the standard deviation of the TF-distance from the z-axis. The region accurately brackets the simulation data supporting the reliability of the prediction (11). For instance, if the TF were diffusing on an helix with radius equal to that of the DNA it would correspond to a with the value marked by the solid line in Fig. 7a.
It is interesting to observe that Eq. (11) is consistent with the theoretical prediction of Bagchi et al. [17] based on the computation of the translational friction induced by the TF helical track along the DNA. To obtain the connection one should neglect the friction contribution of TF self-rotation predicted by Schurr [18] which is not relevant to our model.
The ability of Eq. (11) to quantitatively explain the behavior of simulated sliding diffusion constant suggests that, within our model, is mainly determined by the geometrical properties of sliding path. In other terms, the DNA-geometry conspires with the interaction potential to constrain the TF to diffuse along an helical path without being much influenced by possible potential barriers, indeed the derivation was based on the free diffusion coefficient . Essentially the effect of the interaction potential is embodied in the fact that in Fig. 7b results to be a non trivial function of . In principle, the interaction potential between TF and DNA depends on the nucleotide sequence, so that diffusion is modified by the presence of a rugged energy landscape [14, 6]. This effect typically depresses the diffusion, in particular it will affect the value of used in the argument above by decreasing it by a factor , being the standard deviation of the TF-DNA (now disordered) binding energy. However, experimental data suggest that this effect, when present, is very small with [14]. Of course, the model we introduced can be easily generalized to include sequence heterogeneity.
3.4 Search efficiency
Even in a scenario of non-specific TF-DNA interaction it is interesting to quantify the efficiency of sequence exploration during sliding. Following Ref. [16], we estimate the exploration efficiency in terms of “probed positions”, i.e. we measure the fraction of new sites, , visited by the sliding TF, see Methods.
.
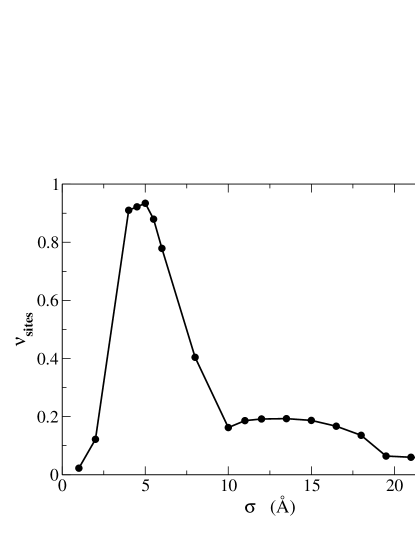
In Figure 8 we show the fraction as a function of . The exploration efficiency displays a well pronounced peak in the range Å Å. At a first sight, this result may look surprising as for such values of the diffusion constant is rather smaller than its maximum value attained at Å (Fig. 7). However, this behavior represents the essence of facilitated diffusion whereby slow sliding can be compensated by frequent jumping and hopping. Indeed, a direct comparison between Fig 8 and 2 reveals that the search efficiency peaks in the region where hopping is maximal and jumping/sliding events have comparable frequencies. In other terms, the possibility to realize an efficient search through the DNA chain to localize as quick as possible the DNA target sequence requires a suitable interplay of all transport modes. The result shown in Fig 8 is in qualitative agreement with those observed in Ref. [16].
4 DISCUSSION and CONCLUSIONS
In this work we performed Molecular Dynamics simulations of facilitated diffusion using a very simplified model. We represented DNA as a single helical chain of beads frozen in the standard conformation of B-DNA. To capture the main features of typical prokaryotic homodimeric Transcription Factors (TFs) that target palindromic DNA sequences [21], the TF was represented as three-bead triangular structure, where the first and last bead correspond to the binding regions whereas the central bead to the scaffold. Our model does not include electrostatics and the TF-DNA interactions are modeled through a Lennard-Jones potential of well depth and equilibrium distance . In our simulations, is kept constant while exploring a wide range of values.
Our simulations show that the DNA-TF equilibrium distance crucially affects the dynamics of the TF. For small the TF spends most of its time in 3D-diffusion. At intermediate values of a sharp transition occurs with a drop in the jumping frequency and an abrupt increase in the sliding frequency paralleled by the appearance of a hump in the hopping frequency and an increase of the diffusion constant. The shape of the trajectory traced by the TF is also very sensitive to . For intermediate the TF forms circular orbits orthogonal to the DNA contour creating a super-helical path. For larger the TF traces an helical trajectory in phase with the DNA groove. Both the attractive beads of the TF are accommodated at the bottom of the groove imparting a parallel orientation to the DNA axis. Finally, for even larger the coils of this helical path in antiphase with the DNA helix become wide enough to cause a drop in the diffusion constant. The behavior of the constant was explained by a simple geometric argument based on the projection of the mean square displacement of the TF trajectory onto the DNA axis. The expression that we derived is similar to the one introduced in Ref. [17] save for the self-rotation frictional contribution [18], that in our simulations is not relevant. We did not find any apparent dependence of on possible energetic barriers. However, the latter enter the expression of the diffusion constant in an implicit way by setting the average distance of the TF from DNA.
An interesting feature of our model is that, despite the crude approximations, it could reproduce a number of known phenomenological patterns. For instance, for intermediate values of , the TF always remains deeply buried into the groove of the DNA molecule with a parallel orientation with respect to DNA axis. This result is in agreement with a Circular Dichroism study by Johnson et al [36] showing that the TF interaction with unspecific DNA sequences is sufficient to induce the structuring of typical DNA-binding motifs, and is confirmed by recent NMR analyzes by Iwahara et al [37] revealing that protein HoxD9 interacts with non-specific binding sites using the same interface employed for the recognition of the specific target site. This result, also consistent with Givaty and Levy findings [16], might have far reaching biological implications [38] suggesting the existence of only a very low barrier separating the Search and Recognition states postulated in Ref. [5].
It is also interesting to notice that in our model the translational move of the TF during sliding is always coupled to rotation around the DNA axis induced by the helical path, which is either in phase with the DNA strand or with its groove. This result is consistent with single molecule fluorescence tracking assays performed by Blainey et al [20] for the calculation of of labeled human oxoguanine DNA glycosylase (hOgg1). This study was based on the observation that in the case of pure translation the coefficient depends on the TF radius like while in the case of roto-translation (with being the distance of the TF from the DNA axis, i.e. in our notation, see Fig. 7b) so that purely translational and roto-translational sliding can be discriminated. This work, along with other recent studies [32, 33, 34] extending the analysis of sliding to several other proteins, supports the suggestive idea that the coupling between rotation and translation might be a feature shared, at least, by a group of TFs.
As an overall conclusion, our model, despite its crude approximations, turns out to reproduce fairly well a number of experimental patterns. This represents an a posteriori validation of the two key elements of our scheme, namely the helical topology of the DNA molecule and a TF-DNA interaction potential with a well localized minimum and a short tail. This extensive model validation suggests its viability in investigating more complex aspects of facilitated diffusion such as the influence of molecular crowding and DNA flexibility.
References
References
- [1] B. Alberts, A. Johnson, J. Lewis, M. Raff, K. Roberts, and P. Walter. Molecular biology of the cell. Garland science, Taylor & Francis Group, New York, USA, 5th edition, 2007.
- [2] A.D. Riggs, S. Bourgeois, and M. Cohn. The lac repressor-operator interaction: Iii. kinetic studies. J. Mol. Biol., 53:401–417, 1970.
- [3] O.G. Berg, R.B. Winter, and von Hippel P.H. Diffusion-driven mechanisms of protein translocation on nucleic acids. 1. models and theory. Biochemistry, 20:6929–6948, 1981.
- [4] S. E. Halford and J. F. Marko. How do site-specific dna-binding proteins find their targets? Nucleic Acids Res., 32(10):3040–3052, 2004.
- [5] M. Slutsky and L.A. Mirny. Kinetics of protein-DNA interaction: facilitated target location in sequence-dependent potential. Biophys. J., 87:4021–4035, 2004.
- [6] M. Sheinman, O. Bénichou, Y. Kafri, and R. Voitouriez. Classes of fast and specific search mechanisms for proteins on DNA. Rep. Prog. Phys., 75:026601 (33pp), 2012.
- [7] D. Chu, N.R. Zabet, and J. Mitavskiy. Models of transcription factor binding: Sensitivity of activation functions to model assumptions. J. Theor. Biol., 257:419–429, 2009.
- [8] N.R. Zabet and B. Adryan. A comprehensive computational model of facilitated diffusion in prokaryotes. Bioinformatics, 28:1517–1524, 2012.
- [9] J. Elf, G.-W. Li, and X.S. Xie. Probing transcription factor dynamics at the single-molecule level in a living cell. Science, 316:1191–1194, 2007.
- [10] Y.M. Wang, R.H. Austin, and E.C. Cox. Single molecule measurements of repressor protein 1d diffusion on DNA. Phys. Rev. Lett., 97:048302, 2006.
- [11] A. Graneli, C.C. Yeykal, R.B. Robertson, and E.C. Greene. Long-distance lateral diffusion of human rad51 on double-stranded DNA. Proc. Natl. Acad. Sci. USA, 103:1221–1226, 2006.
- [12] O. Bénichou, C. Loverdo, and R. Voitouriez. How gene colocalization can be optimized by tuning the diffusion constant of transcription factors. Europhys. Lett., 84:38003, 2008.
- [13] C. Laughton and S.A. Harris. The atomistic simulation of DNA. Comput. Mol. Sci., 1:590–600, 2011.
- [14] L. Mirny, M. Slutsky, Z. Wunderlich, A. Tafvizi, J. Leith, and A. Kosmrlj. How a protein searches for its site on dna: the mechanism of facilitated diffusion. J. Phys. A: Math. and Theor., 42(43):434013, 2009.
- [15] C.A. Brackley, M.E. Cates, and D. Marenduzzo. Facilitated diffusion on mobile DNA: configurational traps and sequence heterogeneity. Phys. Rev. Lett., 109:168103, 2012.
- [16] O. Givaty and Y. Levy. Protein sliding along DNA: dynamics and structural characterization. J. Mol. Biol., 385:1087–1097, 2009.
- [17] B. Bagchi, P. C Blainey, and X S. Xie. Diffusion constant of a nonspecifically bound protein undergoing curvilinear motion along dna. J. Phys. Chem. B, 112(19):6282–6284, 2008.
- [18] J Michael Schurr. The one-dimensional diffusion coefficient of proteins absorbed on DNA: Hydrodynamic considerations. Biophys. Chem., 9(4):413–414, 1979.
- [19] Jason Gorman and Eric C Greene. Visualizing one-dimensional diffusion of proteins along DNA. Nature Struct. & Mol. Biol., 15(8):768–774, 2008.
- [20] P.C. Blainey, L. Guobin, S.C. Kou, W.F. Mangel, G.L. Verdine, B. Bagchi, and X.S. Xie. Nonspecifically bound proteins spin while diffusing along DNA. Nature Struc & Mol. Biol., 16:1224–1230, 2009.
- [21] C. Branden and J. Tooze. Introduction to protein structure. Garland Publishing, New York, USA, 2nd edition, 1999.
- [22] A. Hinchliffe. Molecular modelling for beginners. Wiley, Chichester, U.K., 2nd edition, 2008.
- [23] A. Cacciuto and E. Luijten. Self-avoiding flexible polymers under spherical confinement. Nano Lett., 6:901–905, 2006.
- [24] O. G Berg and C. Blomberg. Association kinetics with coupled diffusion. an extension to coiled-chain macromolecules applied to the lac repressor-operator system. Biophys. Chem., 7(1):33–39, 1977.
- [25] S. Melchionna. Design of quasi-symplectic propagators for langevin dynamics. J. Chem. Phys., 127:044108, 2007.
- [26] J. T. Padding and A. A. Louis. Hydrodynamic interactions and brownian forces in colloidal suspensions: Coarse-graining over time and length scales. Phys. Rev. E, 74:031402, Sep 2006.
- [27] D. M Gowers, G. G Wilson, and S. E. Halford. Measurement of the contributions of 1d and 3d pathways to the translocation of a protein along DNA. Proc. Natl. Acad. Sci. USA, 102(44):15883–15888, 2005.
- [28] H. Qian, M.P. Sheetz, and E.L. Elson. Single particle tracking. analysis of diffusion and flow in two-dimensional systems. Biophys. J., 60:910–921, 1991.
- [29] R B Winter, O G Berg, and P H Von Hippel. Diffusion-driven mechanisms of protein translocation on nucleic acids. 3. the escherichia coli lac repressor-operator interaction: kinetic measurements and conclusions. Biochemistry, 20(24):6961–6977, 1981.
- [30] R. B Winter, O. G Berg, and P. H Von Hippel. Diffusion-driven mechanisms of protein translocation on nucleic acids. 3. the escherichia coli lac repressor-operator interaction: kinetic measurements and conclusions. Biochemistry, 20(24):6961–6977, 1981.
- [31] J. Elf, G.-W. Li, and X S. Xie. Probing transcription factor dynamics at the single-molecule level in a living cell. Science, 316(5828):1191–1194, 2007.
- [32] S. Liu, E.A. Abbondanzieri, J.W. Rausch, S.F.J. Grice, and X. Zhuang. Slide into action: dynamic shuttling of HIV reverse transcriptase on nucleic acid substrates. Science, 322:1092–1097, 2008.
- [33] A.B. Kochaniak, S. Habuchi, J.J. Loparo, D.J. Chang, K.A. Cimprich, J.C. Walter, and A.M. van Oijen. Proliferating cell nuclear antigen uses two distinct modes to move along DNA. J. Biol. Chem., 284:17700–17710, 2009.
- [34] Y. Lin, T. Zhao, X. Jian, Z. Farooqui, X. Qu, C. He, A.R. Dinner, and N.F. Scherer. Using the bias from flow to elucidate single DNA repair protein sliding and interactions with DNA. Biophys. J., 96:1911–1917, 2009.
- [35] A. Tafvizi, F. Huang, J.S. Leith, A.R. Fersht, L.A. Mirny, and A.M. van Oijen. Tumor suppressor p53 slides on DNA with low friction and high stability. Biophys. J., 95:L01–L03, 2008.
- [36] N.P. Johnson, J. Lindstrom, W.A. Baase, and P.H. vpn Hippel. Double-stranded DNA templates can induce alpha-helical conformation in peptides containing lysine and alanine. functional implications for leucine-zipper and helix-loop-helix transcription factors. Proc. Natl. Acad. Sci. USA, 91:4840–4844, 1994.
- [37] J. Iwahara and G.M. Clore. Detecting transient intermediates in macromolecular binding by para-magnetic NMR. Nature, 440:1227–1230, 2006.
- [38] A. Marcovitz and Y. Levy. Frustration in protein-DNA binding influences conformational switching and target search kinetics. Proc. Natl. Acad. Sci. USA, 108:17957–17962, 2011.
Appendix A
Since detailed models of TF-DNA interaction normally include electrostatics through a Debye-Hückel potential (DH), in this Appendix we will show that the Lennard-Jones potential (LJ) is flexible enough to account for relevant aspects of screened electrostatic interactions. As customary, in order to include the excluded volume effect and automatically remove possible singularities, the original DH potential is complemented with a short-range repulsive (see eg. [16])
| (12) |
where is the inverse of the screening length. To achieve a mapping with LJ potential, and are parameters to be adjusted such that presents the same position and depth of LJ minimum. It is convenient to rescale the distance so that the minimum of potential lies at . The parameters and are obtained by solving the system
| (13) | |||
| (14) |
Simple algebraic manipulations yield and so that the interaction potential reads
| (15) |
Since is known to be proportional to the inverse of the square root of the salt concentration , it follows that .
This simple argument shows that given a potential, it is always possible to determine an approximating (equivalent) LJ potential characterized by a minimum with the same position and depth. A useful by-product of the employment of LJ consists in the possibility to readily locate the putative equilibrium position.