International Transmission of Shocks and Fragility of a Bank Network
Abstract
The weighted and directed network of countries based on the number of overseas banks is analyzed in terms of its fragility to the banking crisis of one country. We use two different models to describe transmission of shocks, one local and the other global. Depending on the original source of the crisis, the overall size of crisis impacts is found to differ country by country. For the two-step local spreading model, it is revealed that the scale of the first impact is determined by the out-strength, the total number of overseas branches of the country at the origin of the crisis, while the second impact becomes more serious if the in-strength at the origin is increased. For the global spreading model, some countries named “triggers” are found to play important roles in shock transmission, and the importance of the feed-forward-loop mechanism is pointed out. We also discuss practical policy implications of the present work.
I Background
The increasing globalization provides important advantages in terms of risk sharing and risk diversification in banking and financial markets, but it also facilitates the risk spreading among different nations Helbing (2013). The recent financial crisis or shock, originated from United States (US) and spread to other countries, has witnessed that many overseas banks cut back their loans to the local markets and withdrew their representations. The withdrawals cause the liquidity shortage of the host countries which then lead to subsequent withdrawals of the host countries’ overseas branches in the crisis attacked countries. This process can continue and the shocks in this situation are hence defined as sequential shocks in this study.
There are abundant literature on transmission mechanism of shocks in global banking: Peek and Rosengren (1997) examines how Japanese asset bubbles have been transmitted to US via lending responses of Japanese overseas banks in US in the 80’s; Schnabl (2011) explores the mechanism of 1998 Russian debt default as a negative liquidity shock to international banking and its impacts on the banking of Peru; Popov and Udell studies the effect of financial distress in foreign parent banks on the local SME (small and medium enterprises) financing in 14 central and eastern European countries during the early stage of the 2007 financial crisis.
Within the framework of complex network theory, this paper introduces models for shock transmission and examines the different impacts of the sequential shocks on the global banking network. We find that the damage of the shocks is closely related to the directionality of the edges and the network topology plays an important role.
II Literature Review on Complex Network Methodology
The research using complex system approach in banking has also experienced three stages of the development. In the earlier stage, Allen and Gale (2000) claims that the possibility of contagion effect depends on the structure of interbank linkages. They believe that a “complete structure of linkages” will share the risk more easily than “an incomplete structure”, hence the risk sharing effect. Freixas et al. (2000); *upper further considers a structure of uni- and multi-money center banking systems, where the banks on the periphery are linked to the bank at the center but not to each other. Multi-tiered banking system has then been examined with the similar approach. These researches have shown that scholars have started to notice the banking structure has impacts on contagion even though the models are simple and has not yet formally introduced the complex system theory. The second stage is symbolized by a conference entitled “New Directions for Understanding Systemic Risk”, which brought together experts from various disciplines to explore parallels between systemic risk in finance and systemic risk in engineering, ecology, and other fields of sciences Kambhu et al. (2006). After that a series of interdisciplinary researches using various modeling and theory have emerged Soramäki et al. (2007); *beyeler; *iori. The 2007 US financial crisis becomes another driving force of this line of the research. At this stage researchers have started to apply complex system theory to disclose topology and features of different financial markets such as international trade network, investment network, interbank clearing network May et al. (2008); *bech; *gai; *towe; *feng; *garas.
There are three issues in the current literature that need to be addressed and can be improved: first, the current research has focused on the disclosure of topology of the financial network, the study on dynamics and the interaction between the dynamics and topology are limited; second, the application of knowledge from both economics and complex system is rather mechanic; third, the empirical research has mainly emphasized on two markets, interbank and payment systems, where data are relatively easy to obtain. Other markets, such as a global banking network, have been hardly researched, hence the focus of this research.
In this paper, “fragility” is defined as the reduction of the number of banks as a result of exogenous shocks of different sequence and different sizes. The initial shock will generate rounds of sequential shocks at later stages to propagate throughout the entire network. The initial shock starts from the shock targeted country, such as US in 2007; it then spreads to the hosting countries where US has its overseas banks; resulting in more reduction of banks. A financial crisis in this paper hence is a breakdown of the network’s bank linkages, a collapse of all or part of the network structure.
III Global Bank Network
III.1 The Database
The data used in this research is from Bankscope which has information on over 30,000 public and private banks throughout the world from 2009 to 2011. Each bank report contains detailed consolidated and unconsolidated balance sheet and income statement. Data comes from Fitch Ratings and six other sources. It also provides company and country risk ratings and reports, ownership, and security and price information. This database is produced by Bureau van Dijk.
The information in the database that can be used for network construction are the number of branches and subsidiaries that each parent bank has established overseas. Subsidiaries are banks that are completely or partly owned and wholly controlled by parent banks that owns more than half of the subsidiary’s stock. For the purpose of this research subsidiary banks and branch banks are equally treated as overseas banks. The information on the overseas location of the two types of banks can be found in “ownership” category of the database.
III.2 The Topology of the Global Banking Network
By using gathered information, we construct the directed and weighted network of countries, in which the directed arc from the country to country is assigned the weight that is the number of banks puts in . We in the present work focus on international banks and thus domestic branches of banks are disregarded, i.e., . The number of arcs that has nonzero weights amounts to (and thus the average out- and in-degree 5.80), which indicates that the network is very sparse since the total number of possible arcs is , much larger than .
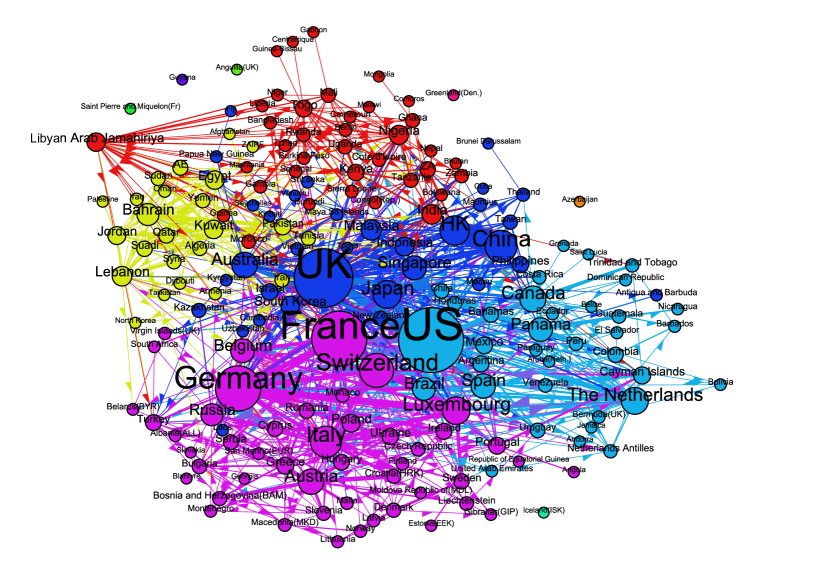
The network in Fig. 1 is drawn by using the software Gephi. Although sparse, the network is well connected: the giant component size is comparable to the system size and there are 6 isolated very small islands. The top five countries in terms of vertex strengths in global network are United Kingdom (UK), US, France, Germany and Switzerland in this order. The top five countries in terms of vertex strengths in Asia are Japan, China, Hong Kong (HK), Singapore, and South Korea in this order. In terms of in-degree the top five countries are UK, US, Russia, Switzerland, France. It is interesting to note that Panama island is ranked the six as one of the famous offshore banks. The top five countries in Asia in terms of in-degree, are Singapore, HK, China, Japan and South Korea. In terms of out-degree the top five countries are UK, US, France, Germany and the Netherlands, and in Asia they are Japan, China, South Korea, HK and Singapore. As historical Asian international financial center, Singapore, Japan and HK are still playing important roles, and China is gaining its momentum.
In general, the network shows that in-degree of a country is different from its out-degree. It implies that the export of banking services of a nation is not equal to the imports of banking service of the country. Hence service trade imbalances are observed in the global banking network. We identify ten clusters by using Gephi which uses the community detection method in Blondel et al. (2008) and display them in different colors in Fig. 1. It needs to be mentioned that even in this era of global finances, we still observe the strong dependence on geographic locations of countries. In Fig. 1, the different communities have different colors and it is clearly seen that each community is closely linked to each continent. Interestingly, our finding is in contrast to the argument in the literature that geographic distances do not play important roles with the development of electronic banking Krizek et al. (2005).
| Rank | first impact | second impact | out-degree | in-degree | out-strength | in-strength |
|---|---|---|---|---|---|---|
| 1 | United States (US) | US | US | UK | US | US |
| 2 | France (FR) | UK | UK | US | FR | UK |
| 3 | United Kingdom (UK) | Hong Kong (HK) | FR | RU | UK | HK |
| 4 | Germany (DE) | Luxembourg (LU) | DE | CH | DE | LU |
| 5 | Italy(IT) | FR | NL | FR | IT | FR |
| 6 | Japan (JP) | DE | IT | Panama island (PA) | JP | DE |
| 7 | The Netherlands (NL) | CH | JP | DE | CN | RU |
| 8 | China (CN) | Russia (RU) | CA | LU | NL | CH |
| 9 | Switzerland (CH) | Brazil (BR) | CH | Australia (AT) | CH | BR |
| 10 | Canada (CA) | Singapore (SG) | Libya | SG | AT | SG |
IV Local Spreading Model
IV.1 Model Description: Local Spreading
In the present study, we propose two different models for the spread of shocks. In the first model for the local spreading, we focus on the initial spread of crisis by considering the shock transmission procedure upto two steps:
-
•
As the original source of the banking crisis, the country is picked sequentially one by one.
-
•
Step I (the first wave): Due to the country ’s domestic banking crisis, is forced to reduce its banks abroad by the fraction . The bigger is , the more serious is the original crisis.
-
•
Step II (the second wave): Each country () where has its banks (i.e., ) realizes this change of number of banks within country, and thus tries to pull back its banks in to reduce the future risk. We assume that the country tries to sell the assets it has in very quickly, and thus there is an inevitable reduction of total values. We take into account this reduction by introducing another parameter so that closes down all the banks in and then moves the fraction of banks to other country . The larger is , the more loss the country has in . For the choice of , we choose the country in which has the most banks (except for ). If there are more than two countries with the maximum number of banks, we choose the one at random.
For the directed and weighted networks, one can define the out-strength and the in-strength of each vertex as follows:
| (1) | |||||
| (2) |
which simply correspond to the total number of overseas banks built, and the total number of foreign banks in , respectively. We also note that the total number of foreign banks in the world satisfies .
Within the local spreading model in this Section, the size of global crisis caused by the country is measured by the change of numbers of banks in the whole world, after each step (I and II). We denote as the total number of foreign banks before any crisis, and [] is the total number of foreign banks after the first (the second) wave in Step I (II) caused by the original crisis in . The seriousness of the first and the second waves is measured by the quantity we call “impact” defined by the change of number of banks in the world:
| (3) | |||
| (4) |
IV.2 Impact Sizes: Local Spreading
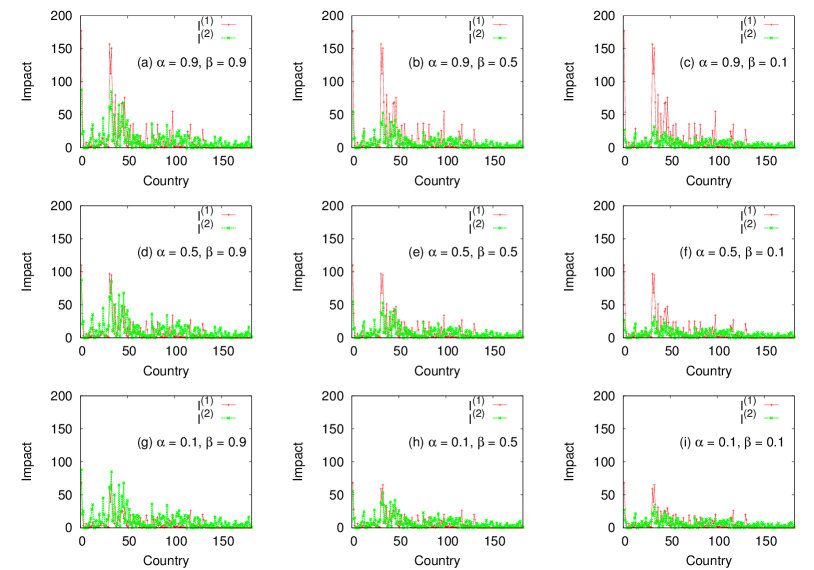
Figure 2 displays the first impact and the second impact caused by each country. It is clearly seen that the sizes of impacts are very different from country to country and that as the first and the second waves become more serious ( and become larger) the impact sizes also increase. We also list the ten countries that have the highest values in and in Table 1 for . The top countries which cause the biggest first impacts are somehow different from those countries with the biggest second impacts. Specifically, HK, Luxemberg, and Singapore are well known financial centers although they do not have the biggest economy like US. The list in Table 1 implies that the countries with the big first impact and the countries with the big second impact can have very different characteristics. In order to elaborate this, we compare local node properties (in- and out-degrees and strengths) with the impact sizes in Fig. 2. We observe clear positive correlation between the strengths and the impacts and conclude that the first impact is mostly determined by the out-strength, while the second impact by the in-strength. As a matter of fact, the observed strong correlations between the strengths and the impacts are not surprising at all, in view of our local spreading model of banking crisis in Sec. IV.1: The first wave (Step I) only deals with the overseas bank of and thus the reduction of the number of banks are mostly determined by the . On the other hand, the second wave (Step II) is heavily influenced by how many foreign banks exist in and thus it should be closely related with . In detail, the dependence of on can be understood as follows: The number of banks after the first wave is written as , where is the value after Step I. Since the crisis occurred at , we get
| (5) | |||||
where is the floor of , i.e., the largest integer not greater than . We then obtain
| (6) |
We note that as , as also confirmed in our simulations. When is small but nonzero, one can also understand since . The similar reasoning can also be applied for Step II to understand for large and for small . For intermediate values of and , the detailed numbers of banks must be taken into account to understand what happens in the bank network for Step I and II.
In Table 1, we also list the 10 countries which rank the highest in terms of out-degree, in-degree, out-strength, and in-strength. Although the top 10 list for the first impact and the out-strength (and for the second impact and the in-strength) look almost identical, there still exist small differences.
IV.3 Emergence of a New Superpower: Local Spreading
One can define the superpower in our network in different ways. In terms of the out-degree, the out- and the in-strengths, US is the superpower as can be seen in Table 1. On the other hand, in terms of the in-degree, UK has the highest power. London has been playing the financial center of the world for a long time, but our data indicate that UK is the superpower only in terms of the number of countries that had branches in UK. In terms of the number of banks that are located within a country, US is the most important country. We next study what will happen if one country becomes the source of crisis and thus collapses. From the simulation of our model, it is found that if the origin of the crisis is US, UK becomes the financial center in terms of the in-degree and the in-strength. On the other hand, if the crisis first occurs in France, not US, but UK becomes the superpower in terms of in-strength. In all other cases, US keeps its position as superpower.
V Global Spreading Model
V.1 Model Description: Global Spreading
Our local spreading model in Sec. IV is not really able to capture the iterative nature of shock transmission across the global bank network. In the present Section, we introduce a global spreading model of shocks, in which the banking crisis originating from the source country spreads to other countries as follows:
-
•
A country is picked sequentially as the origin of the banking crisis. The country undergoes banking crisis and thus reduces the number of banks by the fraction in neighbor countries (initiation of crisis). This step is identical to our local spreading model in Sec. IV.1.
-
•
The country from which reduced banks in above step calculates the loss of incoming banks between the initial and the current states. If the fraction is larger than () the country realizes that crisis is coming and also withdraws its banks abroad by the fraction in the same way as the country did in the above initiation step. and are the two parameters in the present model of global spreading of shocks; the former controls how severe the crisis is and the latter works as a threshold for the detection of the crisis. For simplicity the same values of and are assigned for all countries, respectively.
-
•
The above step of reduction of banks is performed iteratively and thus banking crisis propagates across the global banking network. The process stops when no more withdrawals of banks occur. This iterative nature makes the present global spreading model different from the local spreading model in Sec. IV. If is set to unity, the crisis stops propagating beyond ’s neighbor countries, and the outcome becomes identical to the Step I in Sec. IV. As is decreased from unity, countries become more fragile against baking crisis. The impact of the source country on the global outcome of banking crisis is measured similarly to Sec. IV, and we denote it as with the superscript meaning global spreading:
(7) where is the total number of banks before crisis and is the number of surviving banks in the world after the global transmission of the shock originating from stops.
V.2 Impact Sizes: Global Spreading
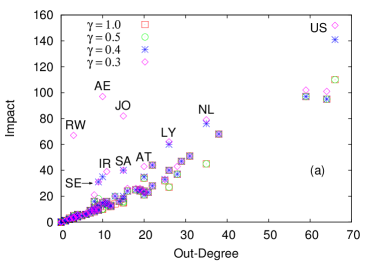
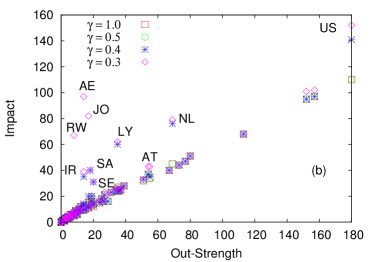
We simulate the spread of crisis varying from to for . As becomes smaller than 0.3, all countries become fragile unanimously without showing significant differences. We also note that for , the impact values do not strongly depend on any longer. Figure 3 shows the impact in Eq. (7) caused by the crisis originating from the country with respect to (a) the out-degree and (b) the out-strength of at . We observe that impacts are strongly correlated with the out-degrees and the out-strengths. Although the general increasing tendency of impact seen in Fig. 3 is an expected behavior (see discussion in Sec. IV.2), the deviation from the simple linear relation observed for some countries for demands a better understanding. In order to elucidate the origin of these outliers, we compute the difference in impact values between and :
| (8) |
which measures additional network effect on top of the first step of direct crisis spreading only to neighbor countries. [Note that has the same value as in Sec. IV.1.] Consequently, the outliers in Fig. 3 are those countries with large values of . The top 10 countries with the highest are listed in Table 2, where we also include the total number of endangered countries in which the loss fraction has exceeded during the crisis propagation. When the crisis is initiated from a country with , the crisis does not propagate beyond the country’s direct neighbors and become localized. We believe that our measure can properly capture how big a systemic risk the country can cause in the global bank network.
When the crisis starts from , reduces the banks from its direct neighbors (’s) by the fraction , and thus the number of banks loses is written as , where is the ceiling function returning the smallest integer not less than . When the loss fraction is larger than , the country also reduces its banks from other countries. Since , the above condition that also reduces its banks from other countries is written as
| (9) |
for . From Eq. (9), is expected to be vulnerable to the crisis originating from , if has incoming banks only from a few neighbors. It is to be emphasized that the condition (9) is only a proxy since it does not reflect the crisis propagating from countries other than from the origin. In actual computer simulation of our global spreading model, crisis can spread beyond direct neighbors of the crisis origin.
| Name | ||
|---|---|---|
| United Arab Emirates (AE) | 87 | 17 |
| Jordan (JO) | 66 | 18 |
| Rwanda (RW) | 62 | 18 |
| United States (US) | 42 | 12 |
| Libya (LY) | 35 | 15 |
| The Netherlands (NL) | 34 | 8 |
| Iran (IR) | 26 | 6 |
| Saudi (SA) | 25 | 2 |
| Sweden (SE) | 13 | 6 |
| Austria (AT) | 9 | 4 |
| Name | vulnerability | influence | |
|---|---|---|---|
| Togo | 1.0 | 27 | 10 |
| Hong Kong | 0.54 | 19 | 28 |
| Kuwait | 0.5 | 36 | 85 |
| Greece | 0.5 | 26 | 27 |
| Sweden | 0.5 | 20 | 11 |
| South Africa | 0.5 | 19 | 8 |
| Colombia | 0.43 | 15 | 14 |
| Japan | 0.375 | 77 | 223 |
| Libya | 0.34 | 35 | 64 |
| India | 0.34 | 31 | 57 |
| Portugal | 0.3 | 20 | 14 |
What is the origin of the outlying behavior (the big impact difference in Fig. 3)? In order to answer this, we introduce the concept of “the trigger country” as follows: When the crisis from a source country reaches a trigger country , the country plays the role of the trigger that although does not directly contribute in the impact difference of the source country , does so indirectly by relaying the crisis to other countries, eventually bringing many other countries into crisis. Our definition of the trigger country leads to the two conditions the trigger country must satisfy: First, it is vulnerable to the crisis of its incoming neighbors (vulnerability). Second, it can affect other countries so that its outgoing neighbors can also be in crisis (influence). The vulnerability of the country can effectively be measured by , which is proportional to the risk that is driven to crisis by one of its incoming neighbors . The influence, the second ingredient to be a trigger, can be measured by ’s outgoing strength . We expect that these two local properties to gauge vulnerability and influence can capture the possibility that a country can be a trigger, although it is based on the assumption that most contribution to comes from ’s nearest and next-nearest neighbors. In Table 3, the most vulnerable countries of which their values of influence rank within top 20% are listed. See Saudi in Table 2 for example. Saudi ranks high by provoking the trigger country Kuwait (Kuwait is the only one out-going neighbor of Saudi that has become endangered). Kuwait in Table 3 has higher values in both vulnerability and influence, which leads us to conclude that our two measures, vulnerability and influence, can effectively capture the possibility for a country to become a trigger country. For the spread of crisis originating from United Arab Emirates, Jordan, and Rwanda, it is found that Libya and Togo play the role of the trigger countries, whereas Sweden plays a role of the trigger for US and the Netherlands (see Table 3).
To summarize, the outliers in Fig. 3 and Table 2 are either countries which have triggers as their directly connected neighbors (like United Arab Emirates, Jordan, and Rwanda all with the trigger country Togo as their neighbors), or trigger countries themselves (like Libya). We also emphasize that a trigger country may not be an outlier in Fig. 3 and Table 2: The influence in Table 3 is defined as the outgoing strength, and consequently takes into account only the first wave impact. In contrast, outliers are defined in such a way that only the impact beyond the first wave is measured [see Eq. (8)]. Outliers are those countries which exhibit big network effect beyond the direct connections, and we believe triggers are conceptually useful to understand why some countries become outliers.
We also observe that even when a country does not satisfy the condition (9) and thus survives the first step of shock transmission from the origin country, it might fall into crisis in the next step by the crisis propagating from other country. Suppose that a country which has banks of the country () opens branch banks in another neighbor country (), in which also has branch banks (). In this situation, it is possible that the crisis from the country affects both through the direct path and the indirect path via the country , which is a typical example of the so-called “feed-forward loop” with as the root. If crisis from a source country and a trigger country arrive at the target country through the feed-forward loop, the target country is more likely to fall into crisis. We measure the number of the feed-forward loops and also include them in Table 3.
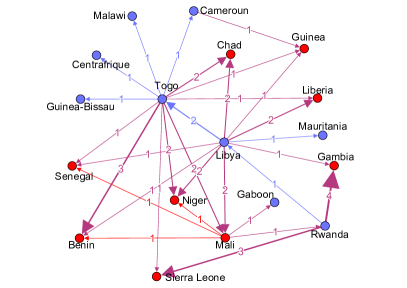
To illustrate the process of spreading crisis through feed-forward loops, we plot the subnetwork of spreading crisis which starts from Rwanda in Fig. 4 for and . Among the nearest neighbors of Rwanda, the only country which satisfies Eq. (9) to become endangered is Libya. Not only Libya contributes much for the increase of the impact value of Rwanda due to its large value of influence (see Table 3), it also plays an important role by composing feed-forward loops: Rwanda and Libya compose feed-forward loops together with Gambia and Mali. Although the crisis from Rwanda affects Gambia and Mali in the first step, these two survive because the condition (9) is not fulfilled. However, in the second step of shock transmission when Libya affects these two, they eventually collapse into crisis from the feed-forward loop mechanism. Eventually, all nine countries, Gambia, Liberia, Guinea, Chad, Senegal, Niger, Mali, Benin, and Sierra Leone become affected by the crisis originating from Rwanda through the the feed-forward loops with Libya and Togo playing important roles (see Fig. 4). We find that all eight countries except Saudi and Austria in Table 2 become the victim of the crisis spread by the feed-forward-loop mechanism.
Feed-forward loops can significantly increase the impact of crisis beyond the simple sum of the impact of local crisis from the trigger and the the source countries. Without any feed-forward loops, it is easily seen that Libya must have , instead of the actual value . From this, we conclude that the big impact difference in global spreading comes from combination of two factors: large out-strength and feed-forward loops. Especially, the effect of feed-forward loop from the trigger country increases the number of endangered countries significantly. Consequently, we conclude that the existence of trigger countries with feed-forward loops needs to be taken into account for forecasting the pattern of crisis spreading across the whole bank network. We note that the number of feed-forward loops is not the only indicator for the big scale of crisis spread. For example, although Japan has 233 feed-forward loops, many of its neighbors are not vulnerable and thus they work as cushion not as trigger for the crisis spread.
VI Policy Implications
First, from the data, this research shows that for most of countries in the world, their banking service accounts are not balanced. Some have larger in-strength than out-strength, such as UK. These countries have bank service trade deficit because they import more than export. On the contrary, other countries have bank service surplus as they have larger out-strength than in-strength. Whether a country has bank service surplus or deficit is a result of their trade policy implemented. If countries decide to implement an export-promote-trade policy, such as Japan in 70s and 80s, they will end up with bank service trade surplus, otherwise it is going to be deficit. This research shows that the sequential shocks have different impacts on these two types of countries. Export-oriented countries need to prepare more “capital cushion” as they are going to be exposed to the initial shock; however the import-oriented countries also need to prepare enough capital for the second round of the shock.
Second, as lender of last resorts, governments are expected to step in and provide safety nets for the crisis attacked banking system. The size of the financial aid however is, in general, not easy to determine. This research indicates that the variation of the shock sizes determine the different impacts on the banking system measured by the reduction number of the banks. The magnitude of the reduction can provide certain information on the seriousness of the effect, hence certain implication for the size of the bailout packages.
Third, our results for the global spreading model suggest that in order to prevent systemic risk from spreading identification of countries with a big network effect is important. We also believe that our concept of the trigger countries can be important for international intervention to stop crisis spreading: The trigger countries can trigger a big scale of risk spreading, but if they are provided some international financial support in early stage of risk propagation, they can also work as a bottle neck for spreading, enhancing the stability of the whole international baking network.
Acknowledgment
X. F. was supported by Leading Academic Discipline Project of Shanghai Municipal Education Commission J51206; National Education Commission Project Number 11YJA790030. Shanghai Social Science Fund Project Number 2011BJB015, Shanghai Municipal Education Commission Innovation Project,Project Number 12ZS166, and National Post Doctor Fund 2011M5000786. B. J. K. acknowledges the support from the National Research Foundation of Korea (NRF) grant funded by the Korea government (MEST) (Grant No. 2011-0015731), and the support from the Asia Pacific Center for Theoretical Physics. Feedbacks from the 5th Shanghai International Symposium on Nonlinear Sciences and Applications 2012 are appreciated. X. F. would like to thank Xiaoyan Huang, Jingjie Gu for research assistance.
References
- Helbing (2013) D. Helbing, Nature 497, 51 (2013).
- Peek and Rosengren (1997) J. Peek and E. Rosengren, Amer. Econ. Rev. 87, 495 (1997).
- Schnabl (2011) P. Schnabl, Working paper, Stern School of Business, New York University (2011).
- (4) A. Popov and G. Udell, Working paper, European Central Bank .
- Blondel et al. (2008) V. Blondel, J.-L. Guillaume, R. Lambiotte, and E. Lefebvre, J. Stat. Mech. , P10008 (2008).
- Allen and Gale (2000) F. Allen and D. Gale, Polit. Econ. 108, 1 (2000).
- Freixas et al. (2000) X. Freixas, B. Parigi, J. Rochet, F. Allen, and D. Gale, J. Money, Credit and Banking 32, 611 (2000).
- Upper and Worms (2002) C. Upper and A. Worms, Euro. Econ. Rev. 48, 827 (2002).
- Kambhu et al. (2006) J. Kambhu, S. Weidman, and N. Krishnan, New directions for understanding systemic risk: a report on a conference cosponsored by the Federal Reserve Bank of New York and the National Academy of Sciences (The National Academies Press, Washington, D.C., 2006).
- Soramäki et al. (2007) M. Soramäki, K. Bech, J. Arnold, R. Glass, and W. Beyeler, Physica A 379, 317 (2007).
- Beyeler et al. (2007) W. Beyeler, R. Glass, M. Bech, and K. Soramäki, Physica A 379, 317 (2007).
- Iori et al. (2008) G. Iori, G. Masi, O. Precup, G. Gabbi, and G. Caldarelli, J. of Econ. Dynamics & Control 32, 259 (2008).
- May et al. (2008) R. May, S. Levin, and G. Sugihara, Nature 451, 89 (2008).
- Bech et al. (2010) M. Bech, J. Chapman, and R. Garratt, J. of Monetary Econ. 57, 352 (2010).
- Gai and Kapadiay (2010) P. Gai and S. Kapadiay, Working paper, Bank of England 383 (2010).
- Towe and Canetti (2010) C. Towe and E. Canetti, eds., Proceedings of Conference on Operationalizing Systemic Risk Monitoring (International Monetary Fund, Washington, D.C., 2010).
- Feng et al. (2010) X. B. Feng, H. B. Hu, and X. F. Wang, Physica A 389, 5785 (2010).
- Garas et al. (2010) A. Garas, P. Argyyrakis, C. Rozenblat, M. Tomassini, and S. Havlin, New J. Phys. 12, 113043 (2010).
- Krizek et al. (2005) K. J. Krizek, Y. Li, and S. L. Handy, Transportation Research Record: Journal of the Transportation Research Board 1926, 252 (2005).