Spin-dependent Seebeck effect and huge growth of thermoelectric parameters at band edges in H- and F-doped graphene, free-standing and deposited on -SiC(0001) C-face
Abstract
Graphene halfly doped with H or F possesses local magnetization at the undoped C sites. Thus the Seebeck coefficient is different for each spin channel and its sign also changes depending on the spin polarization. Deposition of doped graphene on the C-face -SiC(0001) with two buffer layers substantially varies the electronic and thermoelectric properties. These properties are efficiently calculated from the semiclassical Boltzmann equations, using the maximally-localized Wannier-functions interpolation of the band structures obtained with the density-functional theory. Our results indicate large growth of the thermopower and the ZT efficiency at the band edges. We show in the model discussion that this phenomenon is more general and applies also to other systems than graphene. It gives prospect for developing new spintronic devices working in the band-edge regime.
I Introduction
The direct conversion of heat into electrical energy is an intensively studied field for last half century. The crucial issue in this research is finding new materials with specific thermal and electric properties. The semiconductor materials development extends applications concerning thermoelectric effects like Seebeck and Peltier, which are the basic phenomena among other non-equilibrium thermoelectric effects. Seebeck effect is the electric voltage generation in a conductor under a temperature gradient, and it is used in the heat sink applications. With the inverse effect, namely Peltier, an active cooling can be received. Recent studies on spintronics and spin-caloritronics spincalo revealed a spin analogue of the Seebeck effect, which can occur in magnets, also insulating spinS1 ; spinS2 . Spin-Seebeck effect can be longitudinal e.g. caused by magnon-induced spin current injected from a ferromagnet long1 ; long2 , or transverse e.g. from the substrate transv1 ; transv2 . Spin-dependent Peltier effect has been also observed spinP .
The dimensionless figure of merit gives a measure of the system efficiency in the thermoelectric effects. The Seebeck coefficient () describes the electric voltage generation under the temperature gradient stimulus through the sample with no electrical current. It is an intrinsic parameter of each material and depends on temperature (). Higher electrical conductivity (), lower thermal conductivity (), and higher Seebeck coefficient are necessary for better and more effective thermoelectric materials. Finding new materials with higher ZT factor is difficult, because the thermal conductivity is strongly positively related with the electrical conductivity, due to the fact that both are depended on crystal and electronic structures and carrier concentration. These physical properties stay in conflict to each other. The ZT factor easily allows to compare the performance of thermoelectric devices based on particular materials. For the thermoelectric devices which could be competitive with the mechanical devices (power generation or cooling), the ZT should be about 3. The value of ZT equal to 1 was reached in 1990s, the value of 2 is now technically available but at high temperatures only ZT1 ; ZT2 .
About two-thirds of all energy used worldwide is dissipated as heat and the demand for an alternative technology to reduce fossil fuels use, along with their environmental impact, leads to important regiments of research fields including that of direct thermal-electrical energy conversion via thermoelectricity. Seebeck and Peltier effects applied within proper materials can solve part of the problems faced ahead sustainable growth. As the semiconductor materials are promising for waste-heat recovery, the graphene has been also studied graf . Gas flow sensor with the use of Seebeck effect and its correlation with Bernoulli law was presented for single layer graphene single and multilayer graphene multi . These results demonstrate that graphene has great potential for flow sensors and energy conversion devices. For the graphene nanoribbons, the thermoelectric power including the Nernst and Seebeck effects were studied as well, using the nonequilibrium Green’s function approach Green and by molecular dynamics methods anomal ; armchair . The calculations of graphene behavior in the magnetic field and the related anomalous thermoelectric effects were reported in magn . Semiclassical approach for the electronic-density dependence of the dc-conductivity, the optical conductivity, the thermal conductivity, the thermopower, and the classical Hall effect in graphene has been proposed in semiclass . The first-principles band-structure calculations were also performed for the spin-caloritronics in the zigzag graphene nanoribbons zigzag . Nanocarbon related systems were investigated as thermoelectric-parameter enhanced materials COOH .
The effect of the carbon defect in the graphene structure - hydrogen doping and/or carbon vacancy - on magnetism has been proposed in defect . Recent theoretical studies of halfly doped graphene with hydrogen and also fluorine concluded that the magnetism in this system, as it is usual for the triangular lattice, is probably frustrated and the ferromagnetic state has a bit higher energy Rudenko . Nevertheless, the local magnetic domains usually form in such systems. It will be interesting to investigate the magnetic states in H- and F-adsorbed graphene at various doping patterns, e.g. rectangular or linear or random. Recently, the dynamics of H formation on the bilayer graphene and the mechanism of the long-range ferromagnetism in various graphene multilayered structures have been studied theoretically palacios1 ; palacios2 . Spin-polarization in graphene can be also obtained by random substitutional doping with B or N, but only sites belonging to one sublattice spin-BN .
In this work, we focus on the ferromagnetic state of halfly doped graphene, free-standing and deposited on the C-face -SiC(0001) substrate with two buffer layers. We calculated the thermoelectric properties by means of the first-priciples methods, and found that the Seebeck effect is spin dependent in both the H- and F-doped systems. We call the effect described here as the spin-dependent Seebeck effect. Our effect is purely intrinsic, i.e. it originates from the band structures of two spin-channels in the ferromagnetic graphene. Interestingly, we found large increase of the Seebeck coefficient and also of the ZT efficiency at the band edge. Similar phenomenon has been very recently predicted in the model calculations by Sharapov and Varlamov Sharapov for gapped graphene, and by Hao and Lee Hao for bilayer graphene with the band-gap tuned by the external electric field. Unusual fact is that, we obtained larger growth of the ZT efficiency not at high temperatures, as common findings in the high-ZT materials, but at lower temperatures.
The paper is organized as follows: we give details of the calculations in section 2, present the results in section 3 - for the free-standing systems in subsection 3.1 and deposited systems in subsection 3.2, analyse the mathematical expressions for the thermoelectric properties using 1D, 2D and 3D models of the band structure in section 4, and conclude in section 5.
II Theoretical details
We performed the density-functional theory calculations of the band structures, and applied the Quantum ESPRESSO suit of codes qe which uses the plane-wave basis set and the pseudopotentials for the core electrons. The exchange-correlation functional was chosen for the gradient corrected Perdew-Wang(91) parametrization. The ultrasoft pseudopotentials were used with the energy cutoffs 20 Ry and 200 Ry for the plane-waves and the density, respectively. The Monkhorst-Pack uniform k-mesh in the Brillouin zone has been set to for the free-standing and for the deposited graphene sheets. The vacuum separation between the periodic slabs was around 50 Å.
In order to fit the band structure on the very fine k-mesh, i.e. points in the graphene plane, we employed the wannier90-2.0.0 package w90-2 111www.wannier.org which interpolates bands using the maximally-localized Wannier functions RMP . The thermoelectric distribution function and the thermoelectric properties were obtained from the BoltzWann post-processing code BW with the constant relaxation time set to 10 fs.
The geometric parameters of buckled graphene under H- and F-doping were taken from the work by Rudenko et al. Rudenko . For the geometry of the doped graphene deposited on the C-face -SiC(0001) surface, we used the supercell to match the graphene sheets with the substrate. Between the doped graphene and the surface C-atoms, we put two buffer layers in the ABA stacking including the doped top-layer. The interlayer distances were taken from the experimental work by Borysiuk et al. Borys .
III Results
III.1 Free-standing doped graphene monolayer
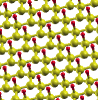
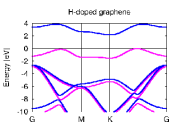
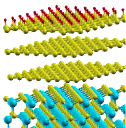
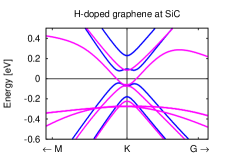
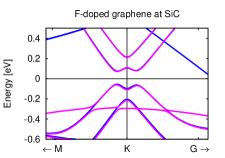
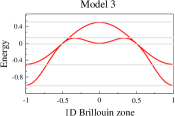
The adsorption of hydrogen atom on graphene produces the spin-polarization of neighboring carbon atoms defect . The same occurs for half-doping by hydrogens or fluorines. The magnetic moments per -state of the free C-atom are about 0.76 and 0.59 for H- and F-doping, respectively, obtained with the local density approximation in Ref. Rudenko . Our calculations with the generalized gradient approximation give, as usually for this scheme, higher magnetic moments per C-atom: 1.0 for H-doping and 0.84 for F-doping. The top view of the doped graphene layer and the spin-polarized band structures are displayed in Fig. 1. The impurity states in the H-doped case are completely separated on the occupied- and the unoccupied-states sides for the spin-up and spin-down channels, respectively. The experimental confirmation for existence of the separated impurity band in the hydrogenated graphene is given in angle-resolved photo-emission spectroscopy (ARPES) studies in Refs. Dan1 ; Dan2 . It is interesting to mention that the local hydrogen doping causes large structural folding of the graphene sheets, which finds various applications origami . Also the thermal conductivity has been studied for the strained that way graphene sheets H-strain . For the F-doped system, the impurity spin-states are separated below and above the Fermi level around the K and M symmetry-points, but close to the middle of the Brillouin zone both spin-states are merged with the valence band. We will show that the above band-structure details have consequences for the thermoelectric properties.
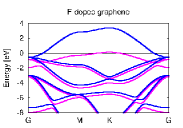
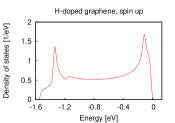
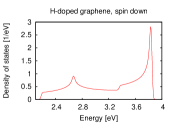
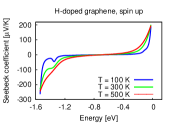
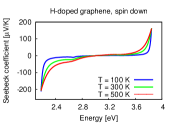
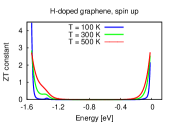
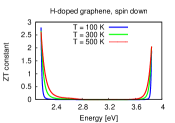
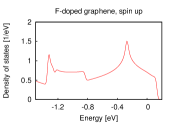
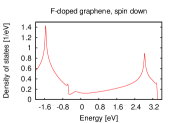
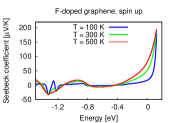
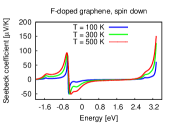
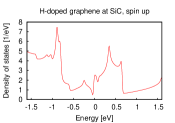
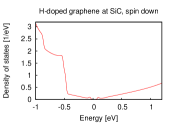
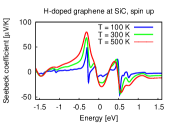
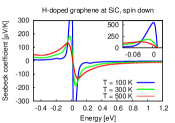
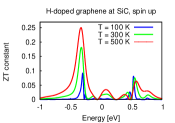
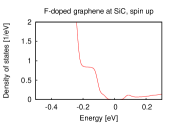
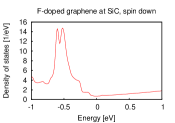
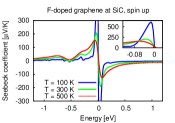
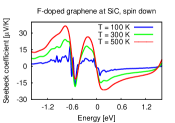
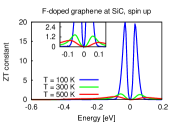
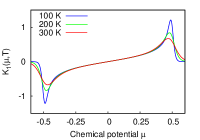
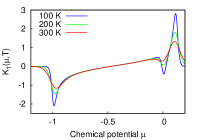
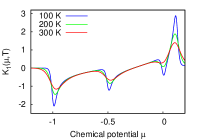
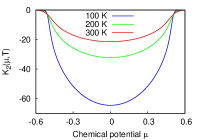
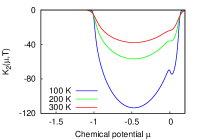
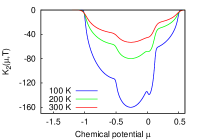
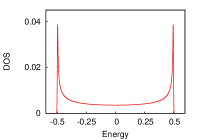
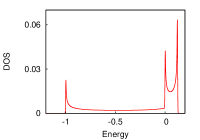
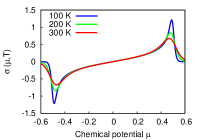
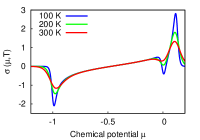
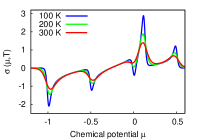
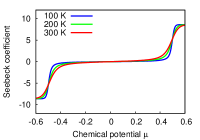
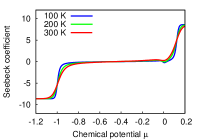
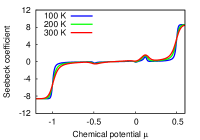
In Fig. 2, we present the density of states (DOS), the Seebeck coefficient and the ZT efficiency for the H-doped graphene, and in Fig. 3 the same properties of the F-doped graphene. In the middle of the impurity bandwidth for both spins and both H- and F-doping, the thermoelectric parameters are very low. But at the separated band edges, the thermopower and the ZT efficiency grows to very high values. This is for both the high- and the low-energy ends of the H-impurity bands, and for the F-impurity bands only at the high-energy band edge. The thermoelectric parameters at the low-energy parts of the F-impurity bands are low, since in that region, the impurity bands touch the valence band manifold. For the spin-down channel of the F-doped graphene, we observe the Seebeck-coefficient and the ZT-efficiency extrema similar to these obtaned for the pure graphene close to the band crossing at the Fermi level near the K-point noi-arxiv . Less pronounced features of the same shape in the thermopower curve are visible below -1.2 eV for the spin-up case, and they originate from the band crossings close to the G-point towards the M and K symmetry-points. Since the desired thermoelectric properties occur at the band-edges, we check the shape of the electronic density function. The DOS of all investigated free-standing systems is high or moderate close to the impurity band edges. Thus the enhancement effect of the thermoelectric parameters should be visible in the experiments.
III.2 Doped graphene monolayer deposited on the C-face -SiC(0001) with two buffer-layers
For the technological reasons, the substrate at which the electronically active layer was deposited or grown is as important as the upper layer itself. The C-face SiC deposited graphene characterizes by very good technological parameters, such as the electron mobility up to 1800 cm2/Vs, and the defect-free large wafers even 150 mm in diameter can be grown Strup . Moreover, the thermopower parameter of SiC is very good, about -480 V/K. Therefore SiC can transfer heat from the electronic device Ssic . All that made our choice for the substrate for testing the spin-dependent thermoelectric properties of the deposited H- and F-doped graphene.
The atomic structure of doped graphene sheet on top of two buffer layers above the C-face SiC(0001) surface is displayed in Fig. 4, together with the band structures of H- and F-doped systems. In the case of hydrogen doping, the majority spin-bands close to the K-point are similar to the bands of bilayer graphene in the AB stacking or graphite Borys ; noi-arxiv - with the difference that here the parabolic bands touch each other below the Fermi level, and the minority spin-bands open the gap close to the K-point. In the case of fluorine doping, the band gap opens at the K-point in both spin channels. For the minority spin, additional bands cross the Fermi level at G and M-point. These details of the band structure rule the thermoelectric properties.
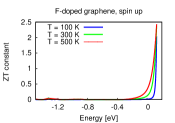
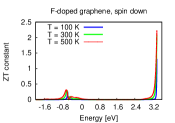
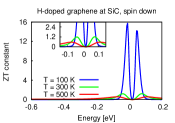
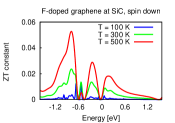
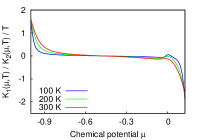
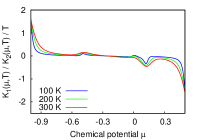
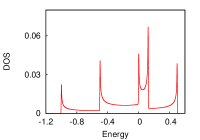
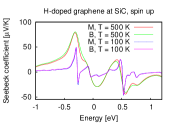
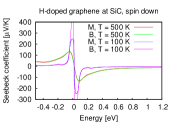
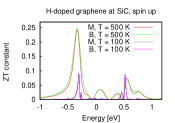
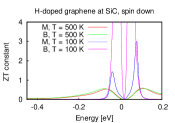
The DOS, the thermopower and the ZT efficiency for the H-doped graphene are presented in Fig. 5, and for the F-doped graphene in Fig. 6. When the gap opens then the thermoelectric parameters jump very high. This situation takes place for the spin-up channel in H-doping and the spin-down channel in F-doping cases. The effect might be more difficult to measure than in the free-standing cases, since the DOS of the deposited doped graphene is lower close to the band edges. The Seebeck coefficient at the temperatures 100, 200, 300, 400 K reaches at maximum values 554, 270, 185, 148 V/K, respectively, for the H-doped graphene in the spin-down channel, and in the case of the F-doped graphene in the spin-up channel, the thermopower achieves values of 593, 297, 207, 171 V/K respectively. The ZT efficiency is 15.78, 2.88, 1.19, 0.74 for the H-doped graphene in the spin-down channel at 100, 200, 300, 400 K, respectively, and correspondingly, for the F-doped graphene in the spin-up channel, the ZT figure of merit is 20.10, 3.45, 1.45, 0.95, respectively. It is peculiar and of great application potential, that the thermopower and the ZT figure of merit at the band edges achieve very high values for lower temperatures - in contrast to all other cases known so far in the high-ZT physics.
Our finding of the band-edge growth of the Seebeck coefficient and the ZT figure of merit is in agreement with the model predictions by Sharapov and Varlamov Sharapov for pure gapped graphene. They explained the effect of giant growth of the thermopower at the band gap in graphene assuming the strong dependence of the relaxation time on the energy, i.e. the band details. Similar work has been published by Hao and Lee Hao for the tunable gapped bilayer graphene. In this work, we show in the next section that the band-edge growth of the thermopower is caused by vanishing band velocities, independently on the model used for the relaxation time. In both, our work and the model consideretations by Sharapov and Varlamov, the break of the symmetry equivalence between two sublattices in graphene takes place. However, it will be explained below that the effect is more general and applies to all gapped systems independently on their lattices.
IV Model studies of a fingerprint of the band-structure features in the thermopower curve
We analyse how the band-structure features such as local extrema, band edges and Van Hove singularities are reflected in the Seebeck-coefficient curve. We begin with the collection of the mathematical expressions within the Boltzmann framework and the results for the model band structures. Later, we discuss also the Seebeck coefficent obtained from the Mott formula for the band structures in 1D, 2D and 3D.
The transport distribution function (TDF) is a 3D tensor defined as a function of the energy as follows:
where is the system volume, is the band velocity, is the band dispersion, and is the relaxation time dependent on the band index and the reciprocal space . The TDF enters an expression for the 3D tensor of the Seebeck coefficients , which depends on the chemical potential and temperature T, and is defined as:
where
In the above formulae, the function is the Fermi-Dirac distribution and is the electron charge.


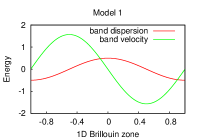
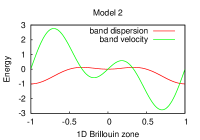
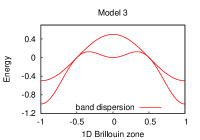
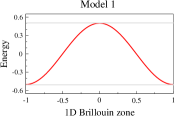
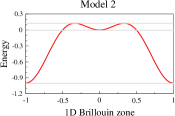
We begin, for simplicity, with the model bands in 1D and skip the indeeces . In Fig. 7, we propose three band structures: 1) isolated symmetric band, 2) isolated asymmetric band, 3) two bands of the previous models together, which partially overlap in the energetic range. The constant relaxation time is asumed. We plot also the band velocities and the kernels entering the expression for the thermopower. From the formula for and Fig. 7, it is obvious that the TDF is vanishing when the band velocities are negligible. Importantly, the kernel is smaller than the kernel . Thus the Seebeck coefficient as a function of the chemical potential is growing with the energetic range where the band extrema or termination occur. Summation over the band index in the TDF expression makes the superposition of the effects from all bands - where the band velocities vanish for one band and the other not, the overall effect is smoothed in the thermopower curve. Therefore, after summation over bands, only the effects from the highest and the lowest energetic parts of the band manifold rest.
The effect is stronger for low temperatures but in a very tiny energetic range, which depends also on the band width of the given system. For higher temperatures, the thermopower growth is pronounced at wider energetic range and could be easier measured.
If we did not assume that the relaxation time was constant, the described features would be either better pronounced or smoothed depending on the dispersion. On the other hand, the band velocities do not change under the relaxation-time model. Thus, one can draw the conclusion that the band termination - within the energetic range - will enhance the thermopower in any case.
In order to extend the analysis to 2D and 3D cases and compare the peaks of the thermopower curve with the location of the Van Hove singularities, we use also the approximate Mott relation which contains the full temperature dependent electron conductivity . This formula was introduced by Löfwander and Fogelström in Ref. mott with an application to the disorder effects in graphene. These approximate Mott formula reads:
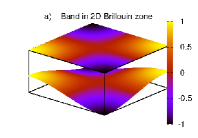
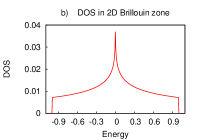
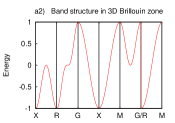
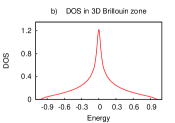
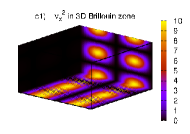
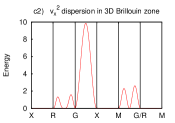
In Fig. 8, we show again the 1D analysis of the thermopower components but for the above Mott’s formula. In the band structure pictures, in the first row, we drow the lines which guide an eye to the local extrema corresponding to the vanishing band velocities. In the second row, we display the corresponding density of states (DOS). Further, in the third row, we show the electrical conductivity obtained from the TDF. In the last row, we plot the Seebeck coefficient fom the Mott’s formula. The growth of thermopower coinsides only with these Van Hove singularities which correspond to the parts of the TDF where vanishing band velocities are not summed over the Brillouin zone with the non-vanishing band velocities.
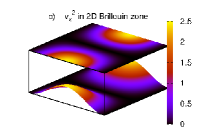
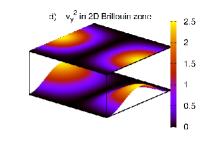
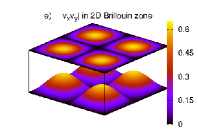
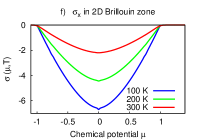
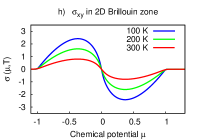
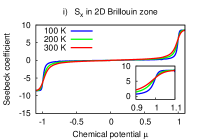
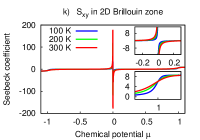
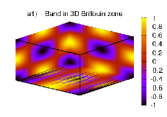
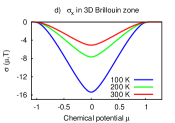
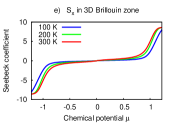
In Fig. 9 and Fig. 10, we present similar analysis like in Fig. 8, with the difference that the bands are defined in 2D and 3D, with the corresponding model band formulae and , respectively. The 3D band is very symmetric, therefore all components of the tensors and are equal, since the same occurs for the band velocities . All the conclusions drawn from the 1D model are still valid here. With an addition that in 2D and 3D, the anisotropy is plaussible, and we see this effect in Fig. 9 k). This is due to the fact that the energy isosurfaces (for E=0) overlap in the Brillouin zone with the zeros of function. The thermopower growth effect does not occur for x and y diagonal components because the energy isosurfaces are larger than the band velocities isosurfaces. Thus non-vanishing components of the band velocities contribute to the TDF from the perpendicular direction to the polarization of chosen element of the thermopower tensor when the summation over BZ is performed.
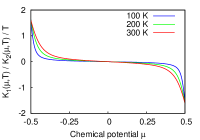
In the end, we present a comparison of the two approaches: our Boltzmann-equations based scheme and approximate Mott formula mott . These methods are applied to the case of H-doped graphene deposited at the SiC C-terminated surface. The results for the temperatures of 100 and 500 K are displayed in Fig. 11. In the Mott’s formula, we used the electrical conductivity calculated from the DFT bands. The two approaches give the same or very similar curves. The difference is in the height of the peaks at thermoelectrically enhanced parameters. Both methods lead to the same conclusions.
The phenomenon is general for many materials, especially for doped semiconductors where it should occur at the top of the valence band and the bottom of the conduction band. It applies also at the superconducting gap in the graphene-superconductor junction, as discussed by Wysokiński and Spałek in Ref. Spalek , and in the superconductor-ferromagnet junction in the presence of the magnetic field, as predicted by Ozaeta et al. in Ref. Ozaeta . The same effect has been found recently in carbon nanowires by Tan et al. in Ref. C-wire , where large Seebeck effect showed up at the boundary of the zero-transmission windows. Interestingly, large growth of the thermopower should be observed in materials which have many flat bands, almost molecular-like states, such as molecular crystals or 2D organic semiconductors possess. In the perovskites, the flat band regions at -X and X-M lines will certainly increase the thermopower, although these features are screened in the summation over the band index and k-space in the TDF expression. Similar effects have been observed in Ref. perovskites for the electron doped SrTiO3 and KTaO3 and are expected to occur in topological insulators.
V Conclusions
We investigated the thermoelectric properties of halfly H- and F-doped graphene.
These systems are spin-polarized with the magnetic moments located at the undoped C-atoms.
The effect of deposition on the C-face -SiC(0001) surface with two buffer layers
have been also examined. The accurate calculations were performed for the band structures
obtained from the density-functional theory and interpolated using the maximally-localized
Wannier functions, finally to be embedded in the Boltzmann equations.
We found very interesting effect, which manifests with a huge growth of the thermopower
and the ZT efficiency at the energies where the band manifolds terminate.
The enhancement of the thermoelectric parameters at the band edges is a general property,
not restricted to the graphene systems. This phenomenon deserves further
investigations, in order to pave the way for two-digital values of ZT, and deny
an inconvenient truth about the thermoelectrics that there are limitations for
the search of efficient materials ZT1 .
The interesting and technologically important fact is that the thermoelectric parameters
at the band-termination energies can be very high at low temperatures,
which is not plaussible in the ordinary high-ZT materials. Similar effects have been observed
for gapped graphene Sharapov ; Hao , graphene-superconductor Spalek and
graphene-ferromagnet Ozaeta junctions, and also graphene nanowires C-wire .
Acknowledgements
We thank Prof. Józef Barnaś for helpful discussion.
This work has been supported by the European Funds for Regional Development
within the SICMAT Project (Contract No. UDA-POIG.01.03.01-14-155/09),
Operational Program Innovative Economy (Contract No. POIG.01.01.02-00-097/09
”TERMET - New structural materials with enhanced thermal conductivity”) and
the National Science Center in Poland (the Project No. DEC-2012/04/A/ST3/00372).
Calculations have been performed in the Interdisciplinary Centre of
Mathematical and Computer Modeling (ICM) of the University of Warsaw
within the grants G51-2 and G47-7,
and by part supported by PL-Grid Infrastructure.
References
- (1) Bauer GEW, Saitoh E, van Wees BJ. Spin caloritronics. Nature Mater 2012;11(5):391-399.
- (2) Uchida K, Takahashi S, Harii K, Ieda J, Koshibae W, Ando K, Maekawa S, Saitoh E. Observation of the spin Seebeck effect. Nature 2008;455(7214):778-781.
- (3) Uchida K, Xiao K, Adachi H, Ohe J, Takahashi S, Ieda J, Ota T, Kajiwara Y, Umezawa H, Kawai H, Bauer GEW, Maekawa S, Saitoh E. Spin Seebeck insulator. Nature Mater 2010;9(11):894-897.
- (4) Uchida K, Adachi H, Ota T, Nakayama H, Maekawa S, Saitoh E. Observation of the longitudinal spin-Seebeck effect in magnetic insulators. Appl Phys Lett 2010;97(17):172505-4.
- (5) Uchida K, Nonaka T, Ota T, Saitoh E. Longitudinal spin-Seebeck effect in sintered polycrystalline (Mn,Zn)Fe2O4. Appl Phys Lett 2010(26);97:262504-4.
- (6) Jaworski CM, Yang J, Mack S, Awschalom DD, Heremans JP, Myers RC. Observation of the spin Seebeck effect in a ferromagnetic semiconductor. Nature Mater 2010;9(11):898-903.
- (7) Sinova J. Spin Seebeck effect: Thinks globally but acts locally. Nature Mater 2010;9(11):880-881.
- (8) Flipse J, Bakker FL, Slachter A, Dejene FK, van Wees BJ. Direct observation of the spin-dependent Peltier effect. Nature Nanotech 2012;7(3):166-168.
- (9) Vining CB. An inconvenient truth about thermoelectrics. Nature Mater 2009;8(2):83-85.
- (10) Tritt TM, Böttner H, Chen L. Thermoelectrics: Direct solar thermal energy conversion. Mater Res Soc Bull 2008;33(4):366-368.
- (11) Verma R, Bhattacharya S, Mahapatra S. Thermoelectric performance of a single layer graphene sheet for energy harvesting. IEEE Transactions on Electron Devices 2013;60(6):2064-2070.
- (12) Yin J, Zhou J, Li X, Chen Y, Tai G, Guo W. Enhanced gas-flow-induced voltage in graphene. J Appl Phys 2011;99(7):073103-3.
- (13) Li X, Yin J, Zhou J, Wang Q, Guo W. Exceptional high Seebeck coefficient and gas-flow-induced voltage in multilayer graphene. Appl Phys Lett 2012;100(18):183108-4.
- (14) Xing Y, Sun Q-F, Wang J. Nernst and Seebeck effects in a graphene nanoribbon. Phys Rev B 2009;80(23):235411-8.
- (15) Liu T-H, Lee S-C, Pao C-W, Chang C-C. Anomalous thermal transport along the grain boundaries of bicrystalline graphene nanoribbons from atomistic simulations. http://dx.doi.org/10.1016/j.carbon.2014.03.005
- (16) Nissimagoudar AS, Sankeshwar NS. Electronic thermal conductivity and thermopower of armchair graphene nanoribbons. Carbon 2013;52:201-208.
- (17) Wei P, Bao W, Pu Y, Lau CN, Shi J. Anomalous thermoelectric transport of Dirac particles in graphene. Phys Rev Lett 2009;102(16):166808-4.
- (18) Peres NMR, Lopes Dos Santos JMB, Stauber T. Phenomenological study of the electronic transport coefficients of graphene. Phys Rev B 2007;76(7):073412-4.
- (19) Zeng M, Feng Y, Liang G. Graphene-based spin caloritronics. Nano Lett 2011;11(3):1369-1373.
- (20) Zhao Y, Tang G-S, Yu Z-Z, Qi J-S. The effect of graphite oxide on the thermoelectric properties of polyaniline. Carbon 2012;50:2064-2073.
- (21) Yazyev OV, Helm L. Defect-induced magnetism in graphene. Phys Rev B 2007;75(12):125408-5.
- (22) Rudenko AN, Keil FJ, Katsnelson MI, Lichtenstein AI . Exchange interactions and frustrated magnetism in single-side hydrogenated and fluorinated graphene. Phys Rev B 2013;88(8):081405(R)-4.
- (23) Moaied M, Moreno JA, Caturla MJ, Palacios JJ. A theoretical study of the dynamics of atomic hydrogen adsorbed on graphene multilayers. arXiv: 1405.3165
- (24) Moaied M, Álvarez JV, Palacios JJ. Hydrogenation-induced ferromagnetism on graphite surfaces. arxiv: 1405.3168
- (25) Park H, Wadehra A, Wilkins JW, Castro Neto AH. Spin-polarized electronic current induced by sublattice engineering of graphene sheets with boron/nitrogen. Phys Rev B 2013;87(8):085441-6.
- (26) Sharapov SG, Varlamov AA. Anomalous growth of thermoelectric power in gapped graphene. Phys Rev B 2012;86(3):035430-5.
- (27) Hao L, Lee TK. Thermopower of gapped bilayer graphene. Phys Rev B 2010;81(16):165445-8.
- (28) Giannozzi P, Baroni S, Bonini N, Calandra M, Car R, Cavvazzoni C, et al., QUANTUM ESPRESSO: a modular and open-source software project for quantum simulations of materials. J Phys Condens Matter 2009;21(39):395502-19.
- (29) Mostofi AA, Yates JR, Lee YS, Souza I, Vanderbilt D, Marzari N. wannier90: A tool for obtaining maximally-localised Wannier functions. Comput Phys Commun 2008;178(9):685-699.
- (30) Marzari N, Mostofi AA, Yates JR, Souza I, Vanderbilt D. Maximally localized Wannier functions: Theory and applications. Rev Mod Phys 2012;84(4):1419-1475.
- (31) Pizzi G, Volja D, Kozinsky B, Fornari M, Marzari N. BoltzWann: A code for the evaluation of thermoelectric and electronic transport properties with a maximally-localized Wannier functions basis. Comp Phys Comm 2014;185(1):422-429.
- (32) Borysiuk J, Bożek R, Grodecki K, Wysmołek A, Strupiński W, Stȩpniewski R, Baranowski JM. Transmission electron microscopy investigations of epitaxial graphene on C-terminated 4H-SiC. J Appl Phys 2010;108(1):013518-6.
- (33) Haberer D, Petaccia L, Farjam M, Taioli S, Jafari SA, Nefedov A, Zhang W, L. Calliari, G. Scarduelli, B. Dora, D. V. Vyalikh, T. Pichler, Ch. Wöll, D. Alfé, Simonucci S, Dresselhaus MS, Knupfer M, Büchner B, Grüneis A. Direct observation of a dispersionless impurity band in hydrogenated graphene. Phys Rev B 2011;83(16):165433-6.
- (34) Scheffler M, Haberer D, Petaccia L, Farjam M, Schlegel R, Baumann D, Hanke T, Grüneis A, Knupfer M, Hess C, Büchner B. Probing local hydrogen impurities in quasi-free-standing graphene. ACS Nano 2012;6(12):10590-10597.
- (35) Zhu S, Li T. Hydrogenation-Assisted Graphene Origami and Its Application in Programmable Molecular Mass Uptake, Storage, and Release. ACS Nano DOI:10.1021/nn500025t
- (36) Li C, Li G, Zhao H. Hydrogenation induced deformation mode and thermal conductivity variations in graphene sheets. Carbon 2014;72:185-191.
- (37) Wierzbowska M, Dominiak A, Pizzi G. Effect of C-face -SiC(0001) deposition on thermopower of single and multilayer graphene in AA, AB and ABC stacking. arXiv:1403.1286
- (38) Strupiński W, Grodecki K, Wysmołek A, Stȩpniewski R, Szkopek T, Gaskell PE, Grüneis A, Haberer D, Bożek R, Krupka J, Baranowski JM. Graphene epitaxy by chemical vapor deposition on SiC. Nano Lett 2011;11(4):1786-1791.
- (39) Wang XH, Yamamoto A, Eguchi K, Obara H, Yoshida T. Thermoelectric properties of SiC thick films deposited by thermal plasma physical vapor deposition. Sci Technol Adv Mater 2003;4(2):167-172.
- (40) Löfwander T, Fogelström M. Impurity Scattering and Mott’s formula in graphene. Phys Rev B 2007;76(19):193401-4.
- (41) Wysokinski MM, Spałek J. Seebeck effect in the graphene-superconductor junction. J Appl Phys 2013;113(16):163905-5.
- (42) Ozaeta A, Virtanen P, Bergeret FS, Heikkilä TT. Predicted very large thermoelectric effect in ferromagnet-superconductor junctions in the presence of a spin-splitting magnetic field. Phys Rev Lett 2014;112(5):057001-5.
- (43) Tan XJ, Liu HJ, Wei J, Shi J, Tang XF, Uher C. Thermoelectric properties of small diameter carbon nanowires. Carbon 2013;53:286-291.
- (44) Usui H, Shibata S, Kuroki K. Origin of coexisting large Seebeck coefficient and metallic conductivity in the electron doped SrTiO3 and KTaO3. Phys Rev B 2010;81(20):205121-6.