Magnetic ordering at anomalously high temperatures in Dy at extreme pressures: a new Kondo-lattice state?
Abstract
In an attempt to destabilize the magnetic state of the heavy lanthanides Dy and Gd, extreme pressures were applied in an electrical resistivity measurement to 157 GPa over the temperature range 5 - 295 K. The magnetic ordering temperature and spin-disorder resistance of Dy, as well as the superconducting pair-breaking effect in Y(1 at.% Dy), are found to track each other in a highly non-monotonic fashion as a function of pressure, all three increasing sharply above 73 GPa, the critical pressure for a 6% volume collapse in Dy. At 157 GPa is estimated to reach temperatures in the range 370 - 500 K, the highest magnetic ordering temperature of any lanthanide. In contrast, for Gd shows no such sharp increase to 105 GPa. Taken together, these results suggest that pressures greater than 73 GPa transform Dy from a conventional magnetic lanthanide into a Kondo lattice system with an anomalously high magnetic ordering temperature.
Subjecting a solid to arbitrarily high pressures will successively break up its atomic shell structure, leading to a rise and fall in all condensed matter properties, including magnetism and superconductivity, until finally only a structureless Thomas-Fermi gas remains jim1 . Although such astronomic pressures are not available in the laboratory, recent technological developments do allow measurements of the magnetic and superconducting properties of matter to multi-megabar pressures where the increase in energy (1-10 eV/atom) is sufficient to significantly alter electronic states. Systems with magnetic instabilities exhibit some of the most fascinating properties in current condensed matter physics, including topological insulators beidenkopf , Kondo lattice behavior aynajian , and exotic forms of superconductivity scalapino . With the availability of extreme pressures, it may now be possible to transport many conventional magnetic systems to ones exhibiting new and unexpected magnetic and/or superconducting properties.
Due to the high degree of localization of their 4 orbitals, the heavy lanthanide metals, such as Dy, display the purest form of local moment magnetism. It can be estimated that the molar volume of the heavy lanthanides would have to be compressed approximately five-fold before the nearest-neighbor overlap of 4 orbitals becomes sufficient to prompt a local-to-itinerant transition jim . Other forms of magnetic instability may require less compression. Jackson et al. jackson1 have pointed out that the heavy lanthanides Gd, Tb, Dy, Ho, Er, and Tm exhibit conventional magnetic ordering to pressures of GPa as evidenced by the fact that their respective magnetic ordering temperatures obey de Gennes factor scaling degennes . Were the 4 magnetic state to become unstable under extreme pressure, such scaling would not continue.
Dy is a trivalent heavy lanthanide with hcp structure, a 4 electron configuration, antiferromagnetism below 178 K, and ferromagnetism below 85 K behrendt1 . In this paper we present the results of temperature-dependent dc electrical resistivity measurements on Dy to pressures as high as 157 GPa, well above the pressure of 73 GPa where Dy suffers a 6% volume collapse, reportedly transforming from the hexagonal hR24 to a body-centered monoclinic (bcm) structure patterson1 . As the applied pressure passes through 73 GPa, the magnetic ordering temperature begins to increase dramatically, appearing to rise well above ambient temperature to values surpassing those for any lanthanide. These and parallel resistivity studies on both Gd metal and the dilute magnetic alloys Y(1 at.% Dy) and Y(0.5 at.% Gd) give evidence that extreme pressures transform Dy into a Kondo lattice system with a significantly enhanced magnetic ordering temperature lying between 370 K and 500 K at 157 GPa.
Resistivity samples were cut from Dy and Gd foil (99.9% Alfa Aesar). The dilute magnetic alloys were prepared by argon arc-melting stoichiometric amounts of Y (99.9% Ames Lab ames ) with Dy or Gd dopant. Following the initial melt, the sample was turned over and remelted several times with less than 0.1% weight loss.
To generate pressures well beyond the volume collapse pressure of Dy at 73 GPa, a diamond anvil cell (DAC) made of CuBe alloy was used Schilling84 . Three separate non-hydrostatic high-pressure experiments on Dy were carried out. In run 1 two oppposing diamond anvils (1/6-carat, type Ia) with 0.5 mm diameter culets were used. In runs 2 and 3 the anvils had a 0.35 mm diameter culet beveled at 7∘ to a 0.18 mm central flat. The Re gasket (6-7 mm diameter, 250 m thick) was preindented to 30 m and a 80 m diameter hole electro-spark drilled through the center (for the 0.5 mm culet anvils the gasket was preindented to 80 m with a 250 m diameter hole). The center section of the preindented gasket surface was filled with a 4:1 cBN-epoxy mixture to insulate the gasket and serve as pressure medium (see inset in Fig. 1). The thin Dy sample (dimensions 30305 m3) was then placed on top of four thin Pt leads for a four-point dc electrical resistivity measurement. Two experimental runs were carried out on the thin Gd sample (same dimensions as for Dy) using beveled anvils as above. Further details of the non-hydrostatic high pressure resistivity technique are given in a paper by Shimizu et al. Shimizu05 .
A He-gas-driven membrane was utilized to change pressure at any temperature above 3 K daniels1 . In the measurement on the Y(1 at.% Dy) alloy, one ruby sphere was positioned at the center of, and another directly next to, the sample. The average pressure over the sample was determined in situ at 25 K with the standard ruby fluorescence technique using the revised pressure scale of Chijioke et al. Chijioke05 . In the resistivity measurements on Dy and Gd, pressure was determined using both ruby fluorescence and, in the upper pressure range, Raman spectroscopy from the frequency shift of the diamond vibron raman1 . The “home-made” Raman spectrometer utilizes a Nikon metallographic microscope coupled fiber-optically to a sensitive QE65000 spectrometer from Ocean Optics benzene . The values of the pressures given are averaged over the sample to an estimated accuracy of In these experiments temperatures as low as 1.3 K were reached in an Oxford flow cryostat. Further experimental details of the DAC and cryostat are given elsewhere Schilling84 ; klotz1 ; debessai1 .
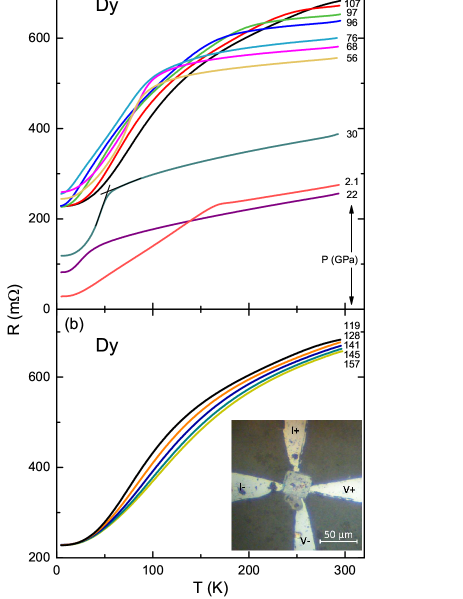
The present resistivity studies on Dy were carried out in three separate experiments. In Fig. 1 the electrical resistance of Dy from run 3 is plotted versus temperature at 14 different pressures to 157 GPa. The magnetic ordering temperature is defined by the kink in the dependence clearly seen near 170 K at 2.1 GPa, the lowest pressure of the experiment. At higher pressures this kink broadens somewhat due to pressure gradients across the sample, but remains clearly visible to 107 GPa. We define by the intersection point of two straight lines, as illustrated for the data at 30 GPa in Fig. 1(a).
Fig. 1(b) shows the resistance data on Dy at the highest pressures. The fact that the curves continue to shift to higher temperatures with pressure indicates that the magnetic ordering temperature has increased above 295 K (see Supplemental Material suppl for a detailed analysis). The residual resistance K) initially increases appreciably with pressure as defects are introduced into the sample through plastic deformation by the non-hydrostatic pressure. However, for pressures of 56 GPa and above the pressure cell stabilizes, the relatively small changes (both positive and negative) in K) at higher pressures likely arising from small displacements of the voltage contacts.
In Fig. 2(a) is plotted versus pressure to 107 GPa for all three experiments on Dy. The results are in reasonable agreement both with earlier results of Jackson et al. jackson1 to 7.4 GPa and very recent resistivity studies of Samudrala et al. samu to 69 GPa. The pressure dependence is seen to be highly non-monotonic, presumably in response to changes in crystal structure given at the top of the graph. initially decreases with pressure, the rate of decrease roughly doubling at the hcp to Sm-type phase transition before passing through a minimum and increasing at GPa near the transition to the dhcp structure. The rate of increase is then diminished near the transition to hexagonal hR24 patterson1 ; shen .

Particularly intriguing is the dramatic increase in slope following the hR24 to body-centered monoclinic (bcm) transition at 73 GPa patterson1 . Above 73 GPa, for Dy begins to increase rapidly with pressure and appears to pass through 295 K near 119 GPa. Extrapolating the straight line in Fig. 2(a) above 100 GPa to the highest pressure of 157 GPa yields the estimate 500 K. How dramatic this increase in really is can be seen in Fig. 2(b) where is plotted versus relative sample volume , a parameter with a more direct physical significance than pressure . In Fig. 2(b) the rate of increase of below (above 73 GPa), is seen to be much steeper than the initial rate of decrease of near 0 GPa where . Extrapolating in Fig. 2(b) linearly to (157 GPa), yields the estimate 430 K. In the Supplemental Material suppl the resistance data for GPa are analyzed in detail, yielding the semi-quantitative value 370 K. At 157 GPa the magnetic ordering temperature of Dy is thus estimated to lie in the range 370 - 500 K. This is the highest magnetic ordering temperature of any lanthanide, surpassing Gd’s ambient pressure value 292 K colvin1 .
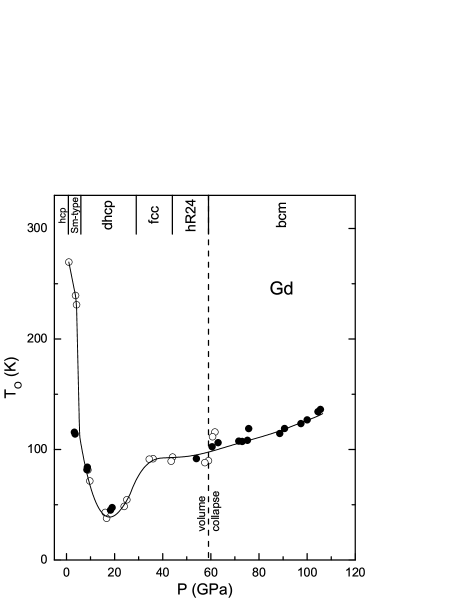
An obvious question remains: what is(are) the mechanism(s) responsible for the highly non-monotonic dependence of the magnetic ordering temperature of Dy on pressure, particularly its dramatic increase just above 73 GPa? To shed some light on this matter, it is interesting to compare the pressure dependence for Dy in Fig. 2(a) to that for its lighter next-nearest-neighbor lanthanide, Gd, shown in Fig. 3. A detailed comparison of the data for Dy and Gd reveals striking similarities to 70 GPa. Fleming and Liu fleming show that the initial decrease in with pressure for Gd, Tb, and Dy is a direct consequence of shifts in the electronic energy bands. Gd gd and Dy patterson1 undergo a very similar set of structural phase transitions (those for Gd at somewhat reduced pressures) driven by increasing 5d electron occupation with pressure pettifor . The highly non-monotonic dependence seen for both Gd and Dy to 70 GPa is thus likely driven by shifts in the energy bands and changes in the Fermi surface associated with the multiple structural phase transitions.

For pressures above 70 GPa, however, the pressure dependences of for Gd and Dy are seen to differ significantly. Whereas for Dy displays a sharp upturn above 73 GPa, that for Gd increases only gradually over the entire pressure range 40 - 105 GPa with no sign of a rapid upturn near the volume collapse pressure for either element. Since the phase diagrams of Gd and Dy are so similar, the sharp upturn in for Dy almost certainly does not originate from shifts in the energy bands but rather from an anomalous increase in the effective exchange interaction between the magnetic ions and the conduction electrons. Unlike the conventional lanthanide Gd, Dy appears to enter a new state for pressures above 73 GPa, the nature of which we now explore.
A long-standing strategy matthias ; maple2 to probe the magnetic state of a given ion is to alloy the magnetic ion in dilute concentration with a superconductor and determine to what extent the superconducting transition temperature is suppressed The pressure dependence for Y(0.5 at.% Gd) was found to faithfully track that for Y to the maximum pressure of 126 GPa fabbris1 . This gives evidence that over this pressure range Gd remains a conventional magnetically stable lanthanide. The absence of magnetic instabilities in Gd, even at extreme pressures, is not surprising since the magnetic state of Gd with its half-filled 4 shell is the most stable of all elements, its 4 level lying eV below the Fermi level yin .
This contrasts with the data for Y and its dilute magnetic alloy Y(1 at.% Dy) where the obtained pressure dependence of is plotted in Fig. 4 (see Supplemental Material for details suppl ). As for , the pressure dependence of is seen to show a sharp upturn above 73 GPa, reaching the value 9 K at the highest pressure. Such a dramatic suppression of superconductivity strongly suggests Kondo pair breaking, implying that the normally positive exchange interaction becomes negative for 73 GPa, a pre-requisite for Kondo effect phenomena. A negative value of for GPa in Dy signals that Dy has been transformed into a Kondo lattice system.
What is the mechanism behind the sharp upturn in and above 73 GPa? When is negative, the covalent mixing interaction between the 4 and conductions electrons is dominant. then depends on the mixing matrix element and the 4-electron stabilization energy according to where is assumed small compared to the Coulomb repulsion between electrons on the same orbital schrieffer . As the magnetic ion heads toward the mixed-valence state with increasing pressure, approaches zero and/or increases. In either case is enhanced. The magnetic ordering temperature would thus both be expected to increase with pressure until becomes so large that the local magnetic moment begins to be compensated through the exponentially increasing Kondo spin screening, as anticipated in the simple Kondo-lattice model doniach1 ; yang . This could then lead to an anomalously high value of , such as observed for Dy at extreme pressure, a value perhaps surpassing that possible for normal positive exchange interactions.
Interestingly, in Fig. 4 it is also seen that the spin-disorder resistance at 295 K (see Supplemental Material suppl ) also changes under pressures to 105 GPa in a manner similar to that seen for in Fig. 2(a). That in Dy all three quantities , , and track each other as a function of pressure is not surprising since, in the simplest model, all three are proportional to the square of the exchange interaction
In summary, measurements of the electrical resistivity of Dy metal to extreme pressures reveal that the magnetic ordering temperature exhibits a highly non-monotonic pressure dependence, rising dramatically for 73 GPa to unprecedentedly high values in the range 370 - 500 K. Parallel experiments on Gd and dilute magnetic alloys of Gd and Dy with Y give evidence that under extreme pressures Dy is transformed from a magnetically conventional lanthanide into a dense Kondo lattice system with anomalously high values of . At pressures even higher than those in the present experiment, would be expected to pass through a maximum and fall rapidly to 0 K at a quantum critical point doniach1 ; yang . A search for further lanthanide and actinide systems with anomalously high magnetic ordering temperatures would be of considerable interest and is underway.
Acknowledgements.
The authors would like to thank T. Matsuoka and K. Shimizu for sharing information on their high-pressure electrical resistivity techniques used in this study. Thanks are due A. Gangopadhyay for his critical reading of the manuscript. This work was supported by the National Science Foundation (NSF) through Grant No. DMR-1104742 and by the Carnegie/DOE Alliance Center (CDAC) through NNSA/DOE Grant No. DE-FC52-08NA28554. Work at Argonne National Laboratory is supported by the U.S. Department of Energy, Office of Science, under contract No. DE-AC02-06CH11357.References
- (1) J. S. Schilling, in Physics of Solids under High Pressure, J. S. Schilling and R. N. Shelton, editors (North-Holland, Amsterdam, 1981) p. 345.
- (2) H. Beidenkopf, P. Roushan, J. Seo, L. Forman, I. Drozdov, Y. S. Hor, R. J. Cava, and A. Yazdani, Nature Physics 7, 939 (2011).
- (3) P. Aynajian, E. H. S. Neto, A. Gyenis, R. E. Baumbach, J. D. Thompson, Z. Fisk, E. D. Bauer, A. Yazdani, Nature 486, 201 (2012).
- (4) D. J. Scalapino, Rev. Mod. Phys. 84, 1383 (2012).
- (5) J. S. Schilling, Mat. Res. Soc. Symp. Proc. 22, 51 (1984); ibid., Physica 139 & 140B, 369 (1986).
- (6) D. D. Jackson, V. Malba, S. T. Weir, P. A. Baker, and Y. K. Vohra, Phys. Rev. B 71, 184416 (2005).
- (7) See, for example: K. N. R. Taylor and M. I. Darby, Physics of Rare Earth Solids (Chapman and Hall Ltd., London, 1972).
- (8) D. R. Behrendt, S. Legvold, and F. H. Spedding, Phys. Rev. 109, 1544 (1958).
- (9) R. Patterson, C. K. Saw, and J. Akella, J. Appl. Phys. 95, 5443 (2004).
- (10) Material Preparation Center, Ames Lab, US DOE, Ames, Iowa http:/www. mpc.ameslab.gov.
- (11) James S. Schilling, Mat. Res. Soc. Symp. Proc. 22, 79 (1984).
- (12) K. Shimizu, K. Amaya, and N. Suzuki, J. Phys. Soc. Jpn. 74, 1345 (2005).
- (13) W. B. Daniels and W. Ryschkewitsch, Rev. Sci. Instr. 54, 115 (1983).
- (14) A. D. Chijioke, W. J. Nellis, A. Soldatov, and I. F. Silvera, J. Appl. Phys. 98, 114905 (2005).
- (15) Y. Akahama and H. Kawamura, J. Appl. Phys. 100, 043516 (2006).
- (16) N. J. Hillier and J. S. Schilling, High Press. Res. 34, 1(2014).
- (17) S. Klotz, J. S. Schilling, and P. Müller, in Frontiers of High Pressure Research, edited by H. D. Hochheimer and R. D. Etters (Plenum, New York, 1991) p. 473.
- (18) M. Debessai, J. J. Hamlin, and J. S. Schilling, Phys. Rev. B 78, 064519 (2008).
- (19) See the Supplemental Material for a detailed analysis of the measured resistivity data for Dy, including estimates of its pressure-dependent spin-disorder resistance and magnetic ordering temperature for temperatures above the experimental range to 295 K. The data for the Y and Y(1 at.% Dy) superconductors are also presented.
- (20) G. K. Samudala, G. M. Tsoi, S. T. Weir, and Y. K. Vohra, High Press. Res. DOI: 10.1080/08957959.2014.903946.
- (21) This structure is identified as orthorhombic oS8 in: Y. R. Shen, R. S. Kumar, A. L. Cornelius, M. F. Nicol, Phys. Rev. B 75, 064109 (2007).
- (22) R. V. Colvin, S. Legvold, and F. H. Spedding, Phys. Rev. 120, 741 (1960).
- (23) G. S. Fleming and S. H. Liu, Phys. Rev. B 2, 164 (1970); S. H. Liu, Phys. Rev. 127, 1889 (1962).
- (24) H. Hua, V. K. Vohra, J. Akella, S. T. Weir, R. Ahuja, and B. Johansson, Rev. High Pressure Sci. Technol. 7, 233 (1998).
- (25) J. Duthie and D. Pettifor, Phys. Rev. Lett. 38, 564 (1977).
- (26) B. T. Matthias, H. Suhl, and E. Corenzwit, Phys. Rev. Lett. 1, 92 (1958).
- (27) M. B. Maple, Appl. Phys. 9, 179 (1976).
- (28) G. Fabbris, T. Matsuoka, J. Lim, J. R. L. Mardegan, K. Shimizu, D. Haskel, and J. S. Schilling, Phys. Rev. B 88, 245103 (2013).
- (29) Z. P. Yin and W. E. Pickett, Phys. Re. B 74, 205106 (2006).
- (30) J. R. Schrieffer and P. A. Wolff, Phys. Rev. 149, 491 (1966).
- (31) S. Doniach, in Valence Instabilities and Related Narrow-Band Phenomena, edited by R. D. Parks (Plenum, New York, 1977) p. 169.
- (32) Y.-f. Yang, Z. Fisk, H-O Lee, J. D. Thompson, and D. Pines, Nature 454, 611 (2008).