Tunneling Spectroscopy Across the Superconductor-Insulator Thermal Transition
Abstract
Advances in scanning tunneling spectroscopy reveal the presence of superconducting nanoregions well past the bulk thermal transition in strongly disordered superconductors. We use a Monte Carlo tool to capture the spatially differentiated amplitude and phase fluctuations in such a material and establish spatial maps of the coherence peak as the superconductor is driven through the thermal transition. Analysis of the local density of states reveals that superconducting regions shrink and fragment with increasing temperature, but survive in small clusters to a temperature . The gap (or pseudogap) in the spectrum survives in general to another independent scale, , depending on the strength of interaction. This multiple scale description is consistent with recent measurements and defines the framework for analysing strongly disordered superconductors.
Although superconductors with -wave symmetry are robust to weak non-magnetic disorder anderson ; ag , moderate disorder can lead to large inhomogeneities in the pairing amplitude, and strong phase fluctuation between the ‘islands’ that emerge. This suppresses the transition temperature, and beyond a critical disorder the ground state becomes insulating sit-revs . While the bulk features of the superconductor-insulator transition (SIT) have been explored experimentally for several decades haviland-prl ; shahar-ovad ; escoffier-2004 ; baturina-2007 , the recent use of high resolution scanning tunneling spectroscopy (STS) sacepe-prl ; sacepe-natc ; sacepe-loc ; pratap-prl ; pratap-ph-diag ; noat ; pratap-th ; sherman-2012 has generated new questions about the superconducting state near the SIT.
The experiments allow two major advances. (i) They confirm the essentially inhomogeneous nature sacepe-prl ; sacepe-natc ; sacepe-loc ; pratap-prl ; pratap-ph-diag ; noat ; pratap-th ; sherman-2012 of the superconducting (SC) state, affirming that one does not have a homogeneous suppression of SC order with disorder and temperature. (ii) They highlight the presence of additional temperature scales in the problem, for example, a cluster formation scale, , a pseudogap formation scale, , and, at strong disorder, a possible gap formation scale - all distinct from . In addition, STS measurements quantify the detailed behaviour of the local density of states (LDOS) with disorder and increasing temperature sacepe-loc ; pratap-th ; sacepe-prl ; pratap-ph-diag ; noat ; sherman-2012 - posing a challenge for theories that address only average properties.
Addressing these issues calls for an approach that captures the increasing fragmentation in the ground state and retains the crucial phase and amplitude fluctuations that dictate thermal properties. Mean field Hartree-Fock-Bogoliubov-de-Gennes (HFBdG) theory ghosal-prb reasonably describes the ground state but ignores phase fluctuations, while quantum Monte Carlo (QMC) triv-1996 ; bouadim retains all fluctuations but lacks spatial resolution. Using an auxiliary field scheme that captures the HFBdG ground state, and the correct and critical disorder , we provide a spatially resolved description of the thermal transition and estimate the emergent scales in a strongly disordered superconductor.
Working at moderate interaction (, see later) we confirm the fragmentation of the superconducting ground state with increasing disorder, with SC islands surviving in an ‘insulating’ background. Our key results on thermal behaviour of the LDOS are the following: (i) At weak disorder increasing temperature () leads to spatially homogeneous closure of the gap at . For the gaps are lower in the SC regions than in the insulator, increasing reduces all gaps but they survive to a scale , and a pseudogap is observed to . (ii) In the weakly disordered system the coherence peak in the LDOS vanishes throughout the system at . At strong disorder it survives on isolated clusters to a scale . (iii) The scales , , etc, have distinct physical origin. We establish their variation with disorder and interaction strength. Finally, (iv) we suggest a simple lattice Ginzburg-Landau model, with parameters extracted from the electronic problem, that reasonably describes the complex thermal behaviour.
We study the attractive two dimensional Hubbard model (A2DHM) in the presence of potential scattering: with . is the nearest neighbour tunneling amplitude. is a random potential picked from a normalised flat distribution between . is the chemical potential controlling the electron density . We fix so that . is the strength of onsite attraction. We will set and measure all energies, and temperature , in units of . We set , to be close to the experimentally relevant weak coupling window.
The difficulty of the A2DHM lies in handling the interaction term. We use a decomposition dubi ; sit-transp ; bcs-bec of the interaction in terms of a pairing field, , and a density field and treat these fields as classical. This leads to the effective Hamiltonian , where and . We solve the coupled fermion-auxiliary field problem through a Monte Carlo dubi ; dag ; tca . At finite this allows us to consider electron propagation in an amplitude and phase fluctuating background, affording a dramatic improvement in the handling of thermal physics. We have discussed the method in detail elsewhere sit-transp ; bcs-bec so we move on to the results.
The ‘clean ’ at is . Increasing disorder pushes our below measurement resolution () at . We set this as vc-footnote . Based on the bulk transport and spectral properties, we characterise sit-transp as ‘weak’ disorder, as intermediate, and as strong disorder. The weak disorder regime is characterised by a featureless DOS and metallic transport for , intermediate disorder involves a pseudogap (PG) for and a thermal crossover from insulating to metallic resistivity, while strong disorder involves a hard gap over a window and activated transport at high .
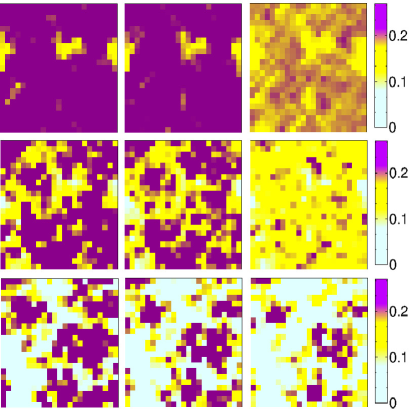
Fig.1 presents a summary of the thermal evolution of the coherence peak map at weak, moderate, and strong disorder. Our data shows the integrated tunneling conductance (TC) over the window , defined by , where is the local density of states at site . and are chosen so that they cover the coherence peaks in the global density of state, and hence gives information about the local phase correlations in the system.
We make the following observations: (a) At weak disorder the pattern remains almost homogeneous at all , except for a few isolated regions. Coherence peaks get suppressed with increasing temperature, and vanish by . (b) At intermediate disorder the ground state is noticeably inhomogeneous and increasing causes further fragmentation. However, by the time hardly any coherence peaks are visible anywhere. (c) The high disorder regime shows tenuously connected clusters at , which shrink as is increased, but have a prominently visible but disconnected pattern at . In fact at the clusters are visible to . The ‘cluster survival scale’ at is and drops slowly with increasing disorder.
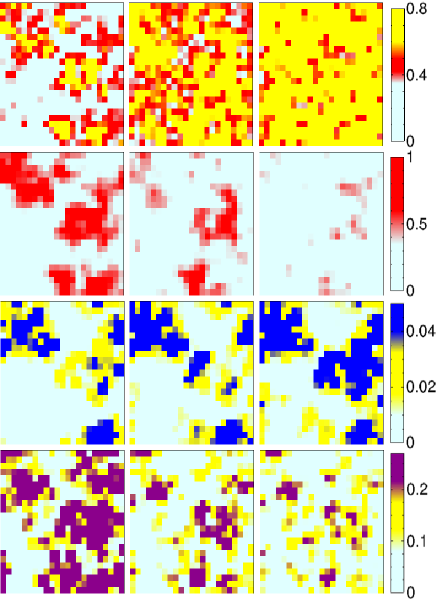
Fig.2 shows spatial maps of the pairing field and the tunneling conductance, averaged over 100 thermal configurations, at strong disorder () for a single realisation of disorder. The Supplement shows results at weaker disorder. The top row shows , normalised by the clean value . Next row: nearest neighbour averaged phase correlation , where refer to the four nearest neighbours of a site. Third row: , the local tunneling conductance probed at subgap frequencies. Fourth row: . We set . Columns, left to right, correspond to .
Let us start with the patterns at , left column. (a). We see a clear separation between regions where , and where . While there is significant variation in magnitude within the larger regions, the distinction between large and small regions is unambiguous. (b). The large regions are phase correlated: is large in regions where is large. These regions are the SC clusters. (c). shows that the large phase correlated regions have large subgap TC, while regions with poor SC correlation have virtually zero TC. This suggests a smaller local gap in the SC clusters, as we will confirm later, and a larger gap in the non SC regions. The behaviour is in contrast to homogeneous systems where larger would have meant a larger gap and a smaller TC. (d). The map for shows that the SC clusters in the ground state have a modest coherence peak, while there is no CP in the larger gap non SC regions. Overall, at the non SC regions have no noticeable spectral weight from to frequencies well beyond the average CP location.
Now the thermal evolution. By , middle column, we observe the following. (a) There is significant homogenisation of . Non SC regions generate a strikingly large while the SC clusters see a more modest growth from the value. Temperature leads to strong spatially differentiated amplitude fluctuation in the system. (b) shows thermal shrinking of the correlated regions. It is still large in parts of the regions which had the large at . The clusters are internally correlated but disconnected. The independent fluctuation of the phase of the different clusters leads to loss of global SC order. (c) There is no noticeable change in with for regions that were non SC at . For SC regions there is an increase in intensity. (d) For , as we have already seen in Fig.1, areas with strong CP feature shrink but are still clearly visible. Non SC regions do not respond to temperature.
By , 3rd column, (a) the mean magnitude has homogenised, with traces of clustering apparently lost, and (b) is virtually zero everywhere. The homogenisation of amplitude and phase variables may suggest that any imprint of the cluster pattern would be lost. However, (c) the subgap TC is still very inhomogeneous, but now uniformly large over regions that were SC at . So, even at this “high temperature” the subgap TC reveals the granularity of the ground state. Finally, (d) the high intensity regions in shrink and the pattern tends towards a homogeneous intermediate intensity with only small remnants of the high CP regions.
We have observed that at weaker disorder the correspondence of with the background superconducting pattern weakens. The data at in the Supplement show that there is no clear correspondence between and the correlated regions. , however, continues to roughly track the superconducting order, both in the ground state and at finite , down to low disorder.
Fig.3 quantifies the distributions, and , of gap magnitude and coherence peak integral, respectively, across the system. The results are for and , and . At the has a mean at , with a narrow width around it. With increasing the mean ‘gap’ shifts to lower values while the width shows a small increase. This suggests a homogeneous decrease throughout the system. At is wide at with a large gap tail arising from sites with large positive or negative effective potential (we call these hill and valley sites). Increasing leads to shift in weight to lower from intermediate values while at large remains unaffected.
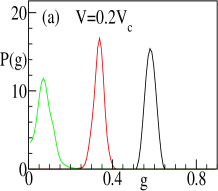
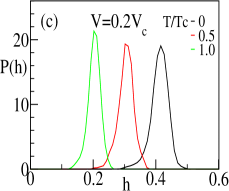
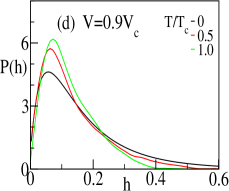
Coming to , panel (c) shows that the coherence peak distribution is also roughly uniform at at all . The peak at at narrows slightly and moves to lower values at higher but the mean remains finite since we have not subtracted the high background. At , however, most sites have poor coherence features, defining the trunk of the distribution, except for the tail with arising from sites in the superconducting clusters. With increasing as the SC regions shrink the weight in this region is lost.
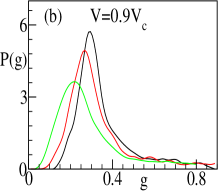
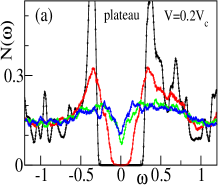
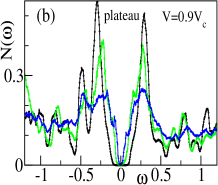
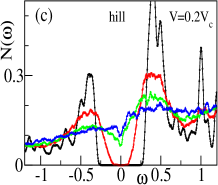
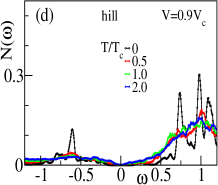
Fig.4 correlates the low energy features of local gap and coherence peak to spectral weight distribution over a wider frequency window. We plot the LDOS at two representative sites (‘plateau’ and ‘hill’) at low and high disorder. The plateau site involves an effective potential close to the mean value, and a local density close to the average, , while the hill site has a large positive effective potential and . At low disorder, Fig.4(a)-(b), both sites show coherence peaks and similar gaps, with the hill site naturally having larger weight at . The thermal evolution is also similar, with both gaps decreasing and closing at .
At high disorder, Fig.4(c)-(d), the LDOS at the plateau site (part of a SC cluster) shows a narrow gap at low , moderate coherence peaks, and expected thermal behaviour. The hill site, by contrast, shows a large gap (strongly suppressed low frequency spectral weight), no coherence peaks, and is virtually insensitive to .
We now discuss the multiple scales that emerge in the strongly disordered superconductor, and the relevance of our results to recent STS measurements.
(i) Multiple scales: In the clean limit, weak coupling SC is characterised by only one scale, , while strong coupling brings into play two additional scales scales and . This paper focuses on the weak coupling end where there is no gap/PG above at but disorder generates such scales. These scales emerge due to the fragmentation of the SC ground state with increasing disorder (the nature of the patterns is discussed in the Supplement, and also ghosal-prb ). The inhomogeneous state leads to a spatially varying phase and amplitude stiffness, whose distribution and spatial correlation dictates the thermal response.
The Supplement describes how a bond resolved phase stiffness, , can be extracted from the non local pairing susceptibility in the disordered ground state. Focusing on nearest neighbour bonds, at small the are ‘large’, homogeneous, and , the clean value. At large they are strongly inhomogeneous, with a smaller mean value . While (on the percolative backbone) decides , the presence of bonds with , near the center of the SC clusters, leads to survival of local SC correlations to as . The Supplement shows plots of the distribution and a spatial map of at stong disorder.
Although phase fluctuations destroy global order, the survive to . At this sustains a gap to and then a PG to a scale , ultimately closing due to amplitude fluctuations. The Supplement shows these scales at , and also to allow extrapolation over a wider interaction window. At , while as , remains roughly constant at , as does . is much larger than these scales. At , so their coincidence at is accidental. Extrapolating downward we expect that when , will continue to be a finite fraction of , with .
Comparison with experiments: Our main results, i.e, the emergence of a , , etc, in addition to , the shrinkage and fragmentation of the SC pattern with increasing temperature, and the distinct thermal evolution of the STS spectra in the SC and insulating regions, are all in agreement with recent experiments. However, there are also important differences, arising from (i) our parameter choice, (ii) our approximation, and (iii) the neglect of Coulomb interactions. (i) Experimental spectra indicates a pseudogap pratap-ph-diag , rather than a hard gap above for . Our exploration of the dependence suggests that at weaker coupling such a result would emerge from our method as well. Another effect of the relatively ‘large’ coupling that we use is the larger variation of local gaps between the SC and insulating regions, experimentally these gaps are comparable sacepe-loc . (ii) The neglect of quantum fluctuations in our treatment of the A2DHM prevents access to the correct asymptotic low temperature behaviour for . However, apart from the immediate vicinity of the thermal fluctuations seem to capture most of the qualitative experimental features. (iii) The recent observation pratap-th of enhanced zero-bias conductance in the insulating regions is probably caused by additional interactions that are absent in our model. Also, the broad V-shaped background observed in the STS spectra possibly arises from Coulomb interactions, and is absent in our results.
Conclusions: We have studied the spatial signatures of the thermal transition in a disordered s-wave superconductor as probed by tunneling spectroscopy. Our detailed spatial maps of the coherence and subgap features in the local DOS allow us to identify the distinct evolution of the superconducting and ‘insulating’ regions with temperature. We point out new thermal scales, , and that come into existence at strong disorder, identify their physical origin, and quantify their dependence on disorder and interaction strength. Recent experiments have already indicated the existence of such scales in 2D films, our results provide the broader framework within which these results can be analysed.
Acknowledgments: We acknowledge use of the High Performance Computing Cluster at HRI. PM acknowledges support from a DAE-SRC Outstanding Research Investigator Award, and the DST India (Athena). We thank Amit Ghosal and P. Raychaudhuri for discussions.
References
- (1) P. W. Anderson, J. Phys. Chem. Solids 11, 26 195921
- (2) A. A. Abrikosov and L. P. Gorkov, Zh. Eksp. Teor. Fiz. 36, 319 (1959)
- (3) For reviews, see A. M. Goldman and N. Markovic, Phys. Today 51, No 11, 39 (1998), D. Belitz and T. Kirkpatrick, Rev. Mod. Phys. 66, 261 (1994), M. V. Sadovskii, Phys. Rep. 282, 225 (1997), V. F. Gantmakher and V. T. Dolgopolov, Phys. Usp. 53, 3-53 (2010).
- (4) D. B. Haviland, Y. Liu and A. M. Goldman, Phys. Rev. Lett. 62, 2180 (1989).
- (5) D. Shahar and Z. Ovadyahu, Phys. Rev. B 46, 10917 (1992).
- (6) W. Escoffier, et al., Phys. Rev. Lett. 93, 217005 (2004).
- (7) T. I. Baturina, et al., Phys. Rev. Lett. 99, 257003 (2007).
- (8) B. Sacepe, et al., Phys. Rev. Lett. 101, 157006 (2008).
- (9) B. Sacepe, et al., Nature Commun. 1, 140 (2010).
- (10) B. Sacepe, et al., Nature Phys. 7, 239 (2011).
- (11) M. Mondal, et al., Phys. Rev. Lett. 106, 047001 (2011).
- (12) M. Chand, et al., Phys. Rev. B 85, 014503 (2012).
- (13) Y. Noat, et al., arXiv:1205.3408.
- (14) A. Kamlapure, et al., Sci. Rep. 3, 2979 (2013)
- (15) D. Sherman, et al., Phys. Rev. Lett. 108, 177006 (2012).
- (16) A. Ghosal, M. Randeria and N. Trivedi, Phy. Rev. B 65, 014501 (2001)
- (17) N. Trivedi, R. T. Scalettar and M. Randeria, Phys. Rev. B 54, 3756 (1996).
- (18) K. Bouadim, Y. L. Loh, M. Randeria and N. Trivedi, Nat. Phys. 7, 884 (2011)
- (19) Y. Dubi, Y. Meir and Y. Avishai, Nature, 449, 876 (2007).
- (20) M. Mayr, G. Alvarez, C.Sen and E.Dagotto, Phys. Rev. Lett. 94, 217001 (2005).
- (21) S. Kumar and P. Majumdar, Eur. Phys. J. B, 50, 571 (2006).
- (22) S. Tarat and P. Majumdar, Europhys. Lett. 105 (2014) 67002.
- (23) S. Tarat and P. Majumdar, arXiv:1402.0817.
- (24) There is no SIT in the ground state strictly within HFBdG theory. However at any finite phase fluctuations lead to a finite . Our is an extrapolation of this quantity sit-transp .
- (25) Note that unlike , the gap and pseudogap vanishing scales are more ambiguous, particularly the later. Nevertheless, they are useful constructs, and at least in the present case can be reasonably estimated.