Existence of a Thermodynamic Spin-Glass Phase in the
Zero-Concentration Limit of Anisotropic Dipolar Systems
Abstract
The nature of ordering in dilute dipolar interacting systems dates back to the work of Debye and is one of the most basic, oldest and as-of-yet unsettled problems in magnetism. While spin-glass order is readily observed in several RKKY-interacting systems, dipolar spin-glasses are the subject of controversy and ongoing scrutiny, e.g., in , a rare-earth randomly diluted uniaxial (Ising) dipolar system. In particular, it is unclear if the spin-glass phase in these paradigmatic materials persists in the limit of zero concentration or not. We study an effective model of using large-scale Monte Carlo simulations that combine parallel tempering with a special cluster algorithm tailored to overcome the numerical difficulties that occur at extreme dilutions. We find a paramagnetic to spin-glass phase transition for all ion concentrations down to the smallest concentration numerically accessible, 0.1%, and including ion concentrations that coincide with those studied experimentally up to 16.7%. Our results suggest that randomly diluted dipolar Ising systems have a spin-glass phase in the limit of vanishing dipole concentration, with a critical temperature vanishing linearly with concentration. The agreement of our results with mean-field theory testifies to the irrelevance of fluctuations in interactions strengths, albeit being strong at small concentrations, to the nature of the low-temperature phase and the functional form of the critical temperature of dilute anisotropic dipolar systems. Deviations from linearity in experimental results at the lowest concentrations are discussed.
pacs:
75.50.Lk, 75.40.Mg, 05.50.+q, 64.60.-iI Introduction
Dipolar interactions are ubiquitous in nature and often dominate other types of interactions in many simple systems, e.g., in insulating magnets. Additionally, dipolar-like couplings may also arise between defect states in crystals, where these are mediated by the phonon vacuum. Such interactions are known to induce magnetic and ferroic order in densely packed solids and liquids Luttinger and Tisza (1946); Vugmeister and Glinchuk (1990). With dilution, the competing nature of the interaction and spatial disorder lead to a spin-glass (SG) order Binder and Young (1986) at low temperatures. Mean-field theory suggests that the SG order is maintained at , with the critical temperature being linear in the concentration Stephen and Aharony (1981); Xu et al. (1991). However, at low concentrations, spatial inhomogeneities are large and could dominate the characteristics of the system. Because the dipolar nature of the interaction renders standard spatial renormalization group methods ineffective, rigorous analytic conclusions are currently beyond reach. Thus, the nature of anisotropic dipolar systems in general, and in the limit of low concentrations in particular, has been a long-standing controversy.
Experimentally, is perhaps the best-studied dilute dipolar (strongly anisotropic) Ising system. This rare-earth compound has attracted vast experimental, numerical and theoretical interest in the past two decades. Its scrutinization has enhanced the understanding of many different magnetic phenomena, such as quantum phase transitions Bitko et al. (1996); Ronnow et al. (2005); Schechter and Stamp (2005), large spin tunneling Giraud et al. (2001, 2003); Pollack and Schechter (2014), quantum annealing Brooke et al. (1999), quantum entanglement Ghosh et al. (2003), quantum domain-wall tunneling Brooke et al. (2001), random-field physics Schechter and Laflorencie (2006); Tabei et al. (2006); Schechter (2008); Silevitch et al. (2007a) and generic disordering mechanisms Andresen et al. (2013). Thus, establishing the low-temperature phase of at small concentrations is not only of fundamental interest, but is crucial for the further study of its characteristics. However, extremely long equilibration times have produced conflicting experimental results and a strong dependence on the used experimental protocol, with no clear evidence for the equilibrium phase of the system at low concentrations Reich et al. (1987); Ghosh et al. (2002, 2003); Jönsson et al. (2007); Silevitch et al. (2007b); Quilliam et al. (2008, 2012); Schmidt et al. (2014). Furthermore, where experimental data suggest the existence of a spin-glass phase, reported values for the critical temperature deviate markedly at low concentrations from the expected linear dependence on the Ho concentration Quilliam et al. (2012).
Numerically, understanding the nature of dipolar Ising systems at small concentrations is notoriously difficult, because spatial inhomogeneities are large and so are the required system sizes. Previous Monte Carlo simulations of the dilute dipolar Ising spin-glass model Ayton et al. (1997); Snider and Yu (2005); Biltmo and Henelius (2007, 2008) showed no sign of a SG transition. More recent simulations where a better observable, namely, the finite-size two-point correlation function Ballesteros et al. (2000), was used suggest the existence of a SG phase down to a concentration of Tam and Gingras (2009). However, the regime of much theoretical interest, where the typical distance between spins is much larger than interatomic distance, and thus fluctuations are large, could not be reached. Long equilibration times due to the slow dynamics of the system Biltmo and Henelius (2012) limited the studied system sizes and concentrations, i.e., strong finite-size corrections in the data. As such, the nature of anisotropic dipolar systems at very low concentrations remains unclear.
Here, we present conclusive evidence for the existence of a SG phase in the dilute dipolar Ising model in the limit of , and for for all experimentally relevant low concentrations. We use large-scale Monte Carlo simulations that combine parallel tempering Hukushima and Nemoto (1996) and a cluster algorithm Janzen et al. (2008); Andresen et al. (2011) that allows us to efficiently handle the atypically large interactions stemming from rare nearby groups of spins and, at the same time, leaves the prevalent typical interactions for standard numerical treatment. We find clear evidence that the anisotropic dipolar glass has a SG phase at low temperatures for all studied concentrations down to (almost 2 orders of magnitude smaller than the concentration reached in previous studies), with a critical temperature that is linear in the concentration . Furthermore, our data show that for all , the divergence of the correlation length at the transition is likely described by the same critical exponent . This strongly suggests that our results can be carried through to vanishing spin concentrations.
II Model and Numerical Details
The tunnel splitting induced between the two polarized electronuclear single Ho ground states in the dilute system by the crystal field and by the off-diagonal terms of the dipolar interaction is much smaller than the typical interaction down to extremely low Ho concentrations Schechter and Stamp (2008). The same is true for the magnetic interaction between the nuclear spins of the F atoms. Thus, down to very low , is well described by a classical Ising spin model Tam and Gingras (2009); Biltmo and Henelius (2012); Quilliam et al. (2012); Andresen et al. (2013), i.e.,
| (1) |
Here is the occupation of the magnetic ions on a tetragonal lattice (lattice constants Å and Å) with four ions per unit cell Biltmo and Henelius (2009); Tam and Gingras (2009), i.e., spin sites. are Ising spins. The magnetostatic dipolar coupling between two ions is given by , where , is the position of the -th ion and is the component parallel to the easy axis. The dipolar constant is K, Biltmo and Henelius (2007) and the antiferromagnetic nearest-neighbor exchange is set to K Biltmo and Henelius (2009). For the low concentrations of interest to us here, this model is equivalent to the pure Ising dipolar model, because the exchange interactions only slightly change the interaction strength of the rare nearby pairs, which, as we show below, do not affect the thermodynamics at and near the phase transition.
To determine the finite-temperature transition for a given value of , we measure the two-point finite-size correlation function Ballesteros et al. (2000)
| (2) |
where
| (3) |
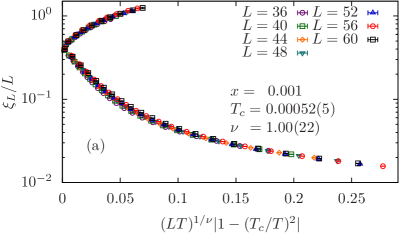
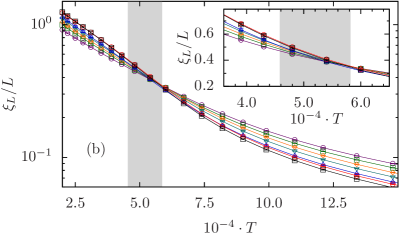
Here, represents a thermal average, is the spatial location of the spin , and represents the smallest nonzero wave vector in the - or -axis direction, or , respectively. is dimensionless, and near the transition, it is expected to scale as . Because corrections to scaling are typically large for highly dilute systems, we use an extended scaling approach Campbell et al. (2006) that has proven to reduce scaling corrections and where ; see Fig. 1(a). When , the argument of the scaling function is zero (up to scaling corrections) and hence independent of . As such, lines for different system sizes cross [see Fig. 1(b)]. If, however, the lines do not meet, we know that no transition occurs in the studied temperature range. The best estimate of the critical temperature is determined by applying a Levenberg-Marquardt minimization combined with a bootstrap analysis to determine statistical error bars Katzgraber et al. (2006) to the aforementioned extended finite-size scaling analysis. An example of the resulting data collapse using the minimization is shown in Fig. 1(a) for .
Finally, we note that in Ref. Tam and Gingras (2009) it was observed that the estimates of along the axis tend to be systematically lower than the ones computed along the axis of the material. A comparison with experimental results Quilliam et al. (2012) showed an agreement between the experimental estimates and the numerical estimates along the axis only. Similarly, in this work, our estimates of the transition temperatures from a paramagnetic (PM) phase to a SG phase computed along the axis tend to be systematically higher for all studied dilutions and agree better with the experimental results of Quilliam et al. Quilliam et al. (2012). As such, all quoted results stem from simulation results with measurements along the axis.
In the simulations, we use the Ewald summation method without a demagnetization factor to compute the periodic boundary conditions Tam and Gingras (2009); Wang and Holm (2001) for systems of up to approximately lattice sites. To equilibrate the system at extreme dilutions, we use a combination of single spin-flip Monte Carlo dynamics and a cluster renormalization algorithm Janzen et al. (2008); Andresen et al. (2011) combined with parallel tempering Monte Carlo Hukushima and Nemoto (1996). The cluster renormalization algorithm is tailored to treat strongly coupled spins efficiently. It does not fully obey detailed balance; however, it has been successfully applied to different model systems com . The cluster renormalization technique works as follows: At the beginning of the simulation, set the random positions of the spins and search for clusters of spins coupled by an interaction of at least . Once all clusters have been labeled and recorded, search for sets of spins coupled by at least and record these. Iteratively perform this renormalization , , …, times until all the sets of consist of only spin pairs. It is very important to carefully tune the renormalization procedure to the studied model. In this case, we use , where is the concentration of the magnetic ions in the system. A suitable step value is . Spins in clusters are then flipped, regardless of their sign. Note that one Monte Carlo sweep in the simulation thus consists of the following procedure: For each spin in the system, we either perform a single-spin simple Monte Carlo flip with probability , or we flip a randomly selected cluster.
Finally, to verify that the data are properly thermalized, a logarithmic binning analysis is used: Observables are measured and averaged over an exponentially growing number of Monte Carlos sweeps , and their Monte Carlo time evolution is monitored. When at least three bins agree within error bars and are independent of Monte Carlo time, we deem the system to be in thermal equilibrium. Simulation parameters are listed in Table 1.
III Results
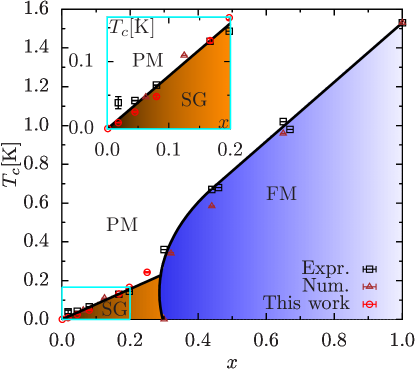
Our main result is shown in the phase diagram depicted in Fig. 2, as well as Table 2. The estimated critical temperatures show a clear linear behavior for 2 orders of magnitude, strongly suggesting that the SG phase extends to the zero concentration limit. Comparison to experiment shows that for , we find , in excellent agreement with the experimental results of Wu et al. (1991). Similarly, for , we find , close to the most recent experimental result, Quilliam et al. (2012). For lower concentrations, however, we find values of which agree well with the linear extrapolation of the experimental data from higher but are lower than the experimentally obtained values for and . We attribute this discrepancy to the microscopic time scale in being very long at low temperatures and enhanced with the decrease of the Ho concentration. This results in the difficulty to equilibrate the system close to the critical temperature at the lowest experimentally studied concentrations Quilliam et al. (2012); Schmidt et al. (2014). Furthermore, it was argued that long equilibration times of small clusters lead to a quantum nonequilibrium state, whose nature depends on the degree of coupling to the environment Schmidt et al. (2014).
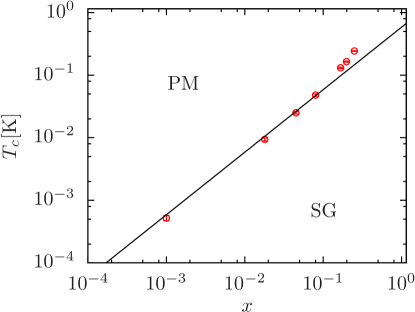
In Fig. 3, we show a log-log plot of the high-dilution limit of the transition temperature versus concentration phase diagram shown in the inset to Fig. 2. The solid line in the figure that separates the SG from the PM phase is a fit to with . Allowing for a finite intercept, i.e., , yields and , which is statistically compatible with a zero intercept. Therefore, we see strong evidence that the spin-glass phase extends to the limit.
We note that despite the much-enhanced fluctuations in the distribution of interactions as is reduced, equilibration times are similar for all system sizes. The simulations for the lowest concentration were limited by the time it takes to accurately compute the Ewald summation used to account for the periodic boundary conditions, and not the Monte Carlo simulation time, therefore showing the effectiveness of the implemented algorithm even for very high dilutions. This bottleneck is in fact much easier to overcome because the Ewald summation has to be performed only once for each system size at the beginning of the simulation.
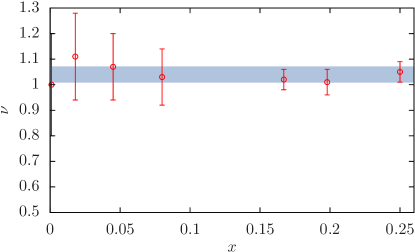
In Fig. 4, we show the critical exponent as a function of computed from a finite-size scaling of the two-point correlation function. For all concentrations depicted, data seem to agree approximately within error bars—an indicator for potential universal behavior. All critical parameters from the scaling analysis of the two-point correlation function are listed in Table 2. Note, however, that to fully characterize a universality class, it is necessary to determine at least two critical exponents. We tried different analysis methods to extract a second critical exponent from the spin-glass susceptibility. However, no robust estimate was possible, a common problem in spin-glass simulations (see also Ref. Katzgraber et al. (2006)).
IV Discussion
Dilute power-law interacting systems are natural candidates for emergent geometric similarity Cederberg (2001) whereby statistical mechanics of systems at different concentrations may be mapped onto each other Larkin and Khmelnitsky (1970). The characteristic falloff of the dipolar kernel implies linear scaling of typical interactions with concentration in any dimension and suggests similar scaling of relevant temperature scales. However, dipolar systems at different concentrations are not quite geometrically similar. Rescaling of the interactions leaves the distribution of interactions practically unchanged at low and typical values but generates a progressively stronger tail at high values, because the largest coupling is fixed by the lattice spacing, independent of the concentration. These large couplings produce physical correlation effects that impeded simulation progress in the past. Remarkably, focusing on and solving this relatively local high-energy bottleneck allows for essentially unimpeded progress on the rest of the problem. Our results provide strong support to the notion of emergent geometric similarity by locating and characterizing the spin-glass ordering transition over nearly 2 orders of magnitude in concentration, with the transition temperature scaling linearly with concentration.
We note here that this geometric similarity is destroyed by the application of a transverse field Schechter and Stamp (2009), which, in combination with the off-diagonal elements of the dipolar interaction, results in effective random fields in the longitudinal direction Schechter and Laflorencie (2006); Tabei et al. (2006); Schechter (2008). The emergent longitudinal fields have a large variance, are correlated with the interactions, and lead to a much more effective disordering of the spin-glass phase Schechter and Stamp (2009) than that predicted by the naive application of the Imry-Ma argument Imry and Ma (1975); Fisher and Huse (1986). We emphasize that in the absence of an applied field, the effect of the off-diagonal dipolar terms on the thermodynamic phase of the system is negligible. The quantum fluctuations induced by these is much smaller than the interaction, and they do not change the time-reversal symmetry (spin inversion) of the Hamiltonian.
Summarizing, using large-scale Monte Carlo simulations that combine parallel tempering with an innovative cluster renormalization algorithm Janzen et al. (2008); Andresen et al. (2011), we have shown that the dilute dipolar Ising model has a spin-glass transition at low temperatures for concentrations down to . Furthermore, a clear linear behavior of is found in the highly dilute regime, strongly suggesting that the SG phase transition extends to the limit.
Acknowledgements.
We are grateful to A. Aharony, B. Barbara, M. Gingras, S. Girvin, D. Huse, J. Kycia, D. Sherrington, and D. Silevitch for enlightening discussions. H.G.K. acknowledges support from the NSF (Grant No. DMR-1151387), thanks Hitachino Nest for inspiration, and would like to thank the Santa Fe Institute for their hospitality. V.O. acknowledges support from the NSF (Grant No. DMR-0955714). M.S. acknowledges support from the Marie Curie Grant No. PIRG-GA-2009-256313 and from the ISF Grant No. 821/14. We thank the Texas Advanced Computing Center (TACC) at The University of Texas at Austin for providing HPC resources (Stampede Cluster), ETH Zurich for CPU time on the Brutus cluster, and Texas A&M University for access to their Eos and Lonestar clusters.References
- Luttinger and Tisza (1946) J. M. Luttinger and L. Tisza, Theory of dipole interaction in crystals, Phys. Rev. 70, 954 (1946).
- Vugmeister and Glinchuk (1990) B. E. Vugmeister and M. D. Glinchuk, Dipole glass and ferroelectricity in random-site electric dipole systems, Rev. Mod. Phys. 62, 993 (1990).
- Binder and Young (1986) K. Binder and A. P. Young, Spin glasses: Experimental facts, theoretical concepts and open questions, Rev. Mod. Phys. 58, 801 (1986).
- Stephen and Aharony (1981) M. J. Stephen and A. Aharony, Percolation with long-range interactions, J. Phys. C 14, 1665 (1981).
- Xu et al. (1991) H. J. Xu, B. Bergersen, F. Niedermayer, and Z. Racz, Ordering of Ising dipoles, J. Phys.: Condens. Matter 3, 4999 (1991).
- Bitko et al. (1996) D. Bitko, T. F. Rosenbaum, and G. Aeppli, Quantum Critical Behavior for a Model Magnet, Phys. Rev. Lett. 77, 940 (1996).
- Ronnow et al. (2005) H. M. Ronnow, R. Parthasarathy, J. J., G. Aeppli, T. F. Rosenbaum, and D. F. McMorrow, Quantum Phase Transition of a Magnet in a Spin Bath, Science 308, 389 (2005).
- Schechter and Stamp (2005) M. Schechter and P. C. E. Stamp, Significance of the Hyperfine Interactions in the Phase Diagram of , Phys. Rev. Lett. 95, 267208 (2005).
- Giraud et al. (2001) R. Giraud, W. Wernsdorfer, A. M. Tkachuk, D. Mailly, and B. Barbara, Nuclear spin driven quantum relaxation in LiY0.998Ho0.002F4, Phys. Rev. Lett. 87, 057203 (2001).
- Giraud et al. (2003) R. Giraud, A. M. Tkachuk, and B. Barbara, Quantum dynamics of atomic magnets: cotunneling and dipolar-based tunneling, Phys. Rev. Lett. 91, 257204 (2003).
- Pollack and Schechter (2014) Y. Pollack and M. Schechter, Proposal for direct measurement of random fields in the LiHox1-Xf4 crystal, Phys. Rev. B 89, 064414 (2014).
- Brooke et al. (1999) J. Brooke, D. Bitko, T. F. Rosenbaum, and G. Aepli, Quantum annealing of a disordered magnet, Science 284, 779 (1999).
- Ghosh et al. (2003) S. Ghosh, T. F. Rosenbaum, G. Aeppli, and S. N. Coppersmith, Entangled quantum state of magnetic dipoles, Nature 425, 48 (2003).
- Brooke et al. (2001) J. Brooke, T. F. Rosenbaum, and G. Aepli, Tunable quantum tunneling of magnetic domain walls, Nature 413, 610 (2001).
- Schechter and Laflorencie (2006) M. Schechter and N. Laflorencie, Quantum Spin Glass and the Dipolar Interaction, Phys. Rev. Lett. 97, 137204 (2006).
- Tabei et al. (2006) S. M. A. Tabei, M. J. P. Gingras, Y.-J. Kao, P. Stasiak, and J.-Y. Fortin, Induced Random Fields in the LiHoxY1-xF4 Quantum Ising Magnet in a Transverse Magnetic Field, Phys. Rev. Lett. 97, 237203 (2006).
- Schechter (2008) M. Schechter, as a random-field Ising ferromagnet, Phys. Rev. B 77, 020401(R) (2008).
- Silevitch et al. (2007a) D. M. Silevitch, D. Bitko, J. Brooke, S. Ghosh, G. Aeppli, and T. F. Rosenbaum, A ferromagnet in a continuously tunable random field, Nature 448, 567 (2007a).
- Andresen et al. (2013) J. C. Andresen, C. K. Thomas, H. G. Katzgraber, and M. Schechter, Novel disordering mechanism in ferromagnetic systems with competing interactions, Phys. Rev. Lett. 111, 177202 (2013).
- Reich et al. (1987) D. H. Reich, T. F. Rosenbaum, and G. Aeppli, Glassy relaxation without freezing in a random dipolar-coupled Ising magnet, Phys. Rev. Lett. 59, 1969 (1987).
- Ghosh et al. (2002) S. Ghosh, R. Parthasarathy, T. F. Rosenbaum, and G. Aeppli, Coherent Spin Oscillations in a Disordered Magnet, Science 296, 2195 (2002).
- Jönsson et al. (2007) P. E. Jönsson, R. Mathieu, W. Wernsdorfer, A. M. Tkachuk, and B. Barbara, Absence of Conventional Spin-Glass Transition in the Ising Dipolar System , Phys. Rev. Lett. 98, 256403 (2007).
- Silevitch et al. (2007b) D. M. Silevitch, C. M. S. Gannarelli, A. J. Fisher, G. Aeppli, and T. F. Rosenbaum, Quantum Projection in an Ising Spin Liquid, Phys. Rev. Lett. 99, 057203 (2007b).
- Quilliam et al. (2008) J. A. Quilliam, S. Meng, C. G. A. Mugford, and J. B. Kycia, Evidence of spin glass dynamics in dilute LiHox1-Xf4, Phys. Rev. Lett. 101, 187204 (2008).
- Quilliam et al. (2012) J. A. Quilliam, S. Meng, and J. B. Kycia, Experimental phase diagram and dynamics of a dilute dipolar-coupled Ising system, Phys. Rev. B 85, 184415 (2012).
- Schmidt et al. (2014) M. A. Schmidt, D. M. Silevitch, G. Aeppli, and T. F. Rosenbaum, Using thermal boundary conditions to engineer the quantum state of a bulk magnet, Proc. Natl. Acad. Sci. U.S.A. 111, 3689 (2014).
- Campbell et al. (2006) I. A. Campbell, K. Hukushima, and H. Takayama, An Extended Scaling Scheme for Critically Divergent Quantities, Phys. Rev. Lett. 97, 117202 (2006).
- Katzgraber et al. (2006) H. G. Katzgraber, M. Körner, and A. P. Young, Universality in three-dimensional Ising spin glasses: A Monte Carlo study, Phys. Rev. B 73, 224432 (2006).
- Ayton et al. (1997) G. Ayton, M. Gingras, and G. Patey, Ferroelectric and dipolar glass phases of noncrystalline systems, Phys. Rev. E 56, 562 (1997).
- Snider and Yu (2005) J. Snider and C. C. Yu, Absence of dipole glass transition for randomly dilute classical Ising dipoles, Phys. Rev. B 72, 214203 (2005).
- Biltmo and Henelius (2007) A. Biltmo and P. Henelius, Phase diagram of the dilute magnet LiHoxY1-xF4, Phys. Rev. B 76, 054423 (2007).
- Biltmo and Henelius (2008) A. Biltmo and P. Henelius, Low-temperature properties of the dilute dipolar magnet LiHoxY1-xF4, Phys. Rev. B 78, 054437 (2008).
- Ballesteros et al. (2000) H. G. Ballesteros, A. Cruz, L. A. Fernandez, V. Martin-Mayor, J. Pech, J. J. Ruiz-Lorenzo, A. Tarancon, P. Tellez, C. L. Ullod, and C. Ungil, Critical behavior of the three-dimensional Ising spin glass, Phys. Rev. B 62, 14237 (2000).
- Tam and Gingras (2009) K.-M. Tam and M. J. P. Gingras, Spin-Glass Transition at Nonzero Temperature in a Disordered Dipolar Ising System: The Case of LiHoxY1-xF4, Phys. Rev. Lett. 103, 087202 (2009).
- Biltmo and Henelius (2012) A. Biltmo and P. Henelius, Unreachable glass transition in dilute dipolar magnet, Nature Communications 3, 857 (2012).
- Hukushima and Nemoto (1996) K. Hukushima and K. Nemoto, Exchange Monte Carlo method and application to spin glass simulations, J. Phys. Soc. Jpn. 65, 1604 (1996).
- Janzen et al. (2008) K. Janzen, A. K. Hartmann, and A. Engel, Replica theory for Levy spin glasses, J. Stat. Mech. P04006 (2008).
- Andresen et al. (2011) J. C. Andresen, K. Janzen, and H. G. Katzgraber, Critical behavior and universality in Levy spin glasses, Phys. Rev. B 83, 174427 (2011).
- Schechter and Stamp (2008) M. Schechter and P. C. E. Stamp, The low- phase diagram of , Phys. Rev. B 78, 054438 (2008).
- Biltmo and Henelius (2009) A. Biltmo and P. Henelius, The ferromagnetic transition and domain structure in LiHoxY1-xF4, Europhys. Lett. 87, 27007 (2009).
- Wang and Holm (2001) Z. Wang and C. Holm, Estimate of the cutoff errors in the Ewald summation for dipolar systems, J. Chem. Phys. 115, 6351 (2001).
- (42) The cluster algorithm used in our work was introduced by Janzen et al. Janzen et al. (2008) to overcome the large thermalization times of mean-field spin glasses with bonds drawn from a fat-tailed Levy distribution. Subsequently, we applied the method to a three-dimensional system with Levy bonds to see if strong fat-tailed interaction distributions affect universality in spin glasses Andresen et al. (2011). In Ref. Andresen et al., 2011, we performed a very careful comparison of our results for the energy, spin-overlap, and two-point correlation length using either simple Monte Carlo with parallel tempering or simple Monte Carlo with parallel tempering including the cluster moves. In the regime where the numerical effort was not exorbitant (not-too-strong bonds, i.e., close to a Gaussian), both methods delivered results indistinguishable within statistical errors. Furthermore, we verified the correctness of our results for dilute dipolar magnets by reproducing the results for concentrations of % and % with and without the cluster algorithm. Finally, we also compared our results directly to the published results of Tam and Gingras Tam and Gingras (2009) and found perfect agreement. One might, at first, see an apparent discrepancy between our results and the ones of Tam and Gingras. However, if one restricts our system sizes to the ones used by Tam and Gingras, the agreement of the data is within statistical error bars. Based on these rigorous tests, we are certain that the fact that the cluster moves do not fully obey detailed balance does not affect the quality of the Monte Carlo data.
- Kjaer et al. (1989) K. Kjaer, J. Als-Nielsen, I. Laursen, and F. K. Larsen, A neutron scattering study of the dilute dipolar-coupled ferromagnets LiTb0.3Y0.7F4 and LiHo0.3Y0.7F4 . Structure, magnetisation and critical scattering, J. Phys: Cond. Mat. 1, 5743 (1989).
- Ancona-Torres et al. (2008) C. Ancona-Torres, D. M. Silevitch, T. F. Rosenbaum, and G. Aeppli, Quantum and Classical Glass Transitions in LiHoxY1-xF4, Phys. Rev. Lett. 101, 057201 (2008).
- Wu et al. (1991) W. Wu, D. Ellman, T. F. Rosenbaum, G. Aeppli, and D. H. Reich, From classical to quantum glass, Phys. Rev. Lett. 67, 2076 (1991).
- Cederberg (2001) J. N. Cederberg, A Course in Modern Geometries, Springer Undergraduate Texts in Mathematics and Technology (Springer, 2001).
- Larkin and Khmelnitsky (1970) A. I. Larkin and D. E. Khmelnitsky, Virial expansion for magnetic impurities in metals, Sov. Phys. JETP 31, 958 (1970).
- Schechter and Stamp (2009) M. Schechter and P. C. E. Stamp, Correlated random fields in dielectric and spin glasses, Europhys. Lett. 88, 66002 (2009).
- Imry and Ma (1975) Y. Imry and S.-K. Ma, Random-Field Instability of the Ordered State of Continuous Symmetry, Phys. Rev. Lett. 35, 1399 (1975).
- Fisher and Huse (1986) D. S. Fisher and D. A. Huse, Ordered phase of short-range Ising spin-glasses, Phys. Rev. Lett. 56, 1601 (1986).