Crystal structure, thermodynamics, magnetics and disorder properties of Be-Fe-Al intermetallics
Abstract
The elastic and magnetic properties, thermodynamical stability, deviation from stoichiometry and order/disorder transformations of phases that are relevant to Be alloys were investigated using density functional theory simulations coupled with phonon density of states calculations to capture temperature effects. A novel structure and composition were identified for the Be-Fe binary phase. In absence of Al, FeBe5 is predicted to form at equilibrium above K, while the phase is stable only below K, and FeBe2 is stable at all temperatures below melting. Small additions of Al are found to stabilise FeBe5 over FeBe2 and , while at high Al content, AlFeBe4 is predicted to form. Deviations from stoichiometric compositions are also considered and found to be important in the case of FeBe5 and . The propensity for disordered vs ordered structures is also important for AlFeBe4 (which exhibits complete Al-Fe disordered at all temperatures) and FeBe5 (which exhibits an order-disorder transition at K).
1 Introduction
Beryllium (Be) is a light element with excellent neutron transparency, and for this reason it is currently used as a plasma facing material in the Joint European Torus (JET) fusion reactor [1] and has been selected for use in the International Thermonuclear Experimental Reactor (ITER) [2]. However, Be is also highly toxic [3], which makes experimental research and development of Be alloys a difficult and expensive task. In the extreme environment associated with the fusion plasma, the presence of impurities and alloying additions may play a crucial role in the ageing and degradation processes. If the impurity elements are not retained in solution within the Be phase, they will form second phase particles embedded within the grains or form at grain boundaries and surfaces, where their presence can be deleterious to the mechanical and chemical properties of the alloy. Here we will be concerned with the iron (Fe) and aluminium (Al) containing intermetallic phases of Be, as Fe and Al are common additions/impurities in Be alloys [4].
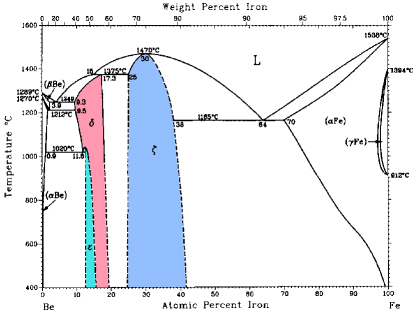
In a review of the binary Be-Fe system, Tanner and Okamoto [5] highlight that, despite the many conflicting reports, much of the phase diagram is now well characterised, see fig. 1. However, ‘more data on the thermodynamic properties and phase diagram of this system are needed to improve the model’ [5]. This system exhibits solid solutions at either end of the composition range, a metastable BeFe3 phase and three stable intermetallic compounds: FeBe2 (), FeBe5 () and a Be-rich intermetallic phase () of unknown structure and uncertain composition. A recent claphad study [6] expanded the understanding of Be solution in -Fe, by including the effect of magnetic transition and order-disorder transitions. They also propose that the phase undergoes a first order transition at K, decomposing into and below said temperature. This was not captured in earlier computational work [7], and experimental investigation was chiefly concerned with temperatures above K [5].
Regarding the phase, Teitel and Cohen [8] first report it as hexagonal with composition FeBe11 (or potentially FeBe12), which forms only at temperatures below and exhibits limited solubility (7.8–8.2 at. % Fe). By means of density measurements, their work shows that a unit cell of FeBe11 should contain 18 atoms (i.e. formula units), which remains a peculiar and unexplained result. In subsequent publications, this hexagonal phase is the most commonly reported [5], however there is conflicting information. For example, Von Batchelder and Raeuchle [9] proposed a body centred tetragonal Mn12Th-type structure. Hindle and Slattery [10] reports a body-centred tetragonal Be-rich compound. Johnson et al. [11] report a new hexagonal phase with unknown composition FeBex, but assign the space group and a basis consisting of 19 symmetrically unique sites, though potentially with partial occupancy. X-ray diffraction reveals many similarities with the FeBe11 phase of Tetiel [8], but accurate density measurements exclude the possibility of a AB11 composition. Aldinger et al. [12] used the structure of Johnson et al. [11] but assigned the composition FeBe7, yet the compound is still presented with a composition of 8 at. % Fe. Later, Jönsson et al. [13] were able to index the same X-ray peaks to another hexagonal structure, with c/a ratio 1.50, rather then the previously reported value of 2.59.
The ternary Al-Be-Fe system is even less well characterised. Raynor et al. [14] report a phase with composition Fe3Al7Be7. Black [15] presents an intermetallic with composition FeAl2Be2.3, which exhibits a defective form of the cubic C15 Laves structure (prototype MgCu2) where Fe and Be atoms are ordered on the Cu site (the Be deficiency was not explained). Both studies concentrated on the Al-rich side of the phase diagram and therefore did not identify any low Al, high Be phases.
Subsequent work focused on commercial Be-rich alloys: Rooksby and Green [4] found an intermetallic similar to FeBe5 but with a larger lattice parameter, which was initially termed YBe5 (where Y indicates a transition metal, not yttrium), and was later identified as (Al,Fe)Be5[16], in which the presence of Al on Fe sites results in a larger lattice parameter. Later Carrabine [17] presented a cubic AlFeBe4 phase and in an addendum explained how this composition clarifies the results from Rooksby [16]. It is not clear, however, whether the phase is ordered or disordered. Myers and Smugeresky [18] measured the maximum and minimum atomic ratios of AlFeBe4 ( and respectively) and noted that the Be-rich phase does not accommodate an appreciable amount of Al and that the stability of this phase reduces with increasing Al content.
The current work focuses on those phases that are relevant to Be alloys with low Al and Fe concentrations. Using density functional theory (DFT), we will consider the stability of Fe and Al as the FeBe2, FeBe5, and AlFeBe4 intermetallics, deviations from these stoichiometric compositions and the solubility of Fe and Al within Be metal. The article is structured as follows: after describing the computational methodology, we provide an overview of the crystal structures that are relevant to the work, highlighting the similarities between the phases. The results are then presented in three main sections: first we examine the binary Fe-Be intermetallic compounds and by considering their relative stability, we predict the structure of the phase to be hexagonal Fe2Be17. In subsections we consider elastic properties, magnetic contributions, temperature effects and the accommodation of non-stoichiometry. Next, we consider the effect of Al additions and the consequent formation of solid solutions and a ternary Al-Fe-Be phase. Again we consider magnetic properties and non-stoichiometry. Next, the driving force for ordering in each of the intermetallic phases is presented, after which, we summarise our findings.
2 Computational Methodology
The DFT simulations employed the Perdew Burke and Ernzerhof (PBE) [19] formulation of the generalised gradient approximation for the exchange-correlation functional. Ultra-soft pseudo potentials with a consistent cut-off of were used throughout. All simulations were carried out using the castep code [20].
For point defect calculations, a supercell consisting of conventional unit cells (containing 192 atoms) was used for the cubic AlFeBe4, FeBe5 and FeBe2 phases, while a supercell (216 atoms) was employed for the C14 Laves hexagonal polymorph of FeBe2 and a supercell for Fe2Be17 (171 atoms). A high density of k-points was used for the integration of the Brillouin Zone, following the Monkhost-Pack sampling scheme [21]: the distance between sampling points was maintained as close as possible to and never above . In practice this means a sampling grid of points for the largest supercells.
Since these systems are metallic, density mixing and Methfessel-Paxton [22] cold smearing of bands were employed with a width of . Testing was carried out to ensure a convergence of with respect to all parameters. No symmetry operations were enforced when calculating point defects and all calculations were spin polarised, taking particular care that defective cells reached the lowest energy magnetic state (see A for further details).
The temperature dependence of thermodynamical quantities was calculated within the harmonic and quasi-harmonic approximations. In the harmonic approximation, the vibrational enthalpy — which includes the zero-point energy (ZPE) — and the vibrational entropy are evaluated by integrating the phonon DOS. Together with the configurational entropy and internal energy of the system , they provide Helmholtz free energy, :
| (1) | ||||
| (2) |
where is volume and is temperature. is computed using Boltzmann statistics:
| (3) |
where is the number of possible states.
Helmholtz free energy is relevant for constant volume conditions. However, more commonly, experiments are carried out at constant pressure conditions, in which Gibbs free energy is the relevant quantity. The later may be obtained using the quasi-harmonic method, in which phonon DOS integration is performed at multiple unit cell volumes. Then, for each temperature, the Birch-Murnaghan [23, 24] equation of state is fitted to the free energy of the system and only the minimum energy value is taken (see Fig. 2):
| (4) |
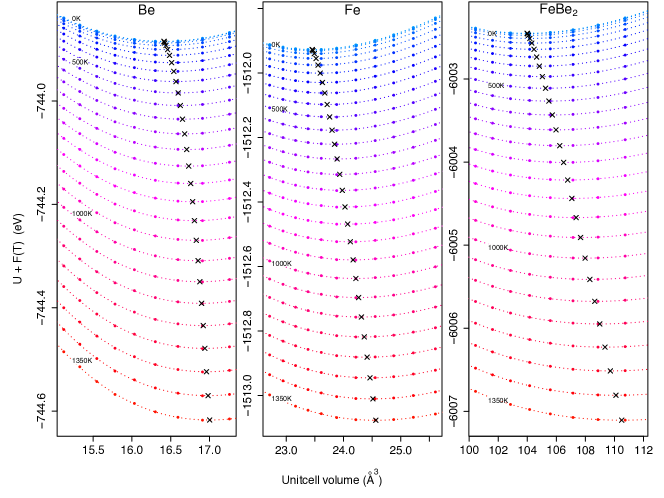
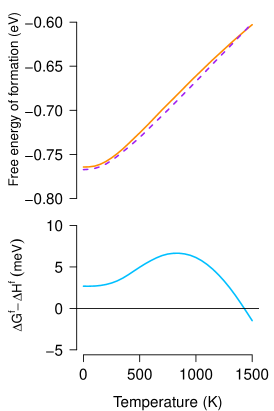
Due to computational restrictions, the quasi-harmonic approximation was employed for the smallest systems under consideration, i.e. Fe(s), Be(s) and h-FeBe2(s). The use of the quasi-harmonic method yields elastic properties that are closer to the experimental values (see Table 1). However, the relative stability of the intermetallic was barely affected by the choice of method, as shown in Figure 3 where the scale is in meV; this provides confidence on the use of the harmonic approximation for the remaining phases.
Recent advances in the description of magnetic ordering [25, 26, 27, 28, 29, 30] allow for the accurate calculation of magnetic contributions to the total stability of phases. This is particularly significant for iron. Since the current work focuses on the relative stability of intermetallic phases of the Be-Al-Fe system, accurately describing the absolute energy of the reference Fe phase is of less importance, as this is kept consistent across the study. Nevertheless, the use of advanced methods for magnetic materials may also be relevant to the intermetallic phases. To investigate that, a thorough analysis of the magnetic ordering of the phases presented here is require, which is beyond the scope of the current work.
| Fe(s) | ground state | — | — | — | p m 5 | — | |
|---|---|---|---|---|---|---|---|
| quasi-harmonic | — | — | p m 2 | p m 2 | |||
| [31, 32] | — | — | |||||
| Be(s) | ground state | — | — | p m 1 | — | ||
| quasi-harmonic | p m 2 | p m 2 | |||||
| [33][34] | NA | NA | |||||
| FeBe | ground state | — | — | p m 1 | — | ||
| quasi-harmonic | p m 2 | p m 2 | |||||
| [5] | NA | p m 0.003 | NA | p m 0.008 | NA | NA |
Phonon densities of states (DOS) were calculated using the finite displacement method with supercell extrapolation [35]. Supercells containing 48, 162, 192 and 384 atoms were used to test convergence with respect to supercell size for FeBe2. The difference in harmonic thermodynamical contribution between the 384 atom supercell and the 48 atom supercell was smaller than .
For defective supercells, the energy convergence criterion for self-consistent calculations was set to . Similarly robust criteria were imposed for atomic relaxation: the energy difference was less than , forces on individual atoms less than and for constant pressure calculations, the stress component on cells less than . For phonon calculations and ideal structures, the degree of convergence was tightened by 1.5 orders of magnitude.
Elastic constants were calculated using tools developed by Walker and Wilson [36] by performing small lattice perturbations from the ground state structures and measuring the stresses. Ten strain increments were performed in each crystallographic independent direction, between and . Theoretical XRD patterns were produced with CrystalDiffract® [37], with a peak broadening of .
Employing the methodology developed by Bragg and Williams [38, 39, 40], it is possible to estimate the degree of order () of a phase as a function of temperature and potential energy increase () caused by an atomic replacement from order towards disorder. The degree of order of a structure may be defined as follows: let be the total number of atoms in the system, and the subset of atoms that are susceptible to disordered substitutions. Further, let there be positions of order in the system and therefore positions of disorder and let be the probability that an atom is occupying a position of disorder. The degree of order is then defined as:
| (5) |
so that in complete disorder (i.e. when ) , and in complete order (i.e. when ) .
The systems considered in the current work exhibit the same order/disorder parameters of Fe3Al examined in ref. [38], namely , and the total number of A atoms (Al in the current work) . With this set of parameters, the dependency of the degree of order with temperature and potential energy of a replacement towards disorder, can be simplified to [38]:
| (6) |
where is Boltzmann constant. The energy penalty is in turn dependant on the degree of order . In the Bragg-Williams approach this dependency is assumed to be linear. Furthermore if (complete disorder), must also be zero as the positions of order and those of disorder are indistinguishable and substitutions into either site must be equivalent. Owing to the linear relationship, reaches a maximum value when (i.e. in conditions of complete order). Mathematically, that is expressed as
so that
and
It is acknowledged that local fluctuation of the atomic arrangements in any small sample of crystal will cause corresponding fluctuation in , therefore is to be taken as an effective average value of V, representative of the degree of order S [40]. Bragg and Williams also recognised that is almost insensitive to [38]. In the current work the temperature dependency of is ignored altogether and is taken (for all temperatures) as half the average antisite defect formation energy in a completely ordered crystal.
Similarly to the calculation of magnetic disorder described above, other methods for the computation of chemical disorder transition have been proposed subsequent to the Bragg-Williams approach adopted here [41, 42, 43, 44, 25], however these method require a great deal more computational power and separate in-depth analysis, and are outside the scope of this study.
3 Crystallography of Fe-Al-Be intermetallics
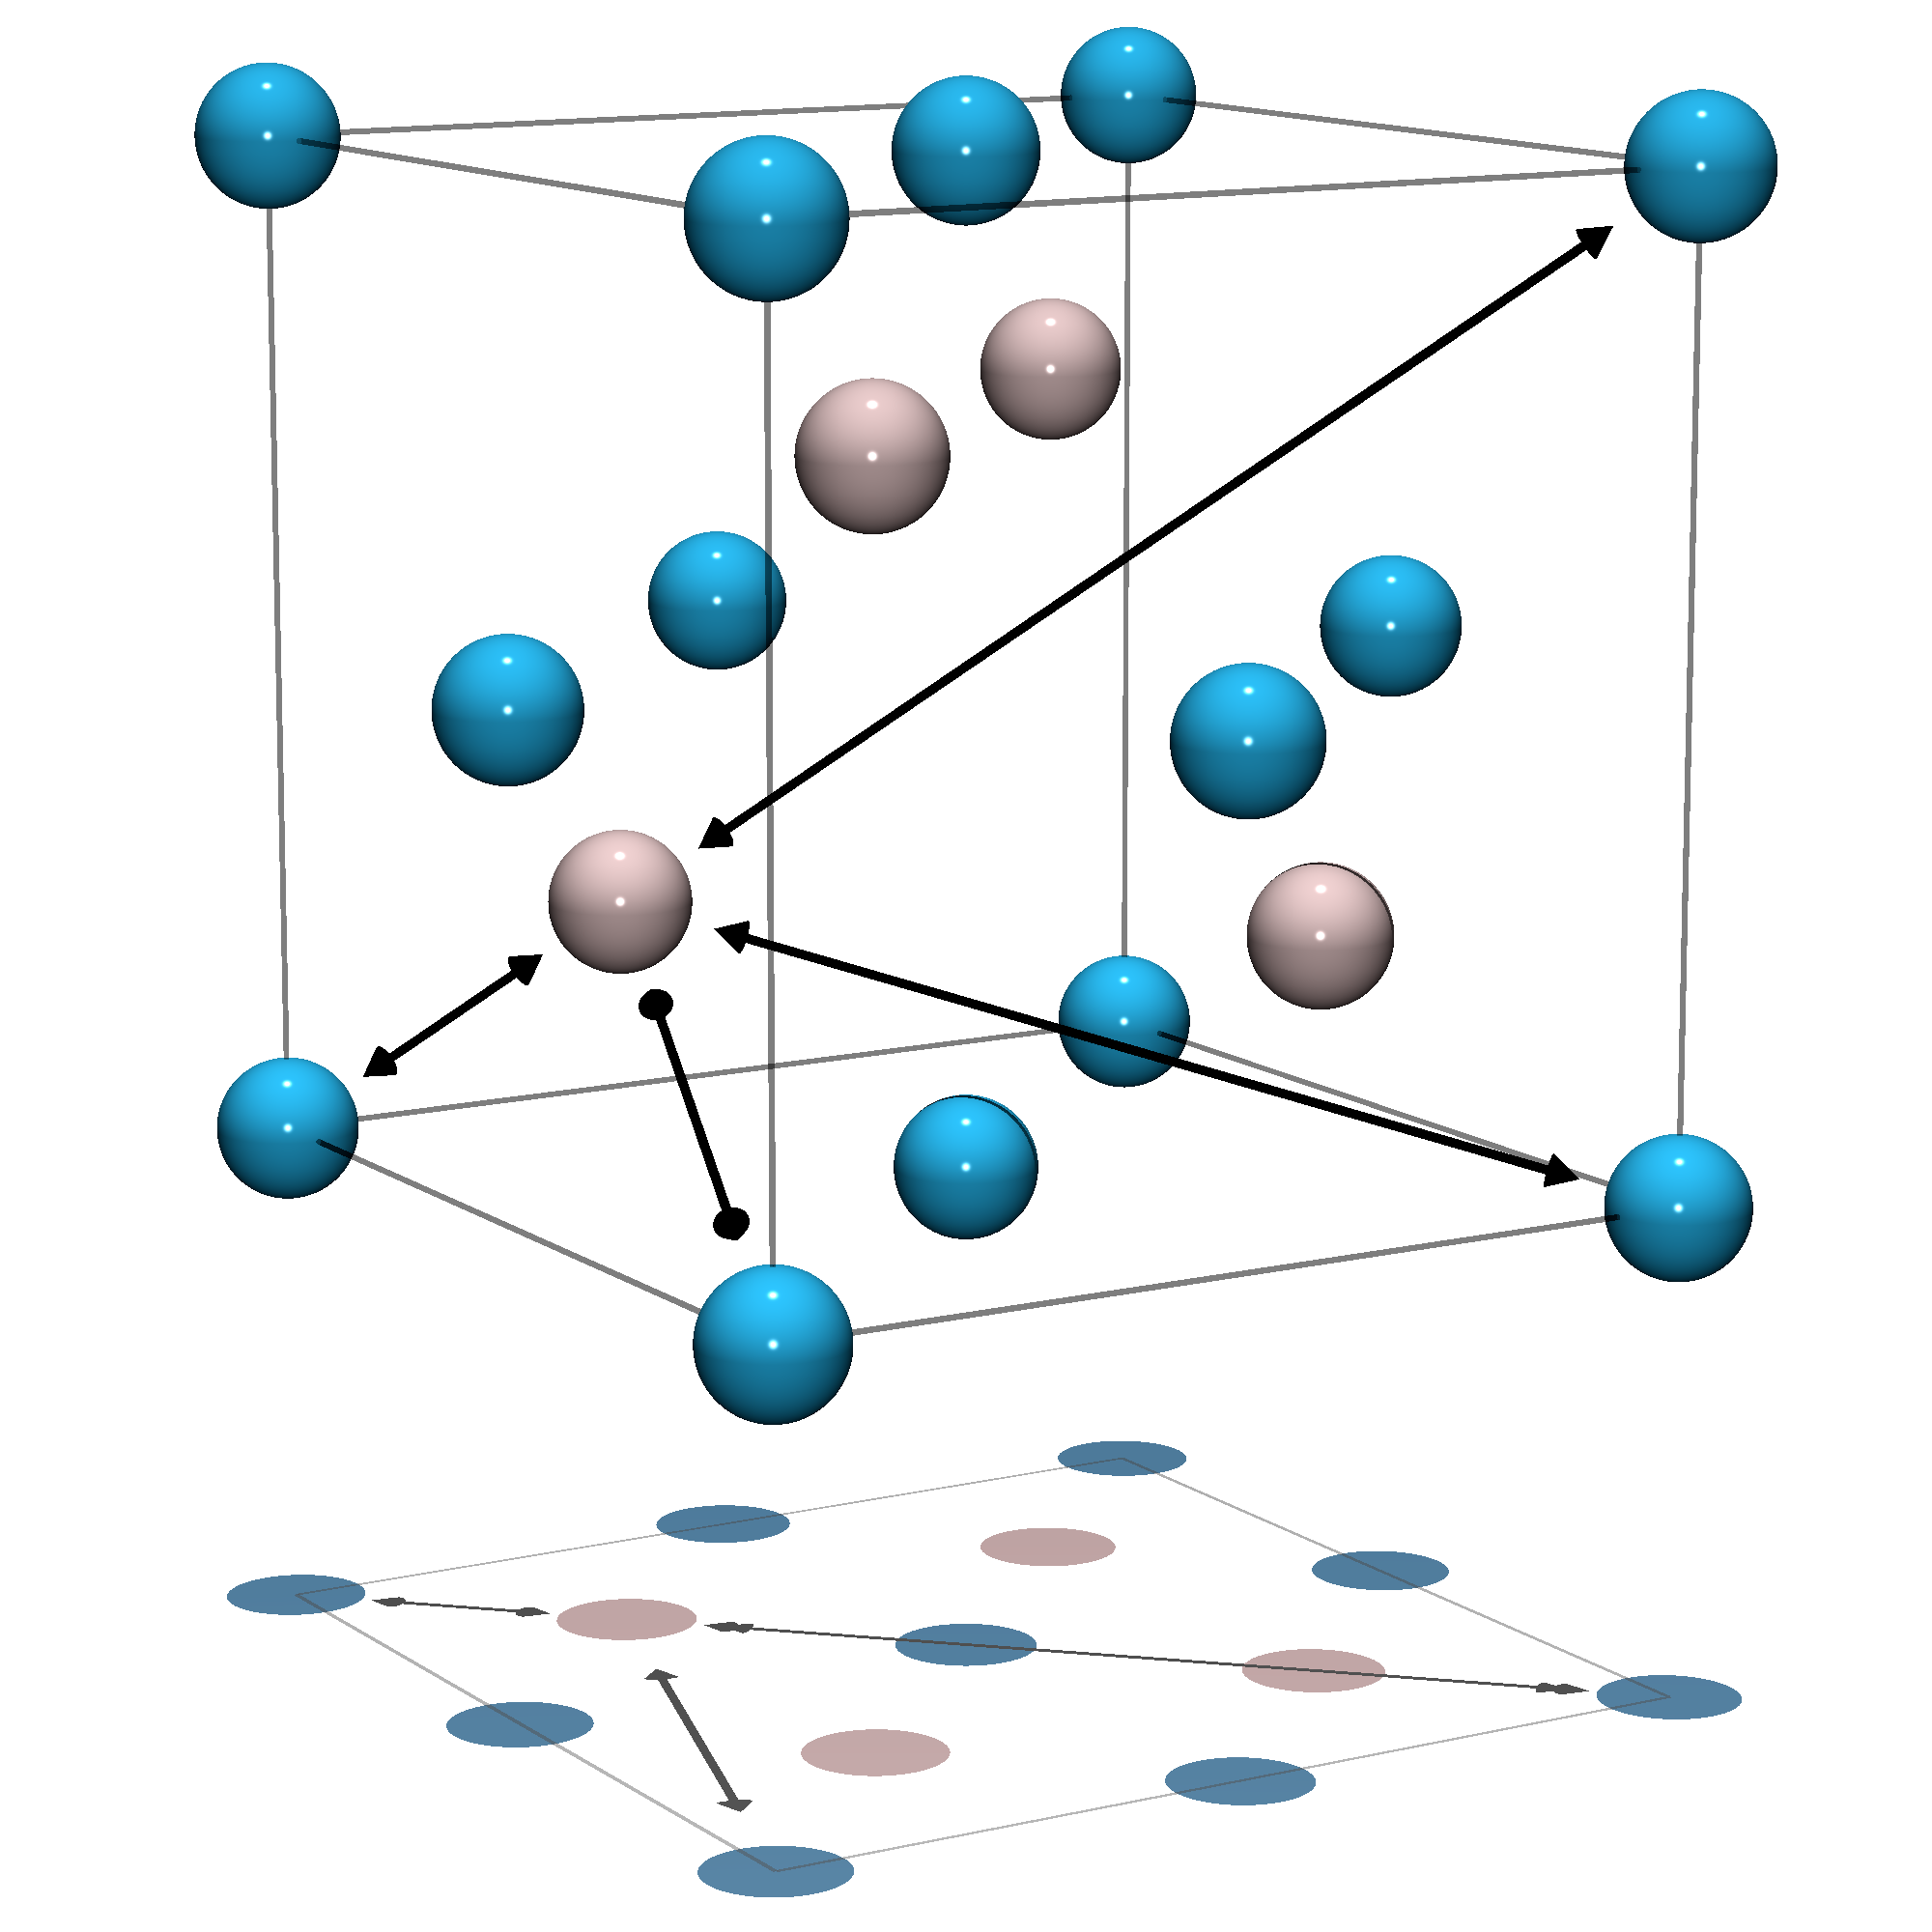
The AlFeBe4 phase (space group ), can be described by three face-centered cubic (FCC) sublattices (see Fig 4(a)). The first sublattice, with origin at is occupied by Fe atoms. The second one, occupied by Al atoms, is shifted by and has four sites within the conventional unit cell, namely . Be atoms, which have a multiplicity of 4 compared to Al or Fe atoms, are grouped in tetrahedra, each of which is centred at the lattice points of the third FCC sublattice. The third FCC sublattice is shifted by , thereby occupying the last four corners of the cube: .
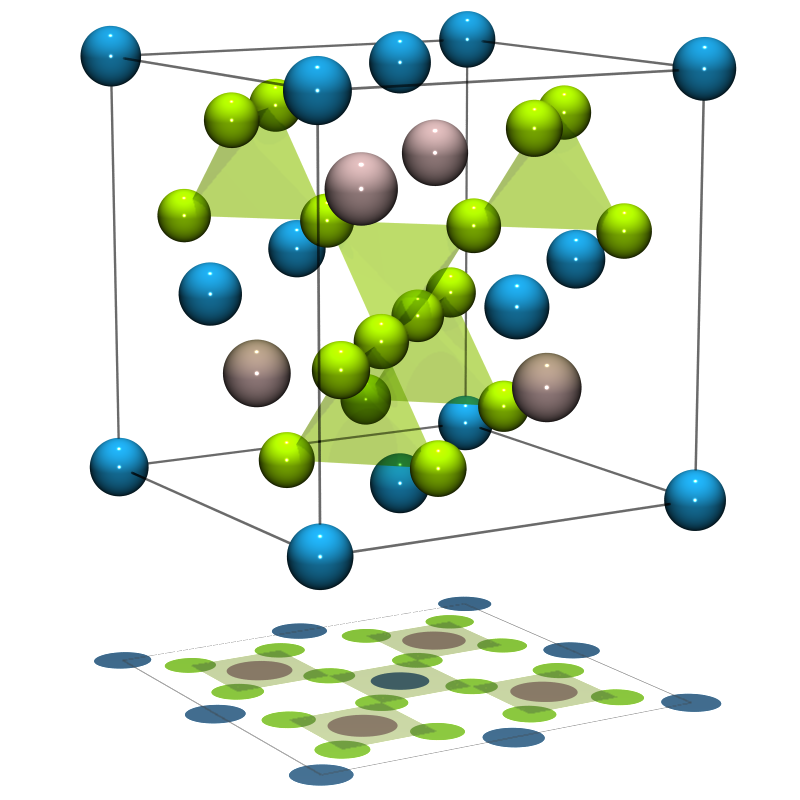
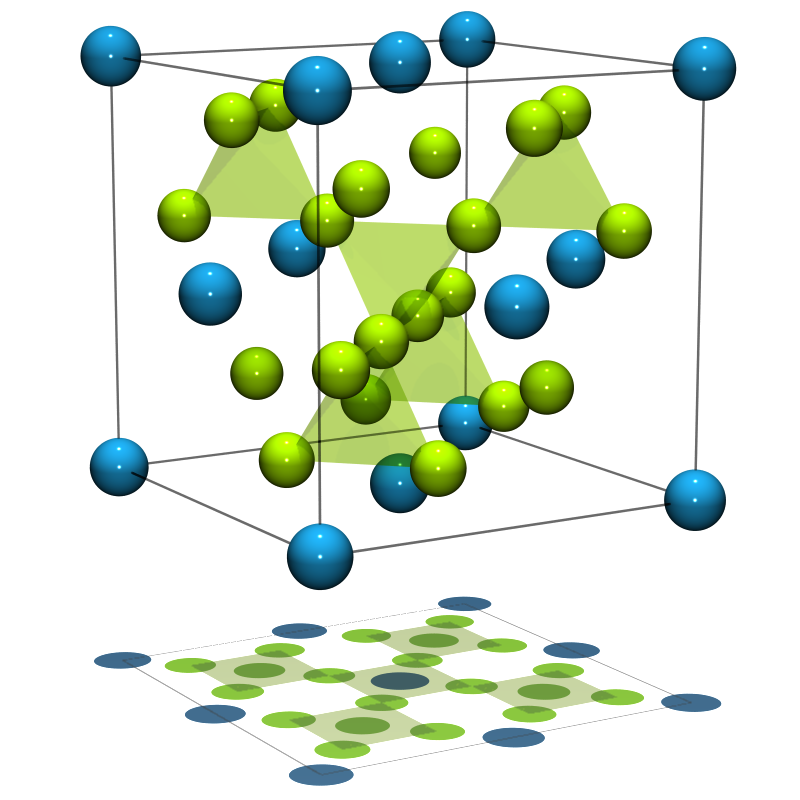
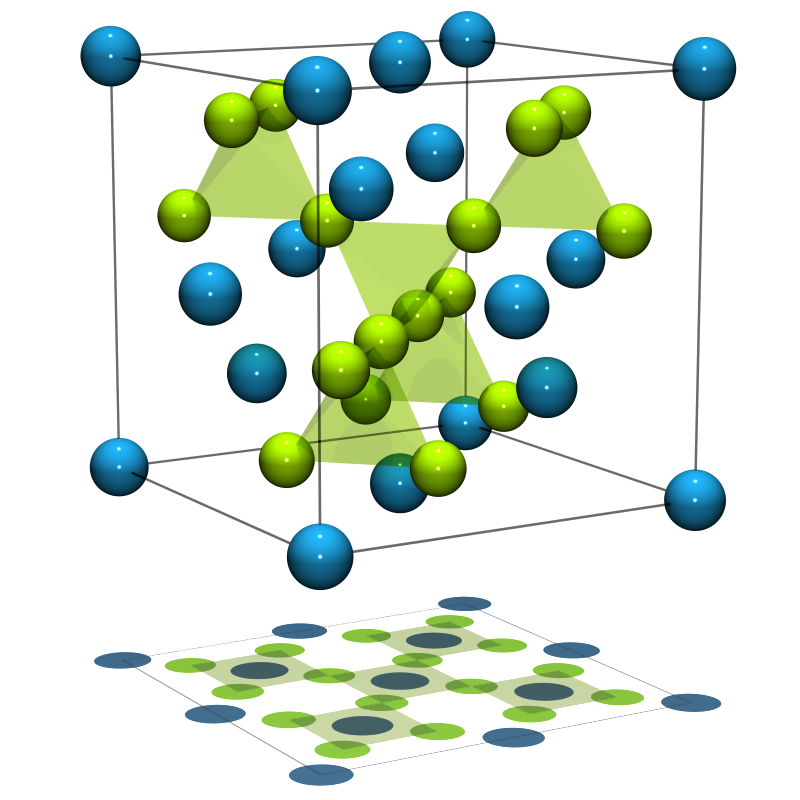
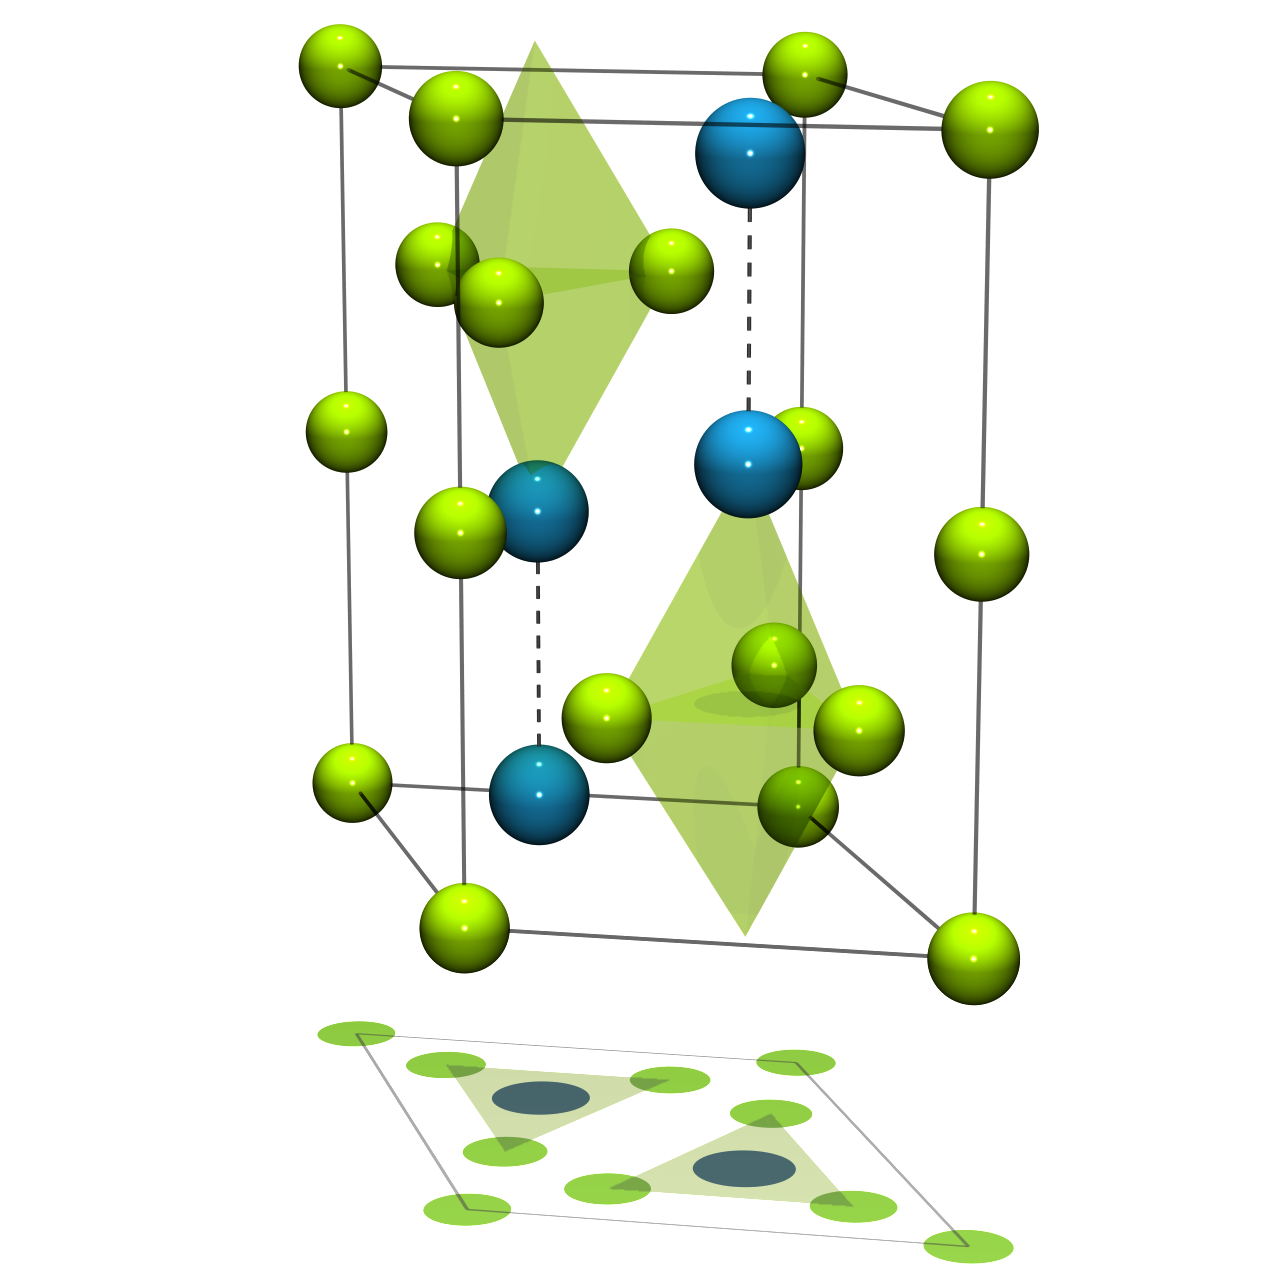
FeBe5 exhibits the same structure as AlFeBe4, where all Al atoms have been substituted for Be (Fig 4(b)). If all Al atoms were to be substituted by Fe instead, the structure would become the C15 Laves phase of FeBe2 (Fig. 4(c)). Experimentally it has been reported that FeBe2 exhibits the C14 Laves phase (Fig. 4(d)). Nevertheless, as a check of the validity of the current methodology, the C15 structure was also modelled. Although the two polymorphs of FeBe2 may look very different, the local atomic coordination is the same: the A atoms (either Fe or Al in the current work) form a diamond structure sub-lattice, where each atom had a coordination number (CN) of 16 (4 A atoms and 12 B atoms). The B atoms (Be) form a network of tetrahedra that intercalate around the A atoms, with a CN of 12 (6 A + 6 B).
A disordered Al baring phase has also been reported where Al substitutes for Fe in FeBe5, producing (Al,Fe)Be5 [16]. In the current work we also consider the case in which Al substitutes for Fe in FeBe2, forming (Al,Fe)Be2. In both cases, the ternary compounds retain the lattice symmetry of their parent structures.
| Composition | Crystal | Prototype | Space | Atoms per | Reference | ||
|---|---|---|---|---|---|---|---|
| class | structure | group | unit cell | ||||
| FeBe9 | — | — | — | — | — | — | [8]111The work of Mish was not published but is indirectly reported in [8]. |
| FeBe11 | Hex | — | — | 18 | [8] | ||
| FeBe12 | Tetr | Mn12Th | 13 | [9] | |||
| FeBe11 | Hex | — | — | — | [16] | ||
| FeBex | Hex | RhBe6.6 | 19222While the phase by Johnson et al. [11] has 19 symmetry sites, not all are fully occupied. | [11] | |||
| FeBe11 | Hex | — | — | — | [45] | ||
| FeBe7 | Hex | — | — | — | [12] | ||
| FeBe11 | Hex | — | — | — | [13] |
| Composition | Crystal | Prototype | Space | Atoms per | |||
|---|---|---|---|---|---|---|---|
| class | structure | group | unit cell | ||||
| Fe3Be16 | Hex | RhBe6.6 | 19 | ||||
| FeBe8 (1) | Hex | RhBe6.6 | 18 | ||||
| FeBe8 (2) | Hex | RhBe6.6 | 18 | ||||
| Hex | RhBe6.6 | ||||||
| Fe2Be15 | Hex | RhBe6.6 | 17 | ||||
| FeBe17 | Hex | RhBe6.6 | 18 | ||||
| FeBe12 | Tetr | Mn12Th | 13 | ||||
| FeBe12 | Hex | Fe6Ge6Mg | 13 | ||||
| FeBe13 | Cubic | NaZn13 | 28 | — | |||
| Fe2Be17 | Hex | Ni17Th2 | 38 | ||||
| Fe2Be17 | Hex | Th2Zn17 | 57 | — | |||
| Fe3Be17 | Cubic | Be17Ru3 | 160 | — | |||
| Be22Fe | Cubic | Al18Cr2Mg3 | 176 | — |
Regarding the Be-rich phase, the limited crystallographic information available is summarised in Table 2. In terms of the basis, Von Batchelder and Raeuchle [9] provide a full set of atomic coordinates for the tetragonal FeBe12 structure, but the only information available about the more commonly observed FeBe11 phase of Teitel and Cohen [8], is that a unit cell contains atoms. The structure reported by Johnson et al. [11], in a publication that focussed on the structure of RhBe6.6, comprises a list of 9 atomic coordinates which, if fully occupied, would yield composition Fe3Be16. However, the exact composition of the compound (FeBex) was not provided, and some partial occupancy may be present on selected Fe and Be sites. Interestingly, the phase described by Johnson et al. [11] shares similarities with that reported by Teitel and Cohen [8] for FeBe11; this would explain the presence of atoms per unit cell of FeBe11. Aldinger [12] and Jönsson et al. [13] report structures with a larger lattice constant but do not give information regarding the crystal basis.
In the current work, we considered tetragonal FeBe12, hexagonal Fe3Be16 and some variations of this structure that were generated by removing or changing those atoms that may accommodate partial occupancy (as observed in RhBe6.6). Consequently two variants of FeBe8, Fe2Be17, FeBe17 and Fe2Be15 were modelled. Furthermore, we have considered the structures of intermetallic compounds that Be can form with any other transition metal in which the ratio of transition-metals to Be is smaller than . A summary of all the phases simulated, and their calculated enthalpies of formation from standard state , are presented in Table 3. The reference state for Fe was the ferromagnetic body-centred cubic (ferrite), as per reference [46]. For small compositional variations such as those in Table 3, the reaction energy to go from one phase to another phase under Be rich conditions can be approximated by the change in formation enthalpy (to within ).
The Fe2Be17 phase exhibits the lowest enthalpy of formation, with predicted lattice parameters in good agreement with previous work [8, 16, 11, 45]. All other variations of the RhBe6.6 structures yielded less favourable formation energies and were not considered further. None of the structures replicated from other transition metal beryllides proved to be more stable and were also discounted. The tetragonal phase of Von Batchelder and Raeuchle [9] is also significantly less favourable than hexagonal Fe2Be17.
| Atom | Wyckoff | Occupancy | |||
|---|---|---|---|---|---|
| label | site | % | |||
| Fe1 | 76Fe + 24Be | ||||
| Be1 | 100Be | ||||
| Be2 | 100Be | ||||
| Be3 | 100Be | ||||
| Be4 | 100Be | ||||
| Be5 | 100Be | ||||
| Be6 | 100Be | ||||
| Be7 | 100Be |
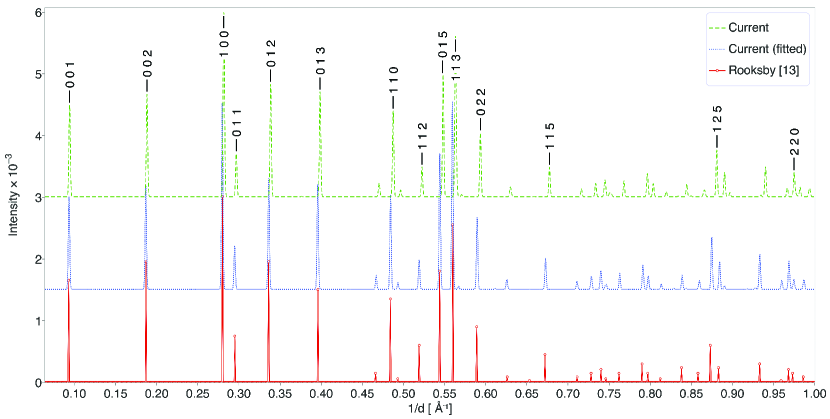
The full crystallographic basis set for the Fe2Be17 structure is presented in Table 4. This includes partial occupancy of the Fe1 site, which is discussed in detail in section 4.3. Using the data presented in Tables 3 and 4, a theoretical XRD pattern was generated (green dashed line in Fig. 5) and compared with the available experimental data from Rooksby [16] (red solid line in Fig. 5). Localised models for exchange-correlation functionals (including the PBE used in the current work) are known to suffer from overbinding errors [47, 48], which in turn cause a shift in the XRD spectrum towards larger values. To compensate for this, a second spectrum (blue dotted line in Fig. 5) was produced by enforcing the experimental lattice parameters of Rooksby [16] with the predicted Fe2Be17 structure. The excellent agreement between the experimental and theoretical XRD spectra further supports the conclusion that the defective Fe2-xBe17+x structure is a good representation of the phase (see section 4.3 for details on non-stoichiometry).
4 The binary Be-Fe system
4.1 Stability of the intermetallic phases
The enthalpy of formation from standard state of each phase under consideration was calculated following the generic reaction ; these energies are presented alongside reactions 7–10. For comparison, the solution enthalpy of Fe into Be metal is also presented (reaction 11).
| (7) | ||||
| (8) | ||||
| (9) | ||||
| (10) | ||||
| (11) |
Reactions are normalised per Fe atom. For dilute Be solution, only the substitutional species was considered (in a supercell containing 150 Be atoms), since previous work showed this to be the most favourable defect for the accommodation of Fe in Be [49].
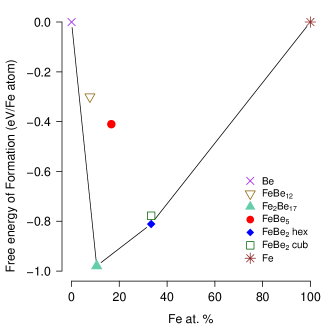
All phases exhibit favourable (negative) formation enthalpies, and in all cases these are lower than the enthalpy of solution. To better understand the relative stability of the intermetallics, the normalised formation enthalpies are plotted against composition to form a convex hull diagram (see Fig. 6). In such a diagram, the distance from the convex hull indicates the degree of instability of a phase, with the points lying on the hull identifying the phases that are observed at that composition [50, 51]. Fig. 6 is constructed exclusively in terms of ground state enthalpy of each phase, with no considerations of entropic or temperature-dependant contributions, which will be presented later in section 4.2.
If excess Fe is present, then FeBe2 will be the predominant intermetallic phase observed in the alloy. This is supported by recent experimental observations by Kadyrzhanov et al. [52]. To quantify the driving force for the formation of FeBe2, in the presence of excess Fe, reactions 7–10 can be rearranged to form reactions 12–14.
| (12) | ||||
| (13) | ||||
| (14) |
All reactions are exothermic (negative). However, in the framework of Be alloys, the presence of excess Fe is unlikely, therefore reactions 15–17 should also be considered, in which each phase ejects Be atoms (released into the Be bulk) to form a higher Fe content intermetallic phase.
| (15) | ||||
| (16) | ||||
| (17) |
Reaction 16, shows that Fe2Be17 does not spontaneously decompose into FeBe2 in dilute Fe-Be alloys. This is demonstrated in Fig. 6 because Fe2Be17 lies on the convex hull. On the other hand, FeBe12 and FeBe5 phases appear to be well above the convex hull, suggesting that they are unstable at . With regards to FeBe12, this is a strong indication that the the phase exhibits the hexagonal (Fe2Be17) structure of Teitel and Cohen [8], as reported in the majority of the literature, and not the tetragonal FeBe12 structure suggested by von Batchelder and Raeuchle [9].
The instability of FeBe5 is surprising considering the experimental observations of this phase [8, 5, 16, 12]. However, this analysis is strictly related to the ground state enthalpy of the phases. Temperature effects and the presence of extrinsic point defects may stabilise FeBe5, as addressed in sections 4.2 and 5.2.
4.2 Temperature effects
Temperature dependent thermodynamic properties were calculated, within the harmonic approximation, by integrating the phonon DOS and subsequently including configurational entropy. The Helmholtz free energy of formation was calculated following reactions 7–11 and the results are presented for the temperature range of –1600K (see Fig. 7).
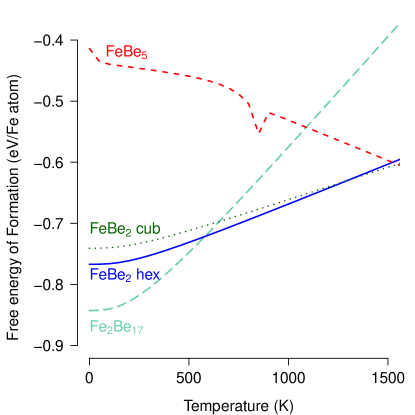
The most striking feature of Fig. 7 is that with increasing temperature, the stability of the FeBe5 phase increases, while those of the other phases decrease. Thus, FeBe5 is stabilised by temperature effects, although it is not expected to form at low temperature under equilibrium conditions. The spike observed in the free energy curve of FeBe5 is due to an order/disorder transition, discussed in greater detail in section 6.
At K, the FeBe5 curve crosses the Fe2Be17 curve. This is a condition necessary but not sufficient for the spontaneous decomposition of Fe2Be17 into FeBe5, as the reaction energy also depends on the Fe content. Therefore, may be considered as the lower bound or the formation of FeBe5 in Be-rich compounds. Experimental phase diagrams, although tentative and based on limited data [8, 5], show a first order transition from to FeBe5 at K. On the other hand, the transition between FeBe5 and FeBe2 is not predicted until high temperatures, potentially beyond the melting point of FeBe5.
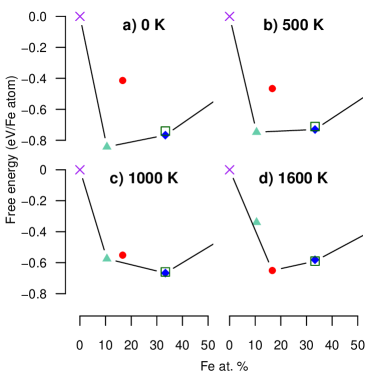
Secondly, we observe a hexagonal to cubic transition of the FeBe2 phase at high temperature. This is a common feature in many Laves phase systems [53, 54, 55, 56]. Nevertheless, the predicted difference in free energy between the two phases is very small and never exceeds , which is below the level of confidence that the current methodology offers. Based on these Helmholtz formation energy values convex hull diagrams were created at (including ZPE) , and (see Fig. 8). The FeBe2 phase lies on the convex hull across the entire temperature range. On the other hand, Fe2Be17 and FeBe5 are only expected to be stable at low and high temperatures, respectively. At intermediate temperatures the two phases are predicted to co-exist (Fig. 8c).
4.3 Non-stoichiometry of binary Fe-Be phases
To investigate the accommodation of non-stoichiometry in the intermetallics, the formation enthalpies of intrinsic defects were calculated. In particular, the Fe and Be vacancies, Be substituting for Fe and vice versa. Interstitial Be atoms were also considered.333Fe interstitial defects were considered unimportant, however, to check this we calculated the energies of Fei in FeBe2 and found values typically , that is, much higher than for equivalent substitutional related process In Kröger-Vink notation these are , , , , and , respectively.
Commercial Be alloys are best represented by excess-Be conditions: in typical alloys, intermetallics only occupy a minute volume fraction, in the form of nano-to-micron sized second phase particles surrounded by metallic Be. Furthermore, as expressed by reactions 7–11, at equilibrium, most Fe is expected to be sequestrated within the intermetallic compounds; very little of it is expected to be in solution and none in the form of metallic Fe particles. In practice this means that there is a readily available reservoir of Be atoms and mass action is achieved by adding or subtracting atoms from bulk Be (reactions 18–19). The resulting enthalpies correspond to the standard defect enthalpies of formation. On the other hand, the only reservoir of Fe atoms are the intermetallics themselves. Therefore when forming Fe defects, a unit of intermetallic must decompose into free Fe and Be. Fe will react to form the defect and the Be atoms are released into the bulk (reaction 20). Similarly, defects occupying the Fe site will cause the displaced Fe to react with bulk Be to form one formula unit of the pre-existing intermetallic phase (reactions 21–22). The enthalpies of formation of these defects are presented in Table 5.
| (18) | ||||
| (19) | ||||
| (20) | ||||
| (21) | ||||
| (22) |
The enthalpies arising from reactions 20–22, do not correspond to standard defect formation enthalpies, which requires excess . Although not relevant for the current work, the standard formation reactions of those defects and the their energies are reported in C.
| Be depleted | Fe depleted | |||||
|---|---|---|---|---|---|---|
| interstitial configurations | ||||||
| FeBe2 | ||||||
| FeBe5 | ||||||
| dumbbell on | ||||||
| Fe2Be17 | dumbbell on | |||||
In the case of FeBe2, substitutional and vacancy defects have significantly lower formation enthalpies compared to the interstitial defects. Defects producing FeBe2+x (reaction 22 proceeding with ) are markedly easier to accommodate than those that form FeBe2-x. Vacancy mediated accommodation is markedly less favourable but again the defects that lead to accommodation of excess Be () are more stable than those that accommodate excess Fe ().
In the case of FeBe5, again the lowest energy defects are substitutional, however, in this phase they are negative. This is not surprising considering that FeBe5 was found to be unstable without thermal contributions and should decompose into a combination of Be-rich and Be-poor intermetallics (see sections 4.1 and 4.2). It is, therefore, expected that deviations from stoichiometry are also favourable. For instance, the substitution of Fe onto an FCC-Be site, effectively creates one primitive unit cell of the very stable FeBe2 (C15 polymorph) within the FeBe5 structure. Experimentally, the solubility range of FeBe5 is recorded to be large (8.33–16.55 at. % [57]). Here we propose that this is achieved by a substitutional mechanism on both sides of the stoichiometric composition (i.e. FeBe5-x and FeBe5+x).
Regarding the phase, the work by Johnson et al. [11] suggests that this phase may exhibit partial occupancy. The results from Table 5, suggest that vacancies of either Fe and Be atoms are energetically unfavourable. However, the defect exhibits negative formation energy. The presence of defects of this type would reduce the Fe content of the compound from 10.5 at. % for the stoichiometric Fe2Be17 to a value closer to the observed 8 at. % value. Therefore, we propose that phase is best represented by the chemical formula Fe2-xBe17+x, where .
5 Ternary Al-Fe-Be phase
5.1 Formation of AlFeBe4
The binary Al-Be system exhibits no intermetallic phases, and the mutual solid solubilities (Be in Al and Al in Be) are very limited [58]. A binary Al-Be alloy would therefore only contain single element phases of HCP-Be and FCC-Al. A ternary Al-Fe-Be compound with high Be content has been reported previously, with composition AlFeBe[17, 16]. A recent DFT study [49], showed that in the presence of Fe, Al can react to form AlFeBe4 following reactions 23 or 24.
| (23) | ||||
| (24) |
The enthalpies of reaction calculated in the current work (above) are in close agreement with the previous study ( and vs and , respectively). Following the results of section 4, which suggested that FeBe2 and Fe2Be17 are the stable phases at low temperatures, the reactions between Al and these phases were also found to be exothermic (reaction 25 and 26):
| (25) | ||||
| (26) |
The implications are that in the presence of excess Al, the ternary phase is thermodynamically stable. Other ternary phases could theoretically be more stable, however, there is no experimental evidence of other Be-rich ternary compounds, therefore their existence has been discounted. Magnetic properties of this phase were calculated and are reported in A. It was found that AlFeBe4 exhibits significantly less pronounced ferromagnetism compared to the Fe-Be binary intermetallics.
5.2 Accommodation of dilute Al additions in the Fe-Be system
The incorporation of Al as a dilute point defect into binary Fe-Be intermetallic phases was investigated to model dilute Al-content conditions. Since the addition of Al may act as a stabilising agent for some of the metastable intermetallic phases, all binary Fe-Be phases were considered. Al atoms (calculated metallic radius ) are significantly larger than Be and Fe atoms ( , ) and therefore unlikely to occupy interstitial sites. To test this, the defect energy of Al in the largest interstitial site was determined, and found to be less favourable than substitutional defect energies. Instead, substitution onto each of the symmetrically unique Be sites (reaction 27) and the Fe site (reaction 28) were considered. Once again, we are interested in the Be-excess conditions. The reactions governing the solution of Al into the intermetallics are:
| (27) | ||||
| (28) |
The standard formation enthalpy (relevant if excess Fe and Al are present) are presented in C. The solution enthalpies from reactions 27 and 28 are reported in Table 6, together with the formation enthalpy of ternary AlFeBe4 (following reactions 23–26).
| FeBe2 | |||
| FeBe5 | |||
| Fe2Be17 | |||
| FeBe12 | |||
Comparing the solution enthalpy with the formation enthalpy of AlFeBe4, it is clear that AlFeBe4 is preferentially formed over dilute Be-Fe-Al ternary intermetallics if sufficient Al is present. Nevertheless, the dilute incorporation of Al in FeBe2 and FeBe5 yields large and negative solution enthalpies, therefore a degree of solid solution is expected. On the other hand, the solution of Al into the Be-rich phases is highly unfavourable, in agreement with experiment [16, 18].
The solution energies in Table 6 show that solution of Al in FeBe5 is significantly more favourable than in FeBe2. This suggests that Al may stabilise FeBe5. Interestingly, the preferred site for Al accommodation in FeBe5 is the FCC-Be ( Wyckoff site), which is nominally occupied by Al in the AlFeBe4 phase. Accommodation on the FCC-Be site is more favourable than the Fe site, suggesting that the (Fe,Al)Be5 ternary phase originally predicted by Rooksby [16], is unlikely to form. This agrees with the work of Carrabine [17]. If the incorporation of Al onto the FCC-Be site continued (unchanged) until , then the AlFeBe4 phase would be formed. However, the accommodation energy onto the Fe site is only more positive, therefore, as the reaction progresses, it is expected that some of the Al will occupy the Fe site and some the FCC-Be site. The combined reactions, together with the fact that the displaced Fe will either form one extra formula unit of FeBe5 or substitute for an FCC-Be (see section 4.3), leads to the formation of disordered (Al,Fe)2Be4 instead of ordered AlFeBe4. The sparse literature available for the ternary Al-Fe-Be phase is inconclusive regarding order/disorder [16, 4, 17].
Regarding FeBe2, the only favourable solution energy is found for substitutions onto the Fe site. Similarly to the previous case, as the incorporation reaction progresses, the host intermetallic FeBe2 tends to become disordered (Al,Fe)Be2, or (Al,Fe)2Be4. Therefore, in the presence of Al, both FeBe2 and FeBe5 will react with any Al in the system and tend towards (Al,Fe)2Be4.
6 Order/disorder in the intermetallic phases
We investigated the driving force for ordering by computing antisite defect energies. Both dilute (non-interacting) and bound antisite defect pairs were studied. In a supercell of AlFeBe4, containing 198 atoms, bound antisite pairs on the Fe and Al sublattices can be investigated at separations from , as the first nearest neighbour (1nn), to (4nn) (see Fig. 9). Equivalent simulations were carried out for FeBe2, FeBe5, where only FCC-Be were considered for antisite pairs as these most easily accommodate Fe atoms (see Table 5). The results are presented in Table 7.
| Phase | defect pair | 1nn | 2nn | 3nn | 4nn | Unbound |
|---|---|---|---|---|---|---|
| AlFeBe4 | Fe-Al | |||||
| FeBe2 | Fe-Be | |||||
| FeBe5 | Fe-Be |
For the ternary phase, the defect formation energies (see Table 7) are negative for the bound defects, and zero for the dilute case. This is a strong indication that the ordered AlFeBe4 as proposed by [16] is unstable and that there is no driving force for ordering in this phase. Therefore, we expect the Al-Fe baring intermetallic phases of Be to exhibit the (Al,Fe)2Be4 Laves structure, where the two FCC sublattices are indistinguishable. This agrees with Rooksby [16], but applied to the correct stoichiometry reported by Carrabine [17] and Myers et al. [18].
A competing contribution to the disorder of the phase is the ferromagnetic behaviour found in AlFeBe4, discussed in A. Whilst the disordered material may not have any long range magnetic ordering, it may still maintain some local spin polarisation around the Fe atoms and/or clusters of spin polarised material surrounded by non spin-polarised species [59]. To quantify the contributions of magnetic moments to the driving force for ordering, the difference between FM and non-magnetic (NM) configurations provide the upper bound: this is calculated to be per unit cell. This is commensurate with the defect formation energy of a single antisite pair and is therefore not sufficient to promote an ordered structure.
Regarding FeBe5, all bound configurations exhibit a small yet positive defect formation energy, suggesting that the defect concentration will be temperature dependant (i.e. the ground state phase is ordered) although given the small energy significant disorder may be anticipated. This is a often an indication of radiation tolerance in the material [60, 61, 62]. Conversely, the dilute antisite pair in FeBe5 (which is evaluated by considering the effect of accommodating and in two spatially separated sites with no interaction between them) has a strongly negative formation energy, which is related to the predicted instability of the phase at low temperatures and its ability to accommodate non-stoichiometry (see section 4).
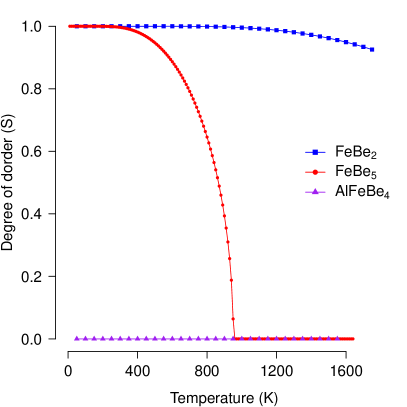
Employing the Bragg-Williams approach, the degree of order in FeBe2, FeBe5 and AlFeBe4 intermetallics was predicted as a function of temperature between and (see Fig. 10). The Al-baring compound exhibits no order across the entire temperature range, due to the zero formation energy for antisite pairs. In contrast FeBe2 exhibits a high degree of order up to its melting point, while FeBe5 though ordered at low temperatures, exhibits a decrease in ordering at K and complete disorder at temperatures above . The degree of order is calculated regardless of the stability of the phases. For instance, FeBe5 is predicted to be unstable at temperatures below K temperatures (see section 4.1–4.2), therefore the predicted degree of order is not relevant unless the phase is first stabilised at low temperature (e.g. by accommodating low quantities of Al impurities). These predictions could be tested experimentally through measurements of the specific heat, since a spike in specific heat should be observed in the vicinity of the critical temperature for ordering [39].
7 Summary
Be is the plasma facing material of choice in current fusion reactor designs. Fe and Al are common elements found in Be, either as alloying additions or as unintentional impurities and their influence on the performance of Be will depend upon which phases are manifest. While it is well established that Be rich intermetallics are formed in the presence of Fe and Al, there is conflicting experimental data. Here we have used atomic scale quantum mechanical simulations based on density functional theory to provide data that we use to predict the structures and energies of various intermetallics and compare these with the solution energies of Fe and Al in Be metal. While previous simulations have focused on enthalpies alone, here by calculating the phonon DOS of the various phases, temperature effects are included by determining both vibrational enthalpy and entropy contributions — and hence we base our discussions around the Helmholtz free energy. The information gathered here provides the foundation for further thermodynamical modelling (e.g. using calphad) [25].
A commonly observed intermetallic is the so-called phase, however, its stoichiometry and structure are not well established. Of the 13 candidate considered in this study, a Fe2Be17 phase, exhibiting a hexagonal RhBe6.6 structure with space group is identified as the most likely, with potential Fe deficiency as highlighted below. Fe2Be17 is found to be stable only at temperatures below K, beyond which it decomposes into solid solutions of FeBe5 and Be(s). The intermetallics FeBe2 and FeBe5 are better characterised experimentally although we find that FeBe5 is unstable at temperatures below K, unless small additions of Al are present, which are found to stabilise FeBe5 phase above other binary phases. Furthermore, FeBe5 is disordered at the temperatures in which it is stable, and may only becomes fully ordered below , whereas FeBe2 exhibits little disorder until at least .
Point defects are calculated for all the phases in order to identify the likely extent of deviations from stoichiometric compositions. FeBe5 exhibits considerable non-stoichiometry with both Fe and Be excess compositions. Conversely, in Fe2Be17 substitution of Be for some Fe is energetically favourable and thus Fe2Be17 will be Fe deficient, while defects in FeBe2 are high in energy and this phase will remain much more stoichiometric.
While the binary Al-Be system exhibits no intermetallic phases, Al is readily incorporated into Fe-Be intermetallics. In particular, Al substitution for Be in FeBe5, and for Fe and BE in FeBe2 lead to the AlFeBe4 phase. Disorder is also apparent in this ternary system with no driving force for ordering so that AlFeBe4 should more accurately be reported as (Al,Fe)2Be4, where the Fe and Al sublattices are indistinguishable.
8 Acknowledgements
We would like to acknowledge the EPSRC and ANSTO for financial support. The computing resources were provided by Imperial College London HPC, and the MASSIVE cluster at Melbourne. Lyndon Edwards is acknowledged for his continuing support, Samuel T. Murphy and Michael W.D. Cooper for the fruitful discussions and Simon C. Lumley for his insight on lattice dynamics.
Appendix A Magnetism in the intermetallics
FeBe2, FeBe5, Fe2Be17 and AlFeBe4 may exhibit one of a range of magnetic orders, as summarised in Table 8. In all cases ferromagnetic (FM) ordering is the most favourable, followed by the high spin antiferromagnetic configuration (AFM-high) in FeBe5 and AlFeBe4 (although the ordered AlFeBe4 structure is not predicted to form). For all materials under investigation a magnetic transition is expected, and further work may be carried out to calculate the Curie transition using the ab-initio techniques thoroughly reviewed in [25], or by means of heat capacity measurements.
| NM | AFM-low | AFM-high | FM | |
|---|---|---|---|---|
| — | — | |||
The reported energy differences correspond to a conventional unit cell. This non-negligible contribution to the energy of the system should be considered when computing isolated defects. In such simulations, the presence of a defect may cause the minimisation algorithm to converge into in a shallow minima with a metastable spin state. In the current work, no constrains were added to the spin while performing an energy relaxation to allow localised changes of the spin near a defect, but great care was taken to ensure that the overall spin state of the system was unchanged after the introduction of a defect. When that did not occur, the simulations were restarted with a slightly different initial spin state and tighter electronic convergence criteria, to help the minimiser overcome local barriers and find the lowest energy minimum. In all cases, it was found that the non-ferromagnetic solution was not the lowest energy configuration.
Regarding the ordered AlFeBe4 phase, it exhibits similar, yet significantly less pronounced, magnetic properties compared to FeBe5 phases. Long range magnetic ordering, both FM and AFM, are not maintained when Fe and Al atoms are randomly distributed in the FCC sublattices. As the ordered AlFeBe4 structure was found to be unstable, preferring to form disordered (Al,Fe)2Be4, the ternary compound is expected to exhibit no magnetic ordering (see section 6).
Appendix B Elastic constants
The complete stiffness matrices were calculated for all the intermetallic phases in the Fe-Be system (see Table 9). These were obtained by performing small lattice perturbations from the ground state structures, and measuring the stresses, while keeping all relative atomic positions fixed. Bulk moduli () and shear moduli () were evaluated using the Voigt-Reuss-Hill method (Hill average) [63].
| Phase | ||||||||
|---|---|---|---|---|---|---|---|---|
| FeBe12 | p m 7 | p m 1 | p m 2 | |||||
| Fe2Be17 | ||||||||
| FeBe5 | ||||||||
| FeBe2 |
Appendix C Defect formation energy from standard state
| Phase | (29) | (30) | (31) | |
|---|---|---|---|---|
| Fe2Be17 | ||||
| FeBe5 | ||||
| FeBe2 | ||||
The standard defect formation enthalpy of intrinsic Fe defects are calculated following reactions 29–32, and the results are presented in Table 10.
| (29) | ||||
| (30) | ||||
| (31) | ||||
| (32) |
These reactions are likely to occur only if is present at equilibrium, a situation not found in commercial Be alloys. These enthalpies of formation are significantly less favourable compared to those in Table 5. This indicates that the formation of one extra formula unit of the existing intermetallics (as per reactions 20–22), greatly reduces the energy penally for accommodation of substitutional defects in Fe-Be binary intermtallics.
References
References
- Deksnis et al. [1997] E. Deksnis, A. T. Peacock, H. Altmann, C. Ibbot, H. Falter, Beryllium plasma-facing components: JET experience, Fusion Eng. Des. 37 4 (1997) 515–530.
- Thompson et al. [2007] V. Thompson, Y. Krivchenkov, V. Riccardo, Z. Vizvary, Fusion Eng. Des. 82 15-24 (2007) 1706–1712,
- [3] D. Kriebel, J. D. Brain, N. L. Sprince, H. Kazemi, Am. Rev. Respir. Dis. 137 2 (1988) 464–473.
- Rooksby and Green [1962] H. P. Rooksby, I. R. Green, Analyst 87 1036 (1962) 539–545.
- Okamoto and Tanner [1988] H. Okamoto, L. E. Tanner, Bull. Alloy Phase Diagrams 9 4 (1988) 494–508.
- Ohtani et al. [2004] H. Ohtani, Y. Takeshita, M. Hasebe, Mater. Trans. 45 (5) (2004) 1499–1506, doi:10.2320/matertrans.45.1499.
- Kaufman and Tanner [1984] L. Kaufman, L. E. Tanner, Calphad 8 (2) (1984) 121–133.
- Teitel and Cohen [1949] R. J. Teitel, M. Cohen, Trans. Am. Inst. Mining, Metall. Pet. Eng. 185 April (1949) 285–296.
- von Batchelder and Raeuchle [1957] F. W. von Batchelder, R. F. Raeuchle, Acta Crystallogr. 10 10 (1957) 648–649.
- Hindle and Slattery [1963] D. E. Hindle, G. F. Slattery, A Metallographic Survey of Some Dilute Beryllium Alloys, in: The metallurgy of beryllium, Chapman & Hall, London, 651–664, 1963.
- Johnson et al. [1970] Q. Johnson, G. S. Smith, O. H. Krikorian, D. E. Sands, Acta Crystallogr. B26 2) (1970) 109–113.
- Aldinger and Petzow [1979] E. Aldinger, G. Petzow, Constitution of beryllium and its alloys, in: Beryllium Sci. Technol. Vol. 1, D. Webster and G. J. London (Eds.), Plenum, London, UK, 1st edn., 267, 1979.
- Jönsson et al. [1982] S. Jönsson, K. Kaltenbach, G. Petzow, Zeitschrift für Met. 73 8 (1982) 534–539.
- Raynor et al. [1953] G. V. Raynor, G. R. Faulkner, J. D. Noden, A. R. Harding, Acta Metall. 1 November (1953) 629–648.
- Black [1955] P. J. Black, Acta Crystallogr. 8 1 (1955) 39–42.
- Rooksby [1962] H. P. Rooksby, J. Nucl. Mater. 2 2 (1962) 205–211.
- Carrabine [1963] J. A. Carrabine, J. Nucl. Mater. 8 2 (1963) 278–280.
- Myers and Smugeresky [1978] S. M. Myers, J. E. Smugeresky, Metall. Trans. A 9A December (1978) 1789–1794.
- Perdew et al. [1996] J. P. Perdew, K. Burke, M. Ernzerhof, Phys. Rev. Lett. 77 18 (1996) 3865–3868.
- Clark et al. [2005] S. J. Clark, M. D. Segall, C. J. Pickard, P. J. Hasnip, M. I. J. Probert, K. Refson, M. C. Payne, Zeitschrift für Krist. 220 (2005) 567–570.
- Monkhorst and Pack [1976] H. J. Monkhorst, J. D. Pack, Phys. Rev. B 13 12 (1976) 5188–5192.
- Methfessel and Paxton [1989] M. Methfessel, A. Paxton, Phys. Rev. B 40 6 (1989) 3616–3621.
- Murnaghan [1944] F. D. Murnaghan, Proc. Natl. Acad. Sci. USA 30 (9) (1944) 244–247.
- Birch [1947] F. Birch, Phys. Rev. 71 (11) (1947) 809–824.
- Körmann et al. [2014] F. Körmann, A. A. H. Breidi, S. L. Dudarev, N. Dupin, G. Ghosh, T. Hickel, P. Korzhavyi, J. a. Muñoz, I. Ohnuma, Phys. Status Solidi 251 (1) (2014) 53–80.
- Lavrentiev et al. [2014] M. Y. Lavrentiev, J. S. Wróbel, D. Nguyen-Manh, S. L. Dudarev, Phys. Chem. Chem. Phys. 16 (2014) 16049–59.
- Körmann et al. [2010] F. Körmann, a. Dick, T. Hickel, J. Neugebauer, Phys. Rev. B - Condens. Matter Mater. Phys. 81 (March) (2010) 1–9.
- Körmann et al. [2008] F. Körmann, a. Dick, B. Grabowski, B. Hallstedt, T. Hickel, J. Neugebauer, Phys. Rev. B - Condens. Matter Mater. Phys. 78 (2008) 1–4.
- Lavrentiev et al. [2013] M. Y. Lavrentiev, D. Nguyen-Manh, J. Wrobel, S. L. Dudarev, in: Jt. Int. Conf. Supercomput. Nucl. Appl. Monte Carlo, 1, 1–6, 2013.
- Nguyen-Manh et al. [2015] D. Nguyen-Manh, P. W. Ma, M. Y. Lavrentiev, S. L. Dudarev, Ann. Nucl. Energy 77 (2015) 246–251.
- Owen and Williams [1954] E. A. Owen, G. I. Williams, J. Sci. Instrum. 31 (1954) 49–54.
- Adams et al. [2006] J. J. Adams, D. S. Agosta, R. G. Leisure, H. Ledbetter, J. Appl. Phys. 100 (11) (2006) 113530.
- Owen [1952] E. Owen, Proc. Phys. Soc. Sect. A, (1952) 294–295.
- Smith and Arbogast [1960] J. F. Smith, C. L. Arbogast, J. Appl. Phys. 31 (1) (1960) 99.
- Frank et al. [1995] W. Frank, C. Elsässer, M. Fähnle, Phys. Rev. Lett. 39 4 (1995) 346.
- Walker and Wilson [2013] A. Walker, D. Wilson, Calculating elastic constants from the atomic scale, https://github.com/andreww/elastic-constants, accessed 6-March-2014.
- CrystalMaker [2014] CrystalMaker Software Ltd., Oxford, UK, www.crystalmaker.com.
- Bragg and Williams [1934] W. L. Bragg, E. J. Williams, Proc. R. Soc. A Math. Phys. Eng. Sci. 145 855 (1934) 699–730.
- Bragg and Williams [1935] W. L. Bragg, E. J. Williams, Proc. R. Soc. A Math. Phys. Eng. Sci. 151 874 (1935) 540–566.
- Williams [1935] E. J. Williams, Proc. R. Soc. A Math. Phys. Eng. Sci. 152 875 (1935) 231–252.
- Kikuchi [1951] R. Kikuchi, Phys. Rev. 81 (6) (1951) 988–1003.
- Kikuchi and Murray [1985] R. Kikuchi, J. L. Murray, CALPHAD 9 (4) (1985) 311–348.
- van de Walle and Ceder [2002] A. van de Walle, G. Ceder, J. Phase Equilib. 23 (4) (2002) 348–359.
- Van de Walle and Ceder [2002] a. Van de Walle, G. Ceder, Rev. Mod. Phys. 74 (January) (2002) 11–45.
- Levine and Luetjering [1971] E. Levine, G. Luetjering, J. Less Common Met. 23 (1971) 343–357.
- Herper et al. [1999] H. Herper, E. Hoffmann, P. Entel, Phys. Rev. B 60 6 (1999) 3839–3848.
- Kohn et al. [1996] W. Kohn, A. Becke, R. Parr, J. Phys. Chem. 100 31 (1996) 12974–12980.
- van de Walle and Ceder [1999] A. van de Walle, G. Ceder, Phys. Rev. B 59 23 (1999) 14992–15001.
- Middleburgh and Grimes [2011] S. C. Middleburgh, R. W. Grimes, Acta Mater. 59 18 (2011) 7095–7103.
- Perevoshchikova et al. [2012] N. Perevoshchikova, B. Appolaire, J. Teixeira, E. Aeby-Gautier, S. Denis, Comput. Mater. Sci. 61 (2012) 54–66.
- Lumley et al. [2014] S. C. Lumley, R. W. Grimes, S. T. Murphy, P. A. Burr, A. Chroneos, P. R. Chard-tuckey, Acta. Mater. 79 (2014) 351–362.
- Kadyrzhanov et al. [2013] K. K. Kadyrzhanov, A. F. Vereshchak, I. A. Manakova, A. N. Ozernoy, V. S. Rusakov, J. Phys. Chem. Solids 74 8 (2013) 1078–1085.
- Stein et al. [2004] F. Stein, M. Palm, G. Sauthoff, Intermetallics 12 (2004) 713–720.
- Stein et al. [2005] F. Stein, M. Palm, Intermetallics 13 (2005) 1056–1074.
- Lumley et al. [2013] S. C. Lumley, S. T. Murphy, P. A. Burr, R. W. Grimes, P. R. Chard-Tuckey, M. R. Wenman, J. Nucl. Mater. 437 1-3 (2013) 122–129.
- Burr et al. [2013] P. A. Burr, S. T. Murphy, S. C. Lumley, M. R. Wenman, R. W. Grimes, J. Nucl. Mater. 443 1-3 (2013) 502–506,
- Janot and Piecuch [1971] C. Janot, M. Piecuch, Acta Metall. 19 July 1971, 713-717.
- Okamoto [2006] H. Okamoto, J. Phase Equilibria Diffus. 27 4 (2006) 424–425.
- Middleburgh et al. [2014] S. C. Middleburgh, D. M. King, G. R. Lumpkin, M. Cortie, L. Edwards, J. Alloys Compd. 599 (2014) 179–182.
- Sickafus et al. [2000] K. E. Sickafus, L. Minervini, R W. Grimes, Science 289 5480 (2000) 748–751.
- Rushton et al. [2007] M. J. D. Rushton, C. R. Stanek, A. R. Cleave, B. P. Uberuaga, K. E. Sickafus, R. W. Grimes, Nucl. Instrum. Meth. B 255 1 (2007) 151–157.
- Sickafus et al. [2007] K. E. Sickafus, R. W. Grimes, J. A. Valdez, A. R. Cleave, M. Tang, M. Ishimaru, S. M. Corish, C. R. Stanek, B. P. Uberuaga, Nat. Mater. 6 3 (2007) 217–23.
- Hill [1952] R. Hill, Proc. Phys. Soc. Sect. A 349 (1952) 349-354.