Proceedings of the Second Annual LHCP
Model-Independent Searches Using Matrix Element Ranking
Dipsikha Debnath
James S. Gainer
Konstantin T. Matchev
Physics Department, University of Florida,
Gainesville, FL 32611, USA
ABSTRACT
Thus far the LHC experiments have yet to discover beyond-the-standard-model physics. This motivates efforts to search for new physics in model independent ways. In this spirit, we describe procedures for using a variant of the Matrix Element Method to search for new physics without regard to a specific signal hypothesis. To make the resulting variables more intuitive, we also describe how these variables can be “flattened”, which makes the resulting distributions more visually meaningful.
PRESENTED AT
The Second Annual Conference
on Large Hadron Collider Physics
Columbia University, New York, U.S.A
June 2-7, 2014
1 Introduction
Next year, the CERN Large Hadron Collider (LHC) will resume operations, accessing energy scales which have never been explored in collider experiments. While there are many well-motivated ideas about what new physics may be found at these new higher energies, one might worry, based on the lack of convincing evidence for new physics at the LHC thus far, that we are looking in the wrong places. Thus it is useful to consider methods that are as model-independent as possible. The ultimate goal would be analyses that discover generic departures from the standard model (SM), without any reference to a signal hypothesis.
Multivariate analyses [1] (MVA) play an increasingly important role in experiments. One MVA, which has been used in the four-lepton channel for the discovery of the Higgs Boson [2] and the measurement of its properties [3], is the so-called “Matrix Element Method” (MEM) [4], which utilizes the likelihood for signal and background hypotheses, calculated largely from theory. Specifically, the variables used in such analyses, such as MELA KD [5] or MEKD [6] involve the ratio of signal and background matrix elements. A natural question, then, is whether we can perform useful analyses using only the background (squared) matrix element. Such analyses will not be optimized for a specific signal hypothesis and will thus be relatively effective in discovering arbitrary new physics. We have addressed this question [7] and found that such analyses are indeed possible and potentially very useful.
2 Discovery from the Background Matrix Element
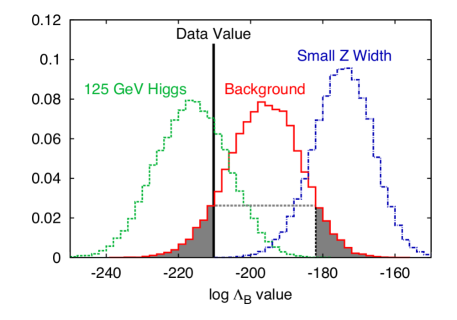
As a test of the use of variables based on the squared background matrix element, , we consider the sum of the natural logarithm of , as calculated by MEKD, a package for MEM calculations for the four-lepton final state based on MadGraph [8]. In figure 1 we plot the distribution this quantity, which we term , for pseudo-experiments with events from various processes. Clearly one can distinguish various “signal” models from the “background”, even using such a crude analysis. (More realistic analyses would use, e.g., a test to determine how the observed distribution of matches the background distribution of this quantity.) It is also worth noting that it is possible to have a signal hypothesis that is “more background-looking” than the background itself, i.e., has a distribution with support well to the right of the background distribution in figure 1.
3 How to Flatten Background Distributions: Examples
One could rule out the background hypothesis for describing the data using the method suggested by figure 1. However, such an approach, which essentially uses only the mean of the quantity of interest, is clearly not optimal. A better approach would be to make a binned histogram of , as calculated for the observed events, and use a technique to test the agreement with the background distribution.
To do this, we must first determine where to set the bin boundaries. A good choice is to choose these boundaries so that the expected number of background events in each bin is equal. To do this we can “flatten” the distribution, essentially by replacing with the cumulative distribution function (cdf) for this quantity. This is not a new insight, but we believe our main message, that doing this allows for a more intuitive understanding of the results of analyses such as those we are describing, is under-appreciated. In the hopes of encouraging the use of these “flattened variables” we describe several approaches to flattening.
3.1 Flattening with Ranking
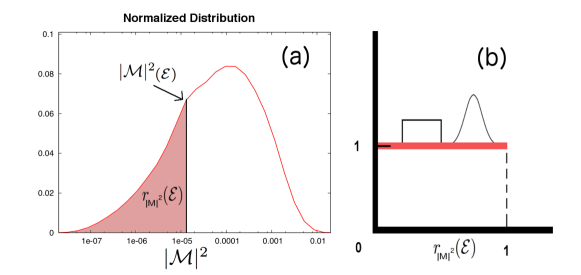
One approach is to take the normalized distribution, , for some kinematic variable, , and define a “ranking” variable,
| (1) |
which is the cdf for the background with respect . The ranking, , of an arbitrary event, , is given by
| (2) |
In other words, the value of the ranking variable for the event, , is equal to the fraction of background events which have values of less than the value observed in the event . This is illustrated in figure 2(a); figure 2(b) reminds us that the background distribution of will be flat and that signals will be identified by departures from flatness. While this “flattening” procedure works for any variable, , the background matrix element will be a particularly sensitive choice for particle physics events, as it contains information about the resonance structure, spin correlations, etc. of the relevant background.
A useful property of is that it is easily calculated from Monte Carlo (MC) events, as one can simply obtain the value of for all of the events in a sample after detector simulation, etc. The fraction of events in the resulting list, , which have values less than a particular value, gives a good approximation of , that takes into account all experimental effects that are well-modeled at the MC level.
3.2 Flattening with Quantile Bins
We note that we can obtain quantile bins for , possibly in tandem with other variables, directly*** Quantile bins have previously been employed in studies of the LHC inverse problem [9]. . For a single variable, , we find values such that
| (3) |
For several variables , we also demand an equal number of expected events in each bin, e.g., in two dimensions, we choose values of : , , …, and values of : , , …, , such that
| (4) |
Thus we can consider kinematic variables, such as invariant mass or missing energy, in addition to a matrix-element-based variable. We show toy examples of this approach in figures 3 and 4, which depict the distribution of four-lepton events at the 8 TeV LHC. The two variables used here are the four-lepton invariant mass, , and the background MEKD value.
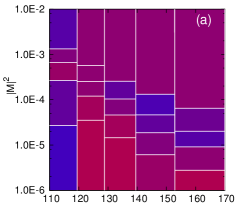
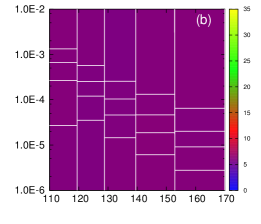
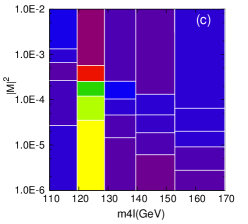
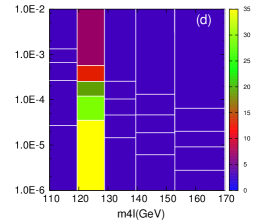
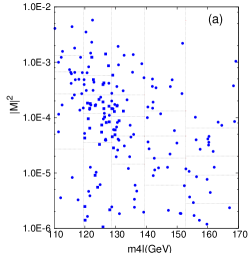
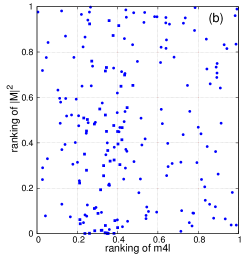
Figure 3 shows the results of a simulated experiment. We have analyzed the data using quantile bins in and , which were constructed using the background hypothesis. In each quantile bin, we plot either the number of events from background events (top row), or -GeV Higgs signal and background events (bottom row). The left column panels were obtained from one event pseudo-experiment, while the panels on the right were obtained from the average of such pseudo-experiments. Figure 4 also shows how flattening helps the eye tell whether an excess is due to signal. In this figure, the ratio of signal to background events has been changed from the realistic value 1:1 to the more challenging value of 1:3. Still, the presence of the new signal can be inferred, even by eye, due to the advantages in visualization obtained from the use of ranking variables.
3.3 Flattening with Respect to All the Variables
In principle, we can flatten the background distribution with respect to a complete set of kinematic variables. This can be done numerically (though one would expect this to be numerically challenging) or analytically, provided the analytic description of the background is sufficiently accurate.
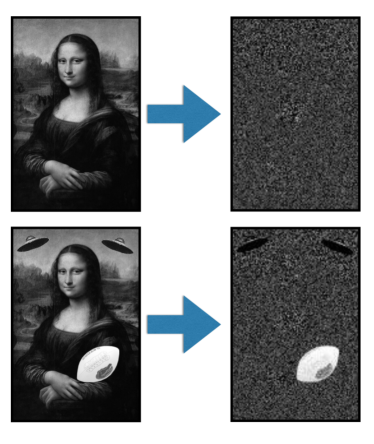
To be more precise, let the background (after detector simulation, etc.) be described by the differential distribution . Weighting each background event by , produces a distribution that is flat in the full -dimensional space of values. If data events are weighted according to this procedure, a signal will be visible as a deviation from flatness. We illustrate this procedure in figure 5.
4 Conclusions
Variables based on the background squared matrix element can be used to search for new physics signals at the LHC in a relatively model-independent way. We look forward to the use of such techniques in future LHC analyses.
ACKNOWLEDGEMENTS
J.G. and K.M. would like to thank their CMS colleagues for useful discussions. All of the authors would also like to thank D. Kim and T. LeCompte for stimulating conversations and L. da Vinci for assistance with figure 5. Work supported in part by U.S. Department of Energy Grant ER41990.
References
- [1] P. C. Bhat, Ann. Rev. Nucl. Part. Sci. 61, 281 (2011).
- [2] S. Chatrchyan et al. [CMS Collaboration], Phys. Lett. B 716, 30 (2012) [arXiv:1207.7235 [hep-ex]].
- [3] S. Chatrchyan et al. [CMS Collaboration], Phys. Rev. Lett. 110, 081803 (2013) [arXiv:1212.6639 [hep-ex]]; G. Aad et al. [ATLAS Collaboration], Phys. Lett. B 726, 120 (2013) [arXiv:1307.1432 [hep-ex]]; S. Chatrchyan et al. [CMS Collaboration], arXiv:1312.5353 [hep-ex].
- [4] K. Kondo, J. Phys. Soc. Jap. 57, 4126 (1988); K. Kondo, J. Phys. Soc. Jap. 60, 836 (1991); K. Kondo, T. Chikamatsu and S. H. Kim, J. Phys. Soc. Jap. 62, 1177 (1993); R. H. Dalitz and G. R. Goldstein, Phys. Rev. D 45, 1531 (1992); B. Abbott et al. [D0 Collaboration], Phys. Rev. D 60, 052001 (1999) [hep-ex/9808029]; J. C. Estrada Vigil, FERMILAB-THESIS-2001-07; M. F. Canelli, UMI-31-14921; V. M. Abazov et al. [D0 Collaboration], Nature 429, 638 (2004) [hep-ex/0406031]; J. S. Gainer, J. Lykken, K. T. Matchev, S. Mrenna and M. Park, arXiv:1307.3546 [hep-ph].
- [5] Y. Gao, A. V. Gritsan, Z. Guo, K. Melnikov, M. Schulze and N. V. Tran, Phys. Rev. D 81, 075022 (2010) [arXiv:1001.3396 [hep-ph]]; S. Bolognesi, Y. Gao, A. V. Gritsan, K. Melnikov, M. Schulze, N. V. Tran and A. Whitbeck, Phys. Rev. D 86, 095031 (2012) [arXiv:1208.4018 [hep-ph]].
- [6] P. Avery, D. Bourilkov, M. Chen, T. Cheng, A. Drozdetskiy, J. S. Gainer, A. Korytov and K. T. Matchev et al., Phys. Rev. D 87, no. 5, 055006 (2013) [arXiv:1210.0896 [hep-ph]]. M. Chen, T. Cheng, J. S. Gainer, A. Korytov, K. T. Matchev, P. Milenovic, G. Mitselmakher and M. Park et al., Phys. Rev. D 89, 034002 (2014) [arXiv:1310.1397 [hep-ph]].
- [7] D. Debnath, J. S. Gainer and K. T. Matchev, arXiv:1405.5879 [hep-ph].
- [8] J. Alwall, M. Herquet, F. Maltoni, O. Mattelaer and T. Stelzer, JHEP 1106, 128 (2011) [arXiv:1106.0522 [hep-ph]].
- [9] N. Arkani-Hamed, G. L. Kane, J. Thaler and L. -T. Wang, JHEP 0608, 070 (2006) [hep-ph/0512190].