Submillimeter Array Observations of Magnetic Fields in G240.31+0.07: an Hourglass in a Massive Cluster-forming Core
Abstract
We report the first detection of an hourglass magnetic field aligned with a well-defined outflow-rotation system in a high-mass star-forming region. The observations were performed with Submillimeter Array toward G240.31+0.07, which harbors a massive, flattened, and fragmenting molecular cloud core and a wide-angle bipolar outflow. The polarized dust emission at 0.88 mm reveals a clear hourglass-shaped magnetic field aligned within of the outflow axis. Maps of high-density tracing spectral lines, e.g., H13CO+ (4–3), show that the core is rotating about its minor axis, which is also aligned with the magnetic field axis. Therefore, both the magnetic field and kinematic properties observed in this region are surprisingly consistent with the theoretical predictions of the classic paradigm of isolated low-mass star formation. The strength of the magnetic field in the plane of sky is estimated to be 1.1 mG, resulting in a mass-to-magnetic flux ratio of 1.4 times the critical value and a turbulent to ordered magnetic energy ratio of 0.4. We also find that the specific angular momentum almost linearly decreases from pc to 0.03 pc scales, which is most likely attributed to magnetic braking.
1 Introduction
Massive stars tend to form in clusters, which arise from the collapse and fragmentation of molecular clouds (Elmegreen et al., 2000). In this process, self-gravity is certainly a necessity, since without it interstellar gas would not condense to form stars. However, a simplified theory dealing with the interplay between gravity and thermal pressure, e.g., the classic Jeans theory, fails to explain either the birth of massive stars nor the low rate of global star formation. The key question under debate is that which mechanism, turbulence or magnetic fields, plays a central role in counteracting with gravity (Mac-Low & Klessen, 2004; Crutcher, 2012). In the scenario of gravo-turbulent fragmentation (Klessen et al., 2005; Hopkins, 2013), supersonic turbulence controls the evolution of molecular clouds, producing a hierarchy of density structures; as turbulence decays locally, gravitational collapse sets in to give birth to a proto-cluster. Stars near the cloud center could accrete gas at a higher rate, thus they end up being more massive. Magnetic fields are implicitly weak in this scenario, and are predicted to show a chaotic morphology due to turbulent and dynamical twisting (e.g., Padoan et al., 2001). In contrast, magnetic fields are crucial in the classic theory of isolated low-mass star formation (Shu et al., 1987; Mouschovias & Ciolek, 1999). The theory assumes that molecular clouds are magnetically supported (e.g., Ostriker et al., 2001). In collapsing cores where star formation takes place, magnetic fields are pulled by gravity into an hourglass shape; cores contract more along magnetic fields, resulting in a flattened morphology perpendicular to the field axis, and a bipolar outflow is driven along the magnetic field from an accretion disk embedded within the core (Galli & Shu, 1993; Allen et al., 2003; Crutcher, 2006).
Observationally, hourglass magnetic fields aligned with bipolar outflows have been detected in a few low-mass objects (Girart et al., 2006; Stephens et al., 2013), though a recent study found that magnetic fields may be statistically misaligned with outflows (Hull et al., 2013). In the high-mass regime, several high-angular-resolution observations of polarized dust emission have revealed magnetic fields with a variety of morphologies (e.g., Tang et al. 2009a, ; Tang et al. 2009b, ; Girart et al., 2013; Qiu et al., 2013). Yet a single source, G31.41+0.31, has provided the most compelling evidence for an hourglass-like magnetic field (Girart et al., 2009); but the properties of gas kinematics and outflow structures are still unclear (Cesaroni et al., 2011; Moscadelli et al., 2013). Furthermore, there is hitherto no reported observational evidence for an hourglass magnetic field in a cluster-forming region.
Here we report Submillimeter Array111The SMA is joint project between the Smithsonian Astrophysical Observatory and the Academia Sinica Institute of Astronomy and Astrophysics and is funded by the Smithsonian Institution and the Academia Sinica. (SMA) observations toward G240.31+0.07 (hereafter G240), which is an active high-mass star-forming region with a bolometric luminosity of at a distance of 5.32 kpc (Choi et al., 2014). We detect a clear hourglass magnetic field threading a massive and flattened core that is powering a well-shaped bipolar outflow and fragmenting to form a proto-cluster.
2 Observations and Data Reduction
As part of an SMA polarization legacy project (Zhang et al., 2014), the observations were undertaken in five tracks, each with 2–4 hours on-source integration toward the phase referencing center (R.A., Dec.)J2000=(). During the observations the weather conditions were excellent, with mm precipitable water vapor, corresponding to atmospheric opacities at 225 GHz, , lower than 0.06. The detailed information of the observations is presented in Table 1. The correlator setup covers approximately 332–336 GHz in the lower sideband and 344–348 GHz in the upper sideband, with a uniform spectral resolution of 812.5 kHz (0.7 km s-1).
We performed basic data calibration, including bandpass, time dependent gain, and flux calibration, with the IDL MIR package, and output the data into MIRIAD for further processing. The intrinsic instrumental polarization was removed to a 0.1% accuracy with the MIRIAD task GPCAL. We jointly imaged the calibrated visibilities from all five tracks to make Stokes , , and maps. The continuum maps were made with a natural weighting of the visibilities to obtain an optimized sensitivity, leading to a synthesized beam of at FWHM and an rms noise level of 0.85 mJy beam-1 for Stokes , and 5 mJy beam-1 for Stokes ; the latter is affected by the limited dynamic range. The Stokes , maps were then combined to produce maps of the linear polarization intensity, the fractional polarization, and the polarization angle (P.A.). Spectral line maps were made with a compromise of angular resolution and sensitivity, and the synthesized beam is about and the rms noise level is mJy beam-1 per 0.8 km s-1. No significant polarization is detected in spectral lines, so only Stokes maps are presented.
3 Results
3.1 Magnetic field morphology
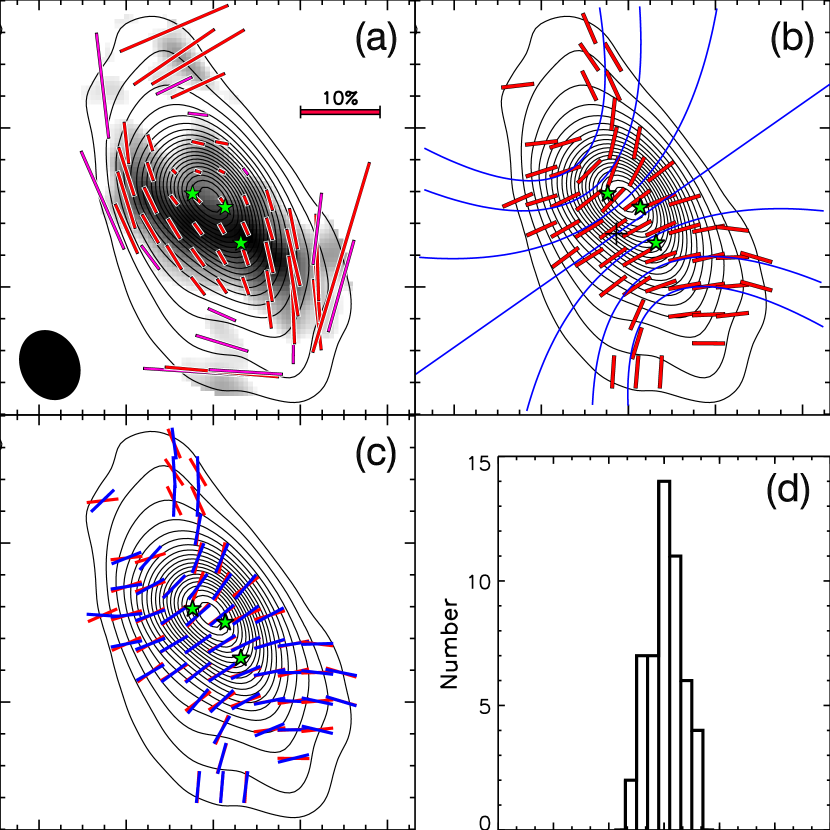
We observed G240 using the SMA in its Sub-compact, Compact, and Extended configurations. In Figure 1, the total dust emission (Stokes ) reveals a flattened core, which is embedded with at least three dense condensations previously detected at 1.3 mm at a 1′′ resolution (Qiu et al., 2009). The detected polarized emission has a butterfly-like distribution (Figure 1a), and the inferred magnetic field exhibits a clear hourglass shape aligned with the minor axis of the core (Figure 1b). We fit the magnetic field morphology with an analytical model of a series of parabolic functions (e.g., Girart et al., 2006; Rao et al., 2009). The fitted parameters are the position angle of the magnetic field axis , the center of symmetry of the magnetic field (R.A., Dec.)J2000=(), and for the parabolic form , where is the distance in units of arc second along the magnetic field axis from the center of symmetry. From Figure 1c, the best-fit model agrees well with the measured magnetic field. The residuals from the fit have a nearly Gaussian distribution, and yield a dispersion of (Figure 1d). Accounting for a measurement uncertainty of , the intrinsic dispersion of the polarization angle, , is .
3.2 Outflow and rotation
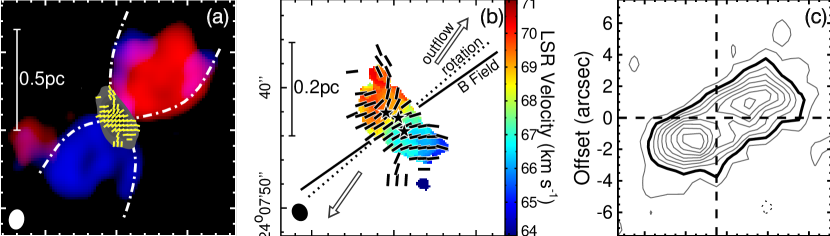
G240 harbors a well-shaped wide-angle outflow previously observed in CO (Qiu et al., 2009), and the position angle of the outflow axis is about . So the bipolar outflow is roughly aligned with (within ) the magnetic field axis (Figure 2a). It is already clear that we are observing an hourglass magnetic field in a massive cluster-forming core. We further investigate the kinematics of the dense gas by examining the simultaneously observed spectral lines. Figures 2b and 2c show the first moment map and the position-velocity (PV) diagram of the H13CO+ (4–3) emission: there is a clear velocity gradient along the major axis of the core. The velocity gradient is also detected in other high-density tracing spectral lines, and provides strong evidence for a rotating motion of the core. We perform a linear fit to the peak positions of the H13CO+ emission at each velocity channel, and derive a position angle of for the rotation axis, which is only offset from the magnetic field axis.
4 Discussion
4.1 The strength of the magnetic field
Using the Chandrasekhar-Fermi (CF) method (Chandrasekhar & Fermi, 1953), the strength of the magnetic field in the plane of sky, , can be estimated based on the P.A. dispersion, following , where is a parameter related to the cloud structure and is adopted to be 0.5 (Ostriker et al., 2001), is the turbulent velocity dispersion along the line of sight, and is the averaged mass density. In G240, is inferred to be (Section 3.1), and reaches 1.2 km s-1 from the H13CO+ (4–3) data. To estimate the mass density, we measure the total flux of the dust emission to be 1.4 Jy over an area of 60 square arc sec, where the emission is detected with S/N ratios above 3. With a dust temperature of 47 K (Hunter, 1997), a dust emissivity index of 1.5 (Chen et al., 2007), and a canonical gas-to-dust mass ratio of 100, the core mass amounts to 95 , leading to an averaged column density, , of cm-2 and a volume density, , of cm-3. Consequently, we deduce mG. Heitsch et al. (2001) show that the CF method is reliable to a factor of 2 for magnetic field strengths typical of molecular clouds, as long as the angular structure in the field is well resolved; limited angular resolutions lead to an overestimation of the field strength. Considering the presence of a velocity gradient across the core, the turbulent velocity dispersion inferred from the H13CO+ emission could be overestimated, resulting in an overestimation of the field strength. On the other hand, the plane-of-sky component of the field strength represents a lower limit to the total field strength. Thus, the CF method could still provide a reasonable estimate of the field strength, but the reliability needs to be verified.
Since the magnetic field has been pulled into an hourglass shape by the gravitational collapse, we can gauge the magnetic field strength from the observed curvature of the field lines. Considering the gravity and magnetic tension force acting on a field line, the magnetic field strength can be estimated following an equation derived by Schleuning (1998):
where is the radius of the curvature, is the distance from the field line to the symmetry center, is the mass, which we adopt a value of 125 including the gas mass and the mass of the forming massive stars (30 , Trinidad, 2011) deeply embedded within the core. From the farthest southwestern modeled line in Figure 1b, which has pc and pc, we obtain a field strength of 0.9 mG, which is in good agreement with the above estimate using the CF method.
4.2 The significance of the magnetic field
Assuming that the overall direction of the magnetic field in G240 is close to the plane of sky and approximates the total field strength, , we can assess the importance of the magnetic field compared to gravity, turbulence, and rotation. The key parameter that determines whether a magnetized core would gravitationally collapse is the mass-to-magnetic flux ratio. If the ratio is greater than the critical value, , where is the gravitational constant, the core is unstable and would collapse under its self-gravity (Nakano & Nakamura 1978). We find the ratio in G240 is about 1.4 times the critical value, taking into account both the gas mass and the stellar mass. The core is thus slightly supercritical, and the gravity has started to overcome the magnetic force to initiate the collapse. The turbulent to ordered magnetic energy ratio, , can be estimated from , where is the Alfvén velocity. With , we have , indicating that the ordered magnetic energy is dominating over the turbulent energy.
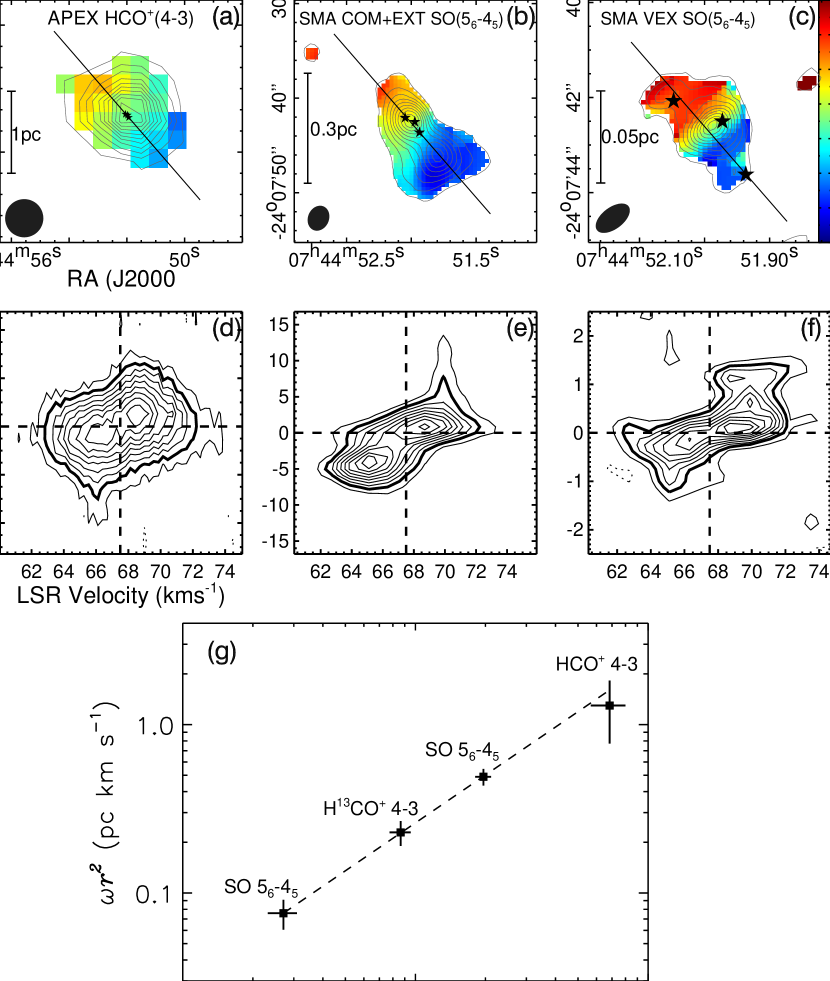
The core is observed to be rotating (Section 3.2). For a collapsing and rotating molecular cloud core threaded by a strong magnetic field, magnetic braking is expected to channel out part of the angular momentum of the infalling matter and cause the decrease in the specific angular momentum. To check this effect, we compare the H13CO+ data from this work with our new observations made with the SMA and the Atacama Pathfinder EXperiment (APEX). In Figures 3a–f, we show the first moment maps and PV diagrams of SO (–) and HCO+ (4–3). The SO maps were constructed from the SMA Very-Extended (VEX) observations and from the combined SMA Compact and Extended (COM+EXT) observations, resulting in angular resolutions of and , respectively. The APEX HCO+ data have an angular resolution of . A velocity gradient consistent with what is shown in Figure 2 is seen on all the maps. We measure the rotation velocities by applying the terminal velocity method (Sofue & Rubin, 2001), where the terminal velocity, , is determined from the PV diagram by a velocity at which the intensity equals to 20% of the peak intensity (e.g., Liu et al., 2013). To mitigate the optical depth effect and the confusion from the gas in outer layers along the line of sight, we only measure the outermost half beam at FWHM of each PV diagram. With all the data, including the H13CO+ observations shown in Figure 2, we obtain on –0.6 pc, where the radius, , is the distance from the center of the core along the PV cut, allowing us to examine how the specific angular momentum, , where () is the angular velocity, changes with the radius. In Figure 3, does decrease toward the center. A power-law fit to the data yields a dependence of the angular momentum on the radius, which is very likely attributed to magnetic braking.
In a numerical study, magnetic braking acts to align the rotation axis and magnetic field, while the rotation causes the magnetic field to incline through dynamo action (Machida et al., 2006). When the ratio of the angular velocity to magnetic field strength, , is smaller than a characteristic value of , the former effect dominates the latter. In G240, the rotation axis is observed to be closely aligned with the magnetic field direction (Figure 2b), suggesting that magnetic braking is more important. Indeed, with year-1 from the H13CO+ data and km s-1, is year, smaller than the characteristics value of year. Hence, magnetic braking, if it is at work as manifested by the decrease of the specific angular momentum toward the center (e.g., Girart et al., 2009), should be dominating over the rotation in shaping the dynamics of the core.
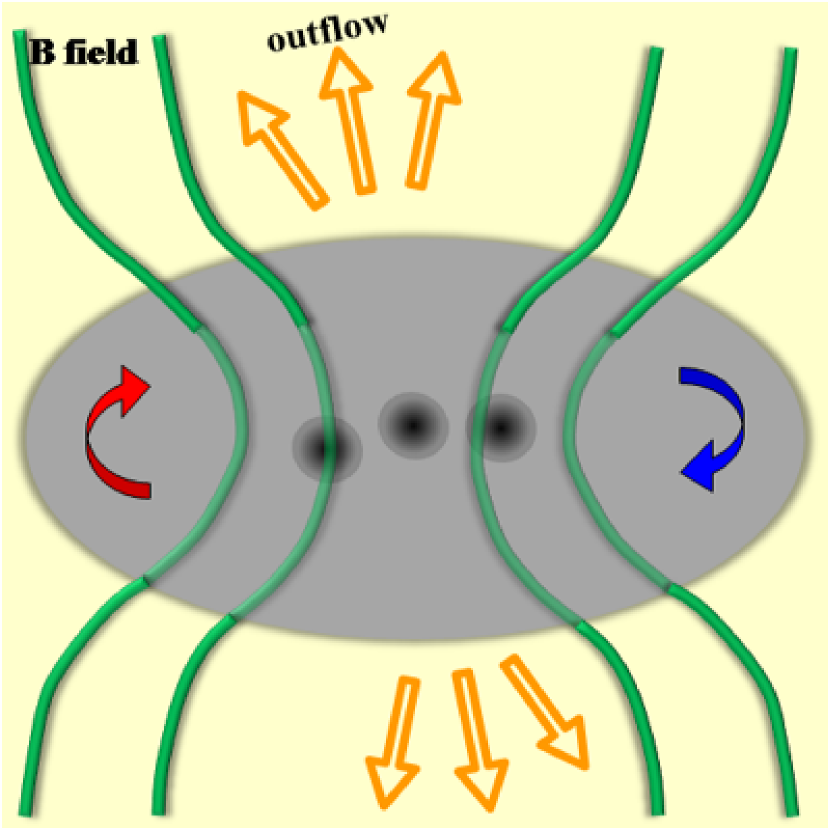
We summarize the observed magnetic field and kinematic properties in G240 in Figure 4. The picture is surprisingly consistent with the theoretical predictions of the classic paradigm of isolated low-mass star formation (Crutcher, 2006; Gonçalves et al., 2008; Frau et al., 2011), except that G240 is a luminous and massive star-forming core and shows a higher degree of fragmentation. It is the first time that a clear hourglass magnetic field aligned with a well-defined outflow-rotation system is detected in the high-mass regime. Our observations provide strong evidence that massive star and cluster formation in G240 is proceeding in a way essentially similar to the formation of Sun-like stars. We also find that the magnetic field dominates over turbulence in shaping the dynamics of the massive core. The nearly linear decrease of the specific angular momentum toward the center suggests that magnetic braking is at work and overcomes the centrifugal force to align the rotation axis.
References
- Allen et al. (2003) Allen, A., Shu, F. H., & Shu, F. H. 2003, ApJ, 599, 351
- Cesaroni et al. (2011) Cesaroni, R., Beltrán, M., Zhang, Q., Beuther, H., & Fallscheer, C. 2011, A&A, 533, 73
- Chandrasekhar & Fermi (1953) Chandrasekhar, S. & Fermi, E. 1953, ApJ, 118, 113
- Chen et al. (2007) Chen, H.-R. et al. 2007, ApJ, 654, L87
- Choi et al. (2014) Choi, Y. K. et al. 2014, ApJ, 790, 99
- Crutcher (2006) Crutcher, R. 2006, Science 313, 771
- Crutcher (2012) Crutcher, R. 2012, ARA&A, 50, 29
- Elmegreen et al. (2000) Elmegreen, B. G., Efremov. Y., Pudritz, R. E. & Zinnecker, H. 2000, in Protostars and Planets IV, ed. V. Mannings et al. (Tucson: Univ. Arizona Press)
- Frau et al. (2011) Frau, P., Galli, D., & Girart, J. M. 2011, A&A, 535, 44
- Galli & Shu (1993) Galli, D. & Shu, F. H. 1993, ApJ, 417, 220
- Girart et al. (2009) Girart, J. M., Beltrán, M. T., Zhang, Q., Rao, R., & Estalella, R. 2009, Science, 324, 1408
- Girart et al. (2013) Girart, J. M. et al. 2013, ApJ, 772, 69
- Girart et al. (2006) Girart, J. M., Rao, R., & Marrone, D. P. 2006, Science, 313, 812
- Gonçalves et al. (2008) Gonçalves, J., Galli, D., & Girart, J. M. 2008, A&A, 490, L39
- Heitsch et al. (2001) Heitsch, F., Zweibel, E. G., Mac Low, M.-M., Li, P, & Norman, M. L. 2001, ApJ, 561, 800
- Hopkins (2013) Hopkins, P. F. 2013, MNRAS, 430, 1653
- Hull et al. (2013) Hull, C. L. H. et al. 2013, ApJ, 768, 159
- Hunter (1997) Hunter, T. R. 1997, PhD thesis, California Institute of Technology
- Klessen et al. (2005) Klessen, R. S., Ballesteros-Paredes, J., Vázquez-Semadeni, E. & Durán-Rojas, C. 2005, ApJ, 620, 786
- Liu et al. (2013) Liu, H. B., Zhang, Q., Girart, J. M., & Ho, P. T. P. 2013, ApJ, 771, 71
- Machida et al. (2006) Machida, M. N., Matsumoto, T., Hanawa, T., & Tomisaka, K. 2006, MNRAS, 645, 1227
- Mac-Low & Klessen (2004) Mac-Low, M.-M. & Klessen, R. S. 2004, Review of Modern Physics, 76, 125
- Moscadelli et al. (2013) Moscadelli, L. et al. 2013, A&A, 549, 122
- Mouschovias & Ciolek (1999) Mouschovias, T.C. & Ciolek, G. E. 1999, in The Origin of Stars and Planetary Systems, ed. Lada, C. J. & Kylafis, N. D. (Kluwer Academic, Dordrecht, Netherlands)
- Ostriker et al. (2001) Ostriker, E. C., Stone, J. M., & Gammie, C. F. 2001, ApJ, 546, 980
- Padoan et al. (2001) Padoan et al. 2001, ApJ, 559, 1005
- Qiu et al. (2013) Qiu, K., Zhang, Q., Menten, K. M., Liu, H. B., & Tang, Y.-W. 2013, ApJ, 779, 182
- Qiu et al. (2009) Qiu, K., Zhang, Q., Wu, J., & Chen, H.-R. 2009, ApJ, 696, 66
- Rao et al. (2009) Rao, R., Girart, J. M., Marrone, D. P., Lai, S.-P., & Schnee, S. 2009, ApJ, 707, 921
- Schleuning (1998) Schleuning, D. A. 1998, ApJ, 493, 811
- Shu et al. (1987) Shu, F. H., Adams, F. C., & Lizano, S. 1987, ARA&A, 25, 23
- Sofue & Rubin (2001) Sofue, Y. & Rubin, V. 2001, ARA&A, 39, 137
- Stephens et al. (2013) Stephens, I. W. et al. 2013, ApJ, 769, L15
- (34) Tang, Y. W. et al. 2009a, ApJ, 695, 1399
- (35) Tang, Y. W. et al. 2009b, ApJ, 700, 251
- Trinidad (2011) Trinidad, M. A. 2011, AJ, 142, 147
- Zhang et al. (2014) Zhang, Q. et al. 2014, ApJ, 792, 116
| Date of | Array | Bandpass | Gain | Flux | |
|---|---|---|---|---|---|
| ObservationsaaThe number in the parentheses indicates the on-source integration time in units of hours for each observation. | ConfigurationbbThe number in the parentheses denotes the number of available antennas during each observation. | CalibratorccAlso used for instrumental polarization (leakage) calibrations. | Calibrator | Calibrator | |
| 2011 Oct. 17 (4.0) | Compact (7) | 0.03 | 3C84 | J0730-116 | Callisto |
| 2011 Dec. 10 (3.5) | Compact (8) | 0.05 | 3C84 | J0730-116 | Titan |
| 2012 Jan. 06 (3.5) | Subcompact (6) | 0.06 | 3C279 | J0730-116 | Canymede |
| 2012 Feb. 02 (3.5) | Extended (7) | 0.05 | 3C279 | J0730-116 | Callisto |
| 2012 Mar. 27 (2.5) | Extended (7) | 0.08 | 3C279 | J0730-116 | 3C279 |