Universality of citation distributions for academic institutions and journals
Abstract
Citations measure the importance of a publication, and may serve as a proxy for its popularity and quality of its contents. Here we study the distributions of citations to publications from individual academic institutions for a single year. The average number of citations have large variations between different institutions across the world, but the probability distributions of citations for individual institutions can be rescaled to a common form by scaling the citations by the average number of citations for that institution. We find this feature seem to be universal for a broad selection of institutions irrespective of the average number of citations per article. A similar analysis for citations to publications in a particular journal in a single year reveals similar results. We find high absolute inequality for both these sets, Gini coefficients being around and for institutions and journals respectively. We also find that the top % of the articles hold about % of the total citations for institutions and the top % of the articles hold about % of the total citations for journals.
Introduction
Statistical physics tells us that systems of many interacting dynamical units collectively exhibit a behavior which is determined by only a few basic dynamical features of the individual units and of the embedding dimension but independent of all other details. This feature which is specific to critical phenomena, like in continuous phase transitions, is known as universality stanley1971introduction . There is enough empirical evidence that a number of social phenomena are characterized by simple emergent behavior out of the interactions of many individuals. In recent years, a growing community of researchers have been analyzing large-scale social dynamics to uncover universal patterns and also trying to propose simple microscopic models to describe them, similar to the minimalistic models used in statistical physics. These studies have revealed interesting patterns and behaviors in social systems, e.g., in elections fortunato2007scaling ; chatterjee2013universality ; mantovani2011scaling , growth in population rozenfeld2008laws and economy stanley1996scaling , income and wealth distributions chakrabarti2013econophysics , financial markets mantegna2000introduction , languages petersen2012statistical , etc. (see Refs. Castellano:2009 ; Sen:2013 for reviews).
Academic publications (papers, books etc.) form an unique social system consisting of individual publications as entities, containing bibliographic reference to other older publications, and this is commonly termed as citation. The number of citations is a measure of the importance of a publication, and serve as a proxy for the popularity and quality of a publication. There has already been a plethora of empirical studies on citation data Sen:2013 , specifically on citation distributions Shockley:1957 ; Laherrere:1998 ; Redner:1998 ; Radicchi:2008 of articles, time evolution of probability distribution of citation Rousseau:1994 ; Egghe:2000 ; Burrell:2002 , citations for individuals Petersen:2011 and even their dynamics Eom:2011 , and the modeling efforts on the growth and structure of citation networks have produced a huge body literature in network science concerning scale-free networks Price:1965 ; barabasi1999emergence ; caldarelli2007scale , and long-time scientific impact wang2013quantifying .
The bibliometric tool of citation analysis is becoming increasingly popular for evaluating the performance of individuals, research groups, institutions as well as countries, the outcomes of which are becoming important in case of offering grants and awards, academic promotions and ranking, as well as jobs in academia, industry and otherwise. Since citations serve as a crucial measure for the importance and impact of a research publication, its precise analysis is extremely important. Annual citations and impact factor of journals are of key interest, primarily from the point of view of journals themselves, and secondarily from the perspective of authors who publish their papers in them. Wide distributions of both annual citations and impact factors are quite well studied Popescu:2003 ; Mansilla:2007 ; khaleque2014evolution . It is quite usual to find that some publications do better than others due to the inherent heterogeneity in the quality of their content, the gross attention on the field of research, the relevance to future work and so on. Thus different publications gather citations in time at different rates and result in a broad distribution of citations. In 1957, Shockley Shockley:1957 claimed that the scientific publication rate is dictated by a lognormal distribution, while a later evidence based on analysis of records for highly cited physicists claim that the citation distribution of individual authors follow a stretched exponential Laherrere:1998 . However, an analysis of data from ISI claims that the tail of the citation distribution of individual publications decays as a power law with an exponent close to Redner:1998 , while a rigorous analysis of 110 years of data from Physical Review concluded that most part of the citation distribution fits remarkably well to a lognormal Redner:2005 . The present consensus lies with the fact that while most part of the distribution does fit to a lognormal, the extreme tail fits to a power law peterson2010nonuniversal .
It has been shown earlier Radicchi:2008 that the distribution of citations to papers within a discipline has a broad distribution, which is universal across broad scientific disciplines, using a relative indicator , where is the average citation within a discipline. However, it has also been shown later that this universality is not absolutely guaranteed waltman2012universality . Subsequent work on citations radicchi2011rescaling ; radicchi2012reverse and impact factors kaur2013universality has revealed interesting patterns of universality, some alternative methods have been proposed li2013quantitative and there are also interesting work on citation biases radicchi2012reverse . Some studies albarran2011references ; albarran2011skewness also report on the possible lack of universality in the citation distribution at the level of articles. A rigorous and detailed study on the citation distributions of papers published in 2005-2008 for 500 institutions private reveals that using the analysis Ref. Radicchi:2008 , universality condition is not fully satisfied, but the distributions are found to be very similar. There have also been studies at the level of countries in the same direction albarran2013differences .
In this article, we focus on citations received by individual (i) academic institutions and (ii) academic journals. We perform the analysis primarily for all articles and reviews, as well as all citable documents. While institutions can vary in their quality of scientific output measurable in terms of total number of publications, total citations etc., here we show for the first time that irrespective of the institution’s scientific productivity, ranking and research impact, the probability that the number of citations received by a publication is a broad distribution with an universal functional form. In fact, using a relative indicator , where is the average number of citations to articles published by an institution in a certain year, we show that the effective probability distribution function that an article has citations has the same mathematical form. We present evidence for the fact that this holds roughly across time for most institutions irrespective of the scientific productivity of the institution considered. When we carry out a similar analysis on journals, we find similar results. The scaled distributions fit to a lognormal distribution for most of their range. Again, we find that these features roughly hold across time and across journals within the same class. The largest citations for academic institutions as well as the journals seem to fit well to a power law. We also present evidence that each of these sampled groups – institutions, and journals are distinct with the absolute measure of inequality as computed from their distribution functions, with high absolute inequality for both these sets, the Gini coefficients being around and for institutions and journals respectively. We also find that the top % of the articles fetch about % of the total citations for institutions and the top % of the articles fetch about % of the total citations for journals.
Methods
Data
We collected data from 42 academic institutions across the world. Institutions were selected such that they produce considerable amount of papers (typically 200 or more) so that reasonable statistics could be obtained. However, there were exceptions for certain years for particular institutions. All papers published with at least one author with the institution mentioned as affiliation were collected. This was done for 4 years – 1980, 1990, 2000, 2010. We also selected 30 popular academic journals across physics, chemistry, biology and medicine. However, for some journals, only 3 years of data could be collected, since they were launched after 1980. The citable papers considered in this study are articles and reviews, although we compare the results with the same analysis done on all citable documents.
I Results
We study the data of number of citations to publications from different years, from ISI Web of Science ISI for several (i) academic institutions (research institutes and universities) and (ii) popular journals. It is to be noted that citations to individual publications arrive from any publication indexed in ISI Web of Science and does not mean only internal citations within the journal in which it is published. We analyzed data of science publications from 42 academic institutions and 30 popular journals. We recorded the data for the number of papers published, the total number of citations to each of the publications, for a few years (1980, 1990, 2000, 2010 for most cases). Since citations grow with time, we have studied publications which are at least 4 years old (from 2010) or more (1980, 1990, 2000) to rule out any role of transients. We also collect data from academic institutions and journals which have a comparatively large number of publications, so as to produce good statistics, and minimize the effects of aberration that can result from fluctuations of the quantities measured from small data sets.
I.0.1 Citations for academic institutions
We collected citation data until date for all articles and reviews from a particular year (e.g. 1980, 1990, 2000, 2010). For each year, the probability distribution of citations for an academic institution was observed to be broad. For instance, Fig. 1A shows the plot of vs. for various institutions for publications from 1990. We rescaled the absolute value of citation for each year by the average number of citations per publication , and plotted this quantity against the adjusted probability (Fig. 1B) (see similar plots for 1980 and 2000 in Fig. S1 of SI). We remarkably find that the distributions collapse into an universal curve irrespective of the wide variation in the academic output of the different institutions. The scaling collapse is good for more than 3 decades of data and over 5 orders of magnitude. The average number of papers, total citations and the average number of citations per publication are shown in Table S3. The rescaled curves fit well to a lognormal
| (1) |
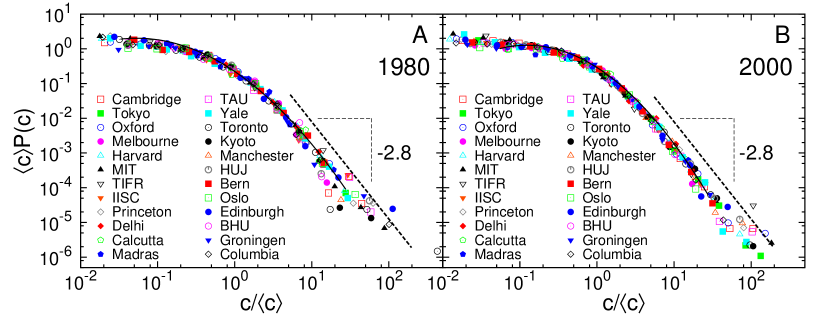
with with , for a considerable range of the distribution. However, if one fits a lognormal distribution to individual sets, the range of parameters are quite narrow, lies in the range to , while lies in the range to . The fitting were performed using a least square fitting routine. For lowest values of the abscissa, seems to follow or slowly growing, as . However, the largest citations deviate from the lognormal fit and are better described according to , with (see SI Table S6 for exponents for other years). The power law exponent has been estimated using the maximum likelihood estimate method (MLE) clauset:2009 . In order to investigate if the distributions for different institutes vary with time, we plot the same for each institution for several years. The rescaled plots show scaling collapse indicating that although the average citations vary over years, the form of the distribution function remain roughly invariant, when scaled with the average number of citations. Fig. 2 shows the plot for 1990. To check if this also holds for time-aggregated data, we collected citations for all papers published during the period 2001-2005 for the same set of institutions, and repeated the above analysis (see SI. Fig. S2).
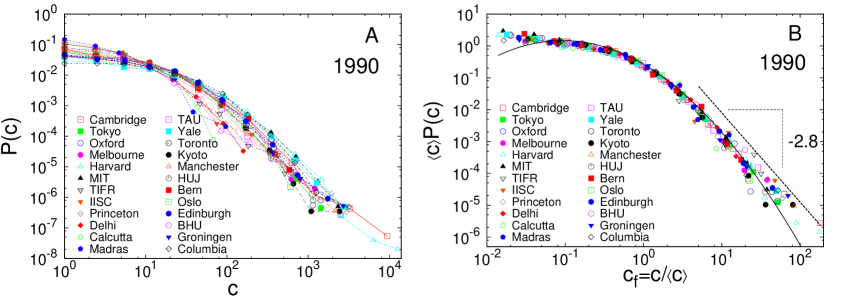
(A) Probability distribution of citations to publications from 1990 for several academic institutions. (B) The same data rescaled by average number of citations . The data for different institutions seem to follow the same scaling function. It fits very well to a lognormal function for most of its range, with , . The largest citations do not follow the lognormal behavior, and seem to follow a power law: , with .
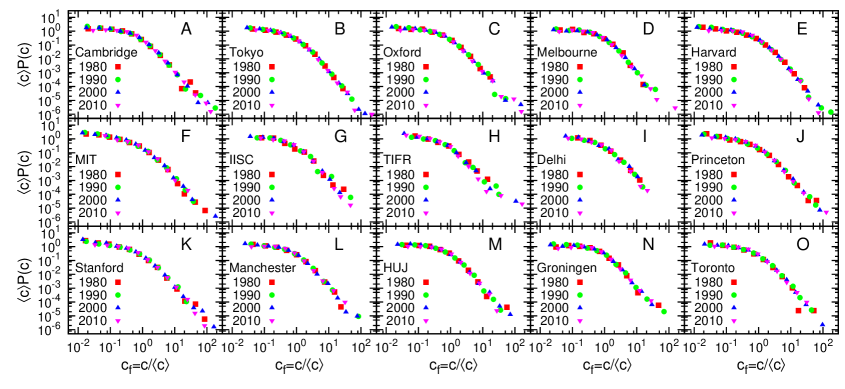
Probability distribution of citations rescaled by average number of citations to publications from 4 different years (1980, 1990, 2000, 2010) for several academic institutions. For any institution, the data for different years seem to follow the same distribution.
I.0.2 Citations for journals
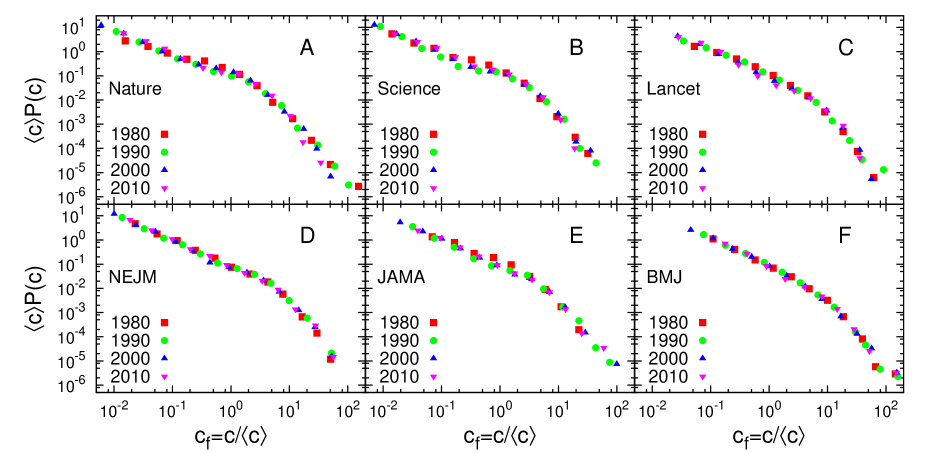
We collected citation data until date for all articles and reviews in individual journals for several years (e.g. 1980, 1990, 2000, 2010 etc.). For each year, the probability distribution of citations was again observed to be broad. As in the case of institutions, we plotted against the adjusted probability (Fig. 3). For a particular journal, it is observed that the curves follow similar distributions over years although the average number of papers, total citations and hence the average number of citations vary (See Table S4 in SI for details). Further, we plot the same quantity for a particular year for different journals (see Fig. 4 for 1990), and find that the curves roughly collapse into an single curve irrespective of the wide variation in the output of the different journals. The bulk of the rescaled distribution fits well to a lognormal form with and , as was observed in case of institutions, while the largest citations fit better to a power law , with (see SI Table S6 for exponents for other years). To check if this also holds for time-aggregated data, we collected citations for all papers published during the period 2001-2005 for the same set of journals and repeated the analysis (see SI. Fig. S4).
However, we observed that if we consider all citable documents, two distinct classes of journals emerge according to the shape of the distributions to which the curves collapse. The first group is a General class, for which most of the distribution fits well to a lognormal function even quite well for the lowest values of the abscissa. This is similar to what is observed for all journals if we consider only articles and reviews. The other group, which we call the Elite class (SI Fig. S5) is also broadly distributed but has a distinct and faster monotonic decay compared to the General class, where , i.e., with . This divergence at the lowest values of citations also indicate that the Elite journals have a larger proportion of publications with less number of citations although their average number of citations is larger than those for the general class. However, for both the above classes, the largest citations still follow a power law , with for the General class and for the Elite class. We reason for such a behavior in the Elite journal class is because of a large fraction of uncited documents. If we consider only articles and reviews, is usually 2-10%. Considering all citable documents, this fraction does not change appreciably for the Elite class of journals, and can be anything in the range 25-80% (see values of in SI Table S5), and are primarily in the category of news, correspondence, editorials etc. Such documents in the General class is either absent or are very few. We are able to find at least 7 journals (see SI Fig. S5 and Table S5) in the Elite class while most of others belong to the General class.
The power law tail in all distribution suggests that the mechanism behind the popularity of the very highly cited papers is a ‘rich gets richer’ phenomena Merton:1968 ; Price:1976 ; barabasi1999emergence (see Fig. S3 of SI for 1980 and 2000).
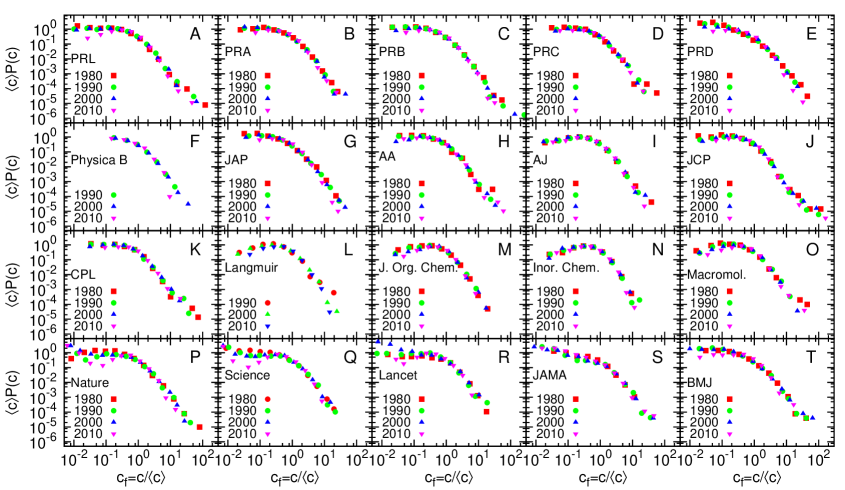
Probability distribution of citations rescaled by average number of citations to publications from from 4 different years (1980, 1990, 2000, 2010) for several academic journal. For any journal, the data for different years seem to follow the same distribution.
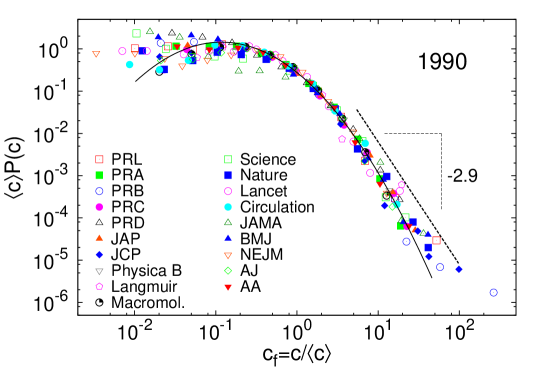
Probability distribution of citations rescaled by average number of citations to publications from 1990 for several academic journals. The scaled distribution fucntion fits to a lognormal function with , , while as for the lower range of . The largest citations fit well to a power law: , with .
I.0.3 Justification for using
Following Ref. Radicchi:2008 , we rank all articles belonging to different institutions according to and . We then compute the percentage of publications of each institution that appear in the top % of the global rank. The percentage for each should be around % with small fluctuations if the ranking is good enough. The same is performed for journals. When ranking is done according to unnormalized citations then the frequency distribution of % of papers is wide. However, if the ranking is done according to normalized citations , then the frequency distribution is much narrow. For example, we show the results for institutions and journals in Fig. 5 if %. Assuming that articles are uniformly distributed on the rank axis, the expected average bin height must be z% with a standard deviation given by
| (2) |
where is the number of entries (institutions or journals) and is the number of papers for the -th institution or journal. For institutions, when the ranking is done according to we observe that the theoretically calculated value (from above equation) of is compared to as computed directly from the fitting, while if the ranking was done according to , is . Similarly for journals, computed from the above equation is compared to as computed from the fitting, while if the ranking was done according to , is . This indicates that is indeed an unbiased indicator, as seen earlier Radicchi:2008 ; waltman2012universality .
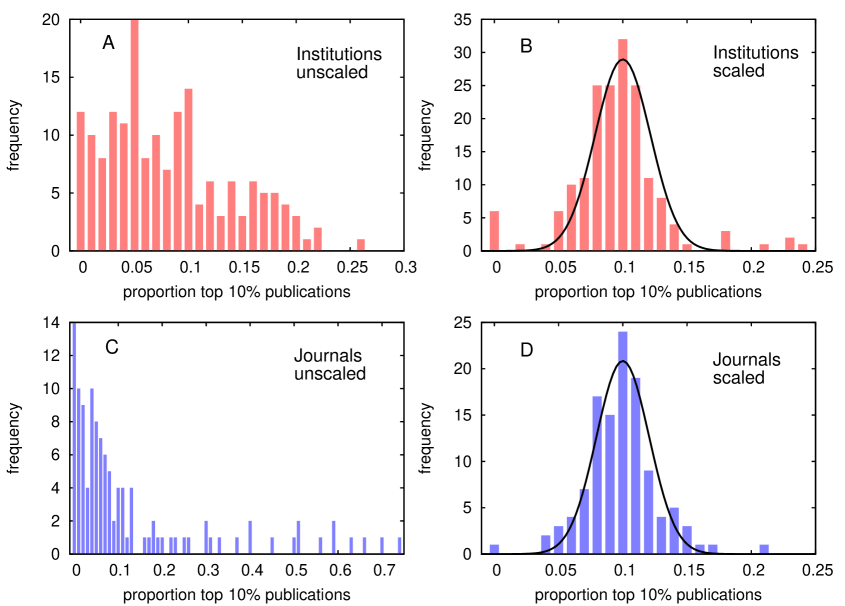
Histograms for the percentage of publications of each institution that appear in the top 10% of the global rank, computed from the (A) unscaled and (B) scaled data. Same for the percentage of publications of each journal that appear in the top 10% of the global rank, computed from the (C) unscaled and (D) scaled data. A normal distribution fit to the scaled data gives for institutions and for journals.
I.0.4 Measuring inequality
We calculate absolute measures of inequality like the commonly used Gini index gini1921measurement as well as the -index ghosh2014inequality ; inoue2014measuring which tells us that the top cited fraction of papers have fraction of citations, and we report in SI Tables. S3, S4, S5. For academic institutions, Gini index and , which means around citations come from the top papers. For journals, , which means about citations come from the top papers.
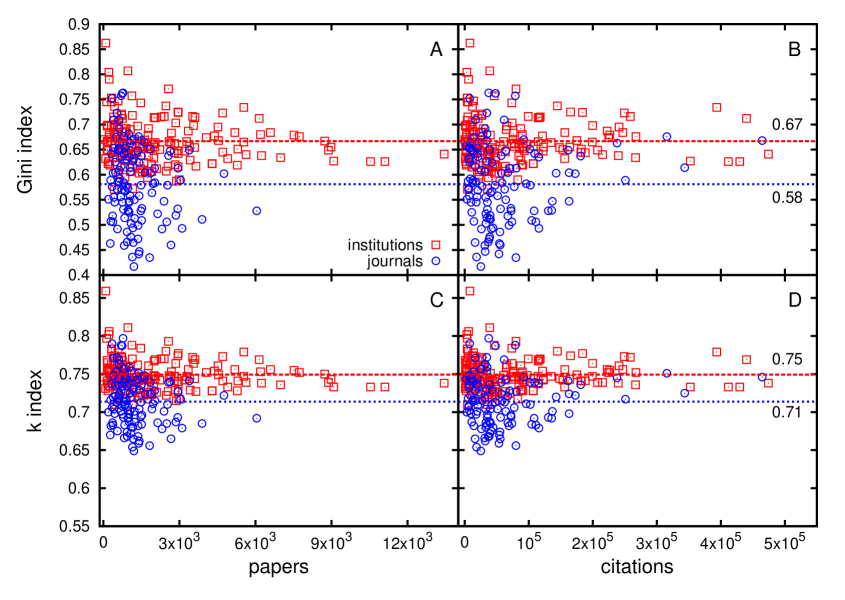
Variation of Gini and indices with number of papers and citations for academic institutions and journals. For larger number of papers or citations, the values seem to fluctuate less or converge around the mean values and respectively. For academic institutions, the values are for Gini and , while for the journals, the values are and .
We further note that Gini and indices fluctuate less around respective mean values and as the number of articles and number of citations become large (Fig. 6). For academic institutions, the values are for Gini and . For journals, the values are and .
II Discussions
In this article we analyze whether the citations to science publications from academic institutions (universities, research institutes etc.) as well as journals are distributed according to some universal function when rescaled by the average number of citations. For institutions, it seems to fit roughly to a log-normal function. The largest citations, however, deviate from the lognormal fit, and follow a power law decay. This rough universality claim is an interesting feature, since for institutions, the quality of scientific output measurable in terms of the total number of publications, total citations etc. vary widely across the world as well as in time. Nevertheless, the way in which the number of papers with a certain number of citations is distributed is quite similar private , seems to be quite independent of the quality of production/output of the academic institution. Although there has been claims that the form of the distribution of citations for different scientific disciplines are the same Radicchi:2008 , albeit deviations waltman2012universality , it is also true that each discipline is characterized by a typical average number of citations . As a matter of fact, that different institutions have a varying strength of publication contribution towards different disciplines makes the issue of obtaining a universal function for the resulting (effective) distribution of citations (for the institution) quite nontrivial. In other words, different academic institutions have a variety in the strength of their academic output, in terms of variation of representations across different disciplines and the amount of citations gathered. This does not necessarily guarantee that the universality which has been already reported across disciplines Radicchi:2008 will still hold when one looks at data from different institutions, rest aside the counter claims about lack of universal character waltman2012universality for citation distribution across distinct disciplines. There are already critical studies on the citation distribution of universities private using larger data sets, which raises issues on the nature of universality.
We observe similar features for academic journals – the bulk of the probability distribution fitting reasonably well to a lognormal while the highest cited papers seem to fit well to a power law decay with a similar exponent (). We note that the exponents are consistently less than , the exponent of the full citation distribution Redner:1998 , which is due to the fact that our data are very small subsets, which fall short of catching the correct statistical behavior of all of the highest cited papers.
Our results indicate that dividing citation counts by their average indeed helps to get closer to universal citation distributions. However, the results also indicate that, even after such a rescaling, are substantially larger than the theoretical values – compared to while it is for unscaled data for institutions and compared to while it is for unscaled data for journals. This indicates that the universality is not very strong, and holds only in an approximate sense. Ref. private shows similar evidence for institutions, claiming the absence of universality but pointing out the similarity between the distributions. Another previous study waltman2012universality on different fields of science also reported that this universality claim does not hold very well for all fields.
We further note that the inequality in the distribution of citations of institutions and journals differ quantitatively. As the number of papers and citations increase, the absolute measures of inequality like Gini and indices seem to converge to different values for the above two sets. The values of Gini index are and for institutions and journals respectively. The index values suggest that the top % of the articles hold about % of the total citations for institutions and the top % of the articles hold about % of the total citations for journals.
Acknowledgments
The authors thank S. Biswas for discussions, J.-I. Inoue, S. Redner and P. Sen for useful comments. A.C. and B.K.C. acknowledge support from B.K.C.’s J. C. Bose Fellowship Research Grant.
References
- (1) Stanley HE (1971) Introduction to Phase Transitions and Critical Phenomena. Oxford Univ. Press, Oxford and New York.
- (2) Fortunato S, Castellano C (2007) Scaling and universality in proportional elections. Phys Rev Lett 99: 138701.
- (3) Chatterjee A, Mitrović M, Fortunato S (2013) Universality in voting behavior: an empirical analysis. Sci Reports 3: 1049.
- (4) Mantovani MC, Ribeiro HV, Moro MV, Picoli Jr S, Mendes RS (2011) Scaling laws and universality in the choice of election candidates. Europhys Lett 96: 48001.
- (5) Rozenfeld HD, Rybski D, Andrade JS, Batty M, Stanley HE, et al. (2008) Laws of population growth. Proc Natl Acad Sci 105: 18702–18707.
- (6) Stanley MHR, Amaral LAN, Buldyrev SV, Havlin S, Leschhorn H, et al. (1996) Scaling behaviour in the growth of companies. Nature 379: 804–806.
- (7) Chakrabarti BK, Chakraborti A, Chakravarty SR, Chatterjee A (2013) Econophysics of income and wealth distributions. Cambridge Univ. Press, Cambridge.
- (8) Mantegna RN, Stanley HE (2000) Introduction to econophysics: correlations and complexity in finance. Cambridge Univ. Press, Cambridge.
- (9) Petersen AM, Tenenbaum J, Havlin S, Stanley HE (2012) Statistical laws governing fluctuations in word use from word birth to word death. Sci Reports 2: 313.
- (10) Castellano C, Fortunato S, Loreto V (2009) Statistical physics of social dynamics. Rev Mod Phys 81: 591–646.
- (11) Sen P, Chakrabarti BK (2013) Sociophysics: An Introduction. Oxford University Press, Oxford.
- (12) Shockley W (1957) On the statistics of individual variations of productivity in research laboratories. Proc IRE 45: 279–290.
- (13) Laherrere J, Sornette D (1998) Stretched exponential distributions in nature and economy:“fat tails” with characteristic scales. Eur Phys J B 2: 525–539.
- (14) Redner S (1998) How popular is your paper? an empirical study of the citation distribution. Eur Phys J B 4: 131–134.
- (15) Radicchi F, Fortunato S, Castellano C (2008) Universality of citation distributions: Toward an objective measure of scientific impact. Proc Nat Acad Sci 105: 17268–17272.
- (16) Rousseau R (1994) Double exponential models for first-citation processes. Scientometrics 30: 213–227.
- (17) Egghe L (2000) A heuristic study of the first-citation distribution. Scientometrics 48: 345–359.
- (18) Burrell QL (2002) The nth-citation distribution and obsolescence. Scientometrics 53: 309–323.
- (19) Petersen AM, Stanley HE, Succi S (2011) Statistical regularities in the rank-citation profile of scientists. Sci Rep 1: 181.
- (20) Eom YH, Fortunato S (2011) Characterizing and modeling citation dynamics. PloS one 6: e24926.
- (21) Price DdS (1965) Networks of scientific papers. Science 149: 510-515.
- (22) Barabási AL, Albert R (1999) Emergence of scaling in random networks. Science 286: 509-512.
- (23) Caldarelli G (2007) Scale-free networks: complex webs in nature and technology. Oxford Univ. Press, UK.
- (24) Wang D, Song C, Barabási AL (2013) Quantifying long-term scientific impact. Science 342: 127–132.
- (25) Popescu II (2003) On a zipf’s law extension to impact factors. Glottometrics 6: 83–93.
- (26) Mansilla R, Köppen E, Cocho G, Miramontes P (2007) On the behavior of journal impact factor rank-order distribution. J Informetrics 1: 155–160.
- (27) Khaleque A, Chatterjee A, Sen P (2014) On the evolution and utility of annual citation indices. arXiv preprint arXiv:14031745 .
- (28) Redner S (2005) Citation statistics from 110 years of physical review. Phys Today 58: 49.
- (29) Peterson GJ, Pressé S, Dill KA (2010) Nonuniversal power law scaling in the probability distribution of scientific citations. Proc Nat Acad Sci 107: 16023–16027.
- (30) Waltman L, van Eck NJ, van Raan AFJ (2012) Universality of citation distributions revisited. J Am Soc Info Sc Tech 63: 72–77.
- (31) Radicchi F, Castellano C (2011) Rescaling citations of publications in physics. Phys Rev E 83: 046116.
- (32) Radicchi F, Castellano C (2012) A reverse engineering approach to the suppression of citation biases reveals universal properties of citation distributions. PLoS One 7: e33833.
- (33) Kaur J, Radicchi F, Menczer F (2013) Universality of scholarly impact metrics. J Informetr 7: 924–932.
- (34) Li Y, Radicchi F, Castellano C, Ruiz-Castillo J (2013) Quantitative evaluation of alternative field normalization procedures. J Informetr 7: 746–755.
- (35) Albarrán P, Ruiz-Castillo J (2011) References made and citations received by scientific articles. J Amer Soc Inform Sc Tech 62: 40–49.
- (36) Albarrán P, Crespo JA, Ortuño I, Ruiz-Castillo J (2011) The skewness of science in 219 sub-fields and a number of aggregates. Scientometrics 88: 385–397.
- (37) Perianes-Rodriguez A, Ruiz-Castillo J (2015) University citation distributions. J Assoc Inform Sc Tech DOI: 10.1002/asi.23619; private communication.
- (38) Albarrán P, Perianes-Rodríguez A, Ruiz-Castillo J (2015) Differences in citation impact across countries. J Assoc Inform Sc Tech 66: 512-525.
- (39) ISI Web of Science, retreived November, 2015. http://portal.isiknowledge.com.
- (40) Clauset A, Shalizi CR, Newman MEJ (2009) Power-law distributions in empirical data. SIAM review 51: 661–703.
- (41) Merton RK (1968) The Matthew effect in science. Science 159: 56–63.
- (42) Price DdS (1976) A general theory of bibliometric and other cumulative advantage processes. J Am Soc Information Sc 27: 292–306.
- (43) Gini C (1921) Measurement of inequality of incomes. Econ J 31: 124–126.
- (44) Ghosh A, Chattopadhyay N, Chakrabarti BK (2014) Inequality in societies, academic institutions and science journals: Gini and k-indices. Physica A 410: 30–34.
- (45) Inoue JI, Ghosh A, Chatterjee A, Chakrabarti BK (2015) Measuring social inequality with quantitative methodology: analytical estimates and empirical data analysis by Gini and indices. Physica A 429: 184-204.
Supporting Information
Table showing abbreviations used for academic institutions.
| Abbreviation | Full Name of University / Institute |
|---|---|
| Bern | University of Bern |
| BHU | Banaras Hindu University |
| Bordeaux | University of Bordeaux |
| Boston | Boston University |
| Bristol | University of Bristol |
| Buenos Aires | University of Buenos Aires |
| Calcutta | University of Calcutta |
| Caltech | California Institute of Technology |
| Cambridge | University of Cambridge |
| Chicago | The University of Chicago |
| Cologne | University of Cologne |
| Columbia | Columbia University |
| Delhi | University of Delhi |
| Edinburgh | The University of Edinburgh |
| Gottingen | University of Göttingen |
| Groningen | University of Groningen |
| Harvard | Harvard University |
| Heidelberg | Heidelberg University |
| Helsinki | University of Helsinki |
| HUJ | The Hebrew University of Jerusalem |
| IISC | Indian Institute of Science |
| Abbreviation | Full Name of University / Institute |
|---|---|
| Kyoto | Kyoto University |
| Landau Inst. | Landau Institute for Theoretical Physics |
| Leiden | Leiden University |
| Leuven | University of Leuven – KU Leuven |
| Madras | University of Madras |
| Manchester | The University of Manchester |
| Melbourne | The University of Melbourne |
| MIT | Massachusetts Institute of Technology |
| Osaka | Osaka University |
| Oslo | University of Oslo |
| Oxford | University of Oxford |
| Princeton | Princeton University |
| SINP | Saha Institute of Nuclear Physics |
| Stanford | Stanford University |
| Stockholm | Stockholm University |
| TAU | Tel Aviv University |
| TIFR | Tata Institute of Fundamental Research |
| Tokyo | The University of Tokyo |
| Toronto | University of Toronto |
| Yale | Yale University |
| Zurich | University of Zurich |
Probability distribution of citations rescaled by average number of citations to publications from 2 different years (1980, 2000) for several academic institutions. Most of the range of the data fit well to a lognormal function with , for 1980 and , for 2000. but the highest citations fit to power laws, with for 1980 and for 2000.
Table showing abbreviations for journals, and their 2010 Impact factor JCR.
| Abbreviation | Full Name of Journal | 2010 |
| Impact Factor | ||
| AA | Astronomy & Astrophysics | 4.425 |
| AJ | The Astrophysical Journal | 6.063 |
| Biochemistry | Biochemistry | 3.226 |
| CPL | Chemical Physics Letters | 2.282 |
| Eur. J. Biochem./ | European Journal of Biochemistry (before 2005) | 3.129 |
| FEBS Journal | FEBS Journal (2005 onwards) | |
| Inor. Chem. | Inorganic Chemistry | 4.326 |
| JAP | Journal of Applied Physics | 2.079 |
| JCP | Journal of Chemical Physics | 2.921 |
| JMMM | Journal of Magnetism and Magnetic Materials | 1.690 |
| J. Org. Chem. | Journal of Organic Chemistry | 4.002 |
| JPA | Journal of Physics A: Mathematical and General (before 2007) | 1.641 |
| Journal of Physics A: Mathematical and Theoretical (2007 onwards) | ||
| Langmuir | Langmuir | 4.269 |
| Macromol. | Macromolecules | 4.838 |
| Physica A | Physica A | 1.522 |
| Physica B | Physica B | 0.856 |
| Physica C | Physica C | 1.415 |
| PRA | Physical Review A | 2.861 |
| PRB | Physical Review B | 3.774 |
| PRC | Physical Review C | 3.416 |
| PRD | Physical Review D | 4.964 |
| PRE | Physical Review E | 2.352 |
| PRL | Physical Review Letters | 7.622 |
| Tetrahedron | Tetrahedron | 3.011 |
| BMJ | British Medical Journal | 13.471 |
| Circulation | Circulation | 14.432 |
| JAMA | The Journal of the American Medical Association | 30.011 |
| Lancet | Lancet | 33.633 |
| Nature | Nature | 36.104 |
| NEJM | The New England Journal of Medicine | 53.486 |
| Science | Science | 31.377 |
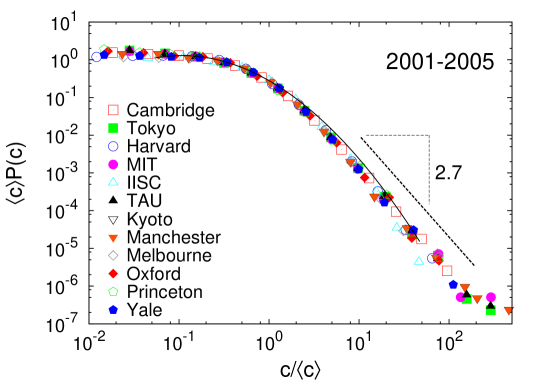
Probability distribution of citations rescaled by average number of citations to publications from the period 2001-2005 for several academic institutions. Most of the range of the data fit well to a lognormal function with , . but the highest citations fit to power laws, with .
Table showing data for number of papers, total number of citations, average citation per paper , Gini () index, index, and the fraction of uncited papers from different institutions for several years.
| Institutions | Year | Papers | Citations | ||||
|---|---|---|---|---|---|---|---|
| Bern | 1980 | 597 | 12029 | 20.15 | 0.705 | 0.767 | 0.162 |
| 1990 | 735 | 24468 | 33.29 | 0.684 | 0.759 | 0.076 | |
| 2000 | 1145 | 47621 | 41.59 | 0.615 | 0.726 | 0.040 | |
| 2010 | 1897 | 46576 | 24.55 | 0.621 | 0.726 | 0.034 | |
| BHU | 1980 | 454 | 2739 | 6.03 | 0.681 | 0.757 | 0.244 |
| 1990 | 411 | 3935 | 9.57 | 0.708 | 0.767 | 0.212 | |
| 2000 | 371 | 5271 | 14.21 | 0.635 | 0.737 | 0.105 | |
| 2010 | 862 | 12239 | 14.20 | 0.628 | 0.728 | 0.084 | |
| Bordeaux | 1980 | 412 | 7873 | 19.11 | 0.685 | 0.762 | 0.119 |
| 1990 | 671 | 14802 | 22.06 | 0.671 | 0.750 | 0.088 | |
| 2000 | 1089 | 37154 | 34.12 | 0.647 | 0.740 | 0.055 | |
| 2010 | 1903 | 41883 | 22.01 | 0.606 | 0.723 | 0.050 | |
| Boston | 1980 | 628 | 29097 | 46.33 | 0.661 | 0.749 | 0.065 |
| 1990 | 1068 | 64787 | 60.66 | 0.690 | 0.759 | 0.050 | |
| 2000 | 1753 | 107119 | 61.11 | 0.657 | 0.744 | 0.036 | |
| 2010 | 2829 | 89245 | 31.55 | 0.620 | 0.729 | 0.031 | |
| Bristol | 1980 | 595 | 22621 | 38.02 | 0.599 | 0.717 | 0.054 |
| 1990 | 936 | 35370 | 37.79 | 0.642 | 0.737 | 0.063 | |
| 2000 | 1771 | 84466 | 47.69 | 0.637 | 0.736 | 0.041 | |
| 2010 | 2479 | 63242 | 25.51 | 0.607 | 0.722 | 0.033 | |
| Buenos Aires | 1980 | 215 | 3392 | 15.78 | 0.804 | 0.802 | 0.293 |
| 1990 | 515 | 7071 | 13.73 | 0.634 | 0.734 | 0.148 | |
| 2000 | 1100 | 28515 | 25.92 | 0.654 | 0.741 | 0.069 | |
| 2010 | 1618 | 27120 | 16.76 | 0.669 | 0.746 | 0.069 | |
| Calcutta | 1980 | 146 | 794 | 5.44 | 0.697 | 0.768 | 0.219 |
| 1990 | 207 | 1655 | 8.00 | 0.626 | 0.735 | 0.208 | |
| 2000 | 166 | 2365 | 14.25 | 0.650 | 0.738 | 0.157 | |
| 2010 | 419 | 4246 | 10.13 | 0.571 | 0.710 | 0.095 | |
| Caltech | 1980 | 1224 | 75433 | 61.63 | 0.671 | 0.751 | 0.047 |
| 1990 | 1522 | 85480 | 56.16 | 0.654 | 0.743 | 0.046 | |
| 2000 | 2228 | 153289 | 68.80 | 0.650 | 0.742 | 0.034 | |
| 2010 | 2951 | 115107 | 39.01 | 0.642 | 0.737 | 0.028 | |
| Cambridge | 1980 | 1353 | 65699 | 48.56 | 0.697 | 0.762 | 0.064 |
| 1990 | 2273 | 118113 | 51.96 | 0.715 | 0.770 | 0.077 | |
| 2000 | 4062 | 224825 | 55.35 | 0.674 | 0.752 | 0.048 | |
| 2010 | 5303 | 182323 | 34.38 | 0.651 | 0.741 | 0.034 | |
| Chicago | 1980 | 1307 | 63672 | 48.72 | 0.646 | 0.742 | 0.047 |
| 1990 | 1586 | 91471 | 57.67 | 0.656 | 0.746 | 0.055 | |
| 2000 | 2045 | 134786 | 65.91 | 0.664 | 0.747 | 0.039 | |
| 2010 | 3285 | 114632 | 34.90 | 0.666 | 0.747 | 0.031 | |
| Cologne | 1980 | 586 | 11663 | 19.90 | 0.680 | 0.755 | 0.123 |
| 1990 | 751 | 20820 | 27.72 | 0.712 | 0.768 | 0.095 | |
| 2000 | 1298 | 46015 | 35.45 | 0.644 | 0.740 | 0.060 | |
| 2010 | 1727 | 37389 | 21.65 | 0.607 | 0.723 | 0.050 | |
| Columbia | 1980 | 1432 | 73600 | 51.40 | 0.661 | 0.747 | 0.051 |
| 1990 | 2021 | 123108 | 60.91 | 0.655 | 0.743 | 0.050 | |
| 2000 | 2796 | 188207 | 67.31 | 0.644 | 0.741 | 0.032 | |
| 2010 | 4906 | 155992 | 31.80 | 0.632 | 0.733 | 0.031 | |
| Delhi | 1980 | 397 | 2710 | 6.83 | 0.645 | 0.741 | 0.141 |
| 1990 | 238 | 2486 | 10.45 | 0.675 | 0.757 | 0.185 | |
| 2000 | 278 | 4499 | 16.18 | 0.667 | 0.749 | 0.104 | |
| 2010 | 835 | 11344 | 13.59 | 0.615 | 0.724 | 0.096 | |
| Edinburgh | 1980 | 723 | 26317 | 36.40 | 0.721 | 0.772 | 0.069 |
| 1990 | 1095 | 42946 | 39.22 | 0.654 | 0.742 | 0.070 | |
| 2000 | 1783 | 91050 | 51.07 | 0.652 | 0.742 | 0.044 | |
| 2010 | 2959 | 93173 | 31.49 | 0.648 | 0.740 | 0.031 | |
| Gottingen | 1980 | 728 | 13058 | 17.94 | 0.644 | 0.739 | 0.109 |
| 1990 | 966 | 38997 | 40.37 | 0.807 | 0.811 | 0.087 | |
| 2000 | 1442 | 55161 | 38.25 | 0.657 | 0.744 | 0.057 | |
| 2010 | 1993 | 48576 | 24.37 | 0.633 | 0.734 | 0.043 | |
| Groningen | 1980 | 537 | 17216 | 32.06 | 0.620 | 0.730 | 0.054 |
| 1990 | 937 | 36115 | 38.54 | 0.642 | 0.737 | 0.037 | |
| 2000 | 1472 | 70664 | 48.01 | 0.612 | 0.725 | 0.026 | |
| 2010 | 2992 | 82907 | 27.71 | 0.590 | 0.717 | 0.019 | |
| Harvard | 1980 | 4517 | 240905 | 53.33 | 0.695 | 0.761 | 0.144 |
| 1990 | 6150 | 440076 | 71.56 | 0.712 | 0.769 | 0.112 | |
| 2000 | 8732 | 710598 | 81.38 | 0.667 | 0.750 | 0.067 | |
| 2010 | 13446 | 474280 | 35.27 | 0.641 | 0.738 | 0.057 | |
| Heidelberg | 1980 | 6240 | 239840 | 38.44 | 0.638 | 0.738 | 0.029 |
| 1990 | 5630 | 215294 | 38.24 | 0.640 | 0.739 | 0.029 | |
| 2000 | 4709 | 181175 | 38.47 | 0.645 | 0.741 | 0.031 | |
| 2010 | 3200 | 122355 | 38.24 | 0.647 | 0.742 | 0.035 | |
| Helsinki | 1980 | 6990 | 266778 | 38.17 | 0.634 | 0.736 | 0.029 |
| 1990 | 9090 | 352316 | 38.76 | 0.627 | 0.733 | 0.028 | |
| 2000 | 10540 | 411872 | 39.08 | 0.626 | 0.733 | 0.027 | |
| 2010 | 11106 | 429641 | 38.69 | 0.626 | 0.733 | 0.027 | |
| HUJ | 1980 | 1126 | 27316 | 24.26 | 0.633 | 0.732 | 0.052 |
| 1990 | 1220 | 39586 | 32.45 | 0.639 | 0.739 | 0.050 | |
| 2000 | 1760 | 77577 | 44.08 | 0.656 | 0.743 | 0.039 | |
| 2010 | 1742 | 36882 | 21.17 | 0.594 | 0.717 | 0.041 | |
| IISC | 1980 | 406 | 4908 | 12.09 | 0.715 | 0.771 | 0.195 |
| 1990 | 543 | 9045 | 16.66 | 0.699 | 0.764 | 0.151 | |
| 2000 | 826 | 22600 | 27.36 | 0.657 | 0.746 | 0.074 | |
| 2010 | 1537 | 19963 | 12.99 | 0.606 | 0.722 | 0.076 |
| Institutions | Year | Papers | Citations | ||||
|---|---|---|---|---|---|---|---|
| Kyoto | 1980 | 1861 | 47153 | 25.34 | 0.651 | 0.743 | 0.074 |
| 1990 | 2816 | 84563 | 30.03 | 0.662 | 0.747 | 0.063 | |
| 2000 | 4541 | 175219 | 38.59 | 0.668 | 0.749 | 0.051 | |
| 2010 | 5283 | 90834 | 17.19 | 0.619 | 0.728 | 0.065 | |
| Landau | 1980 | 94 | 8136 | 86.55 | 0.862 | 0.859 | 0.064 |
| 1990 | 124 | 3856 | 31.10 | 0.745 | 0.797 | 0.169 | |
| 2000 | 232 | 5961 | 25.69 | 0.790 | 0.806 | 0.168 | |
| 2010 | 256 | 2546 | 9.95 | 0.619 | 0.733 | 0.152 | |
| Leiden | 1980 | 2100 | 33516 | 15.96 | 0.612 | 0.726 | 0.075 |
| 1990 | 2550 | 43562 | 17.08 | 0.617 | 0.727 | 0.067 | |
| 2000 | 2950 | 50028 | 16.96 | 0.616 | 0.727 | 0.069 | |
| 2010 | 3650 | 63353 | 17.36 | 0.617 | 0.727 | 0.064 | |
| Leuven | 1980 | 2816 | 84563 | 30.03 | 0.662 | 0.747 | 0.063 |
| 1990 | 900 | 29257 | 32.51 | 0.692 | 0.761 | 0.062 | |
| 2000 | 3600 | 148209 | 41.17 | 0.654 | 0.744 | 0.039 | |
| 2010 | 950 | 38051 | 40.05 | 0.638 | 0.737 | 0.033 | |
| Madras | 1980 | 180 | 1363 | 7.57 | 0.666 | 0.754 | 0.183 |
| 1990 | 150 | 1165 | 7.77 | 0.666 | 0.756 | 0.180 | |
| 2000 | 181 | 2608 | 14.41 | 0.622 | 0.728 | 0.144 | |
| 2010 | 318 | 3969 | 12.48 | 0.753 | 0.783 | 0.176 | |
| Manchester | 1980 | 150 | 1165 | 7.77 | 0.666 | 0.756 | 0.180 |
| 1990 | 318 | 3969 | 12.48 | 0.753 | 0.783 | 0.176 | |
| 2000 | 800 | 20192 | 25.24 | 0.665 | 0.747 | 0.044 | |
| 2010 | 4289 | 107033 | 24.96 | 0.622 | 0.728 | 0.033 | |
| Melbourne | 1980 | 1150 | 35610 | 30.97 | 0.572 | 0.710 | 0.012 |
| 1990 | 850 | 22241 | 26.17 | 0.595 | 0.717 | 0.028 | |
| 2000 | 1067 | 31538 | 29.56 | 0.606 | 0.719 | 0.023 | |
| 2010 | 4289 | 107033 | 24.96 | 0.622 | 0.728 | 0.033 | |
| MIT | 1980 | 2040 | 114892 | 56.32 | 0.713 | 0.769 | 0.109 |
| 1990 | 2957 | 184009 | 62.23 | 0.724 | 0.777 | 0.099 | |
| 2000 | 3524 | 258609 | 73.39 | 0.716 | 0.772 | 0.062 | |
| 2010 | 880 | 12826 | 14.57 | 0.687 | 0.759 | 0.138 | |
| Osaka | 1980 | 1603 | 33261 | 20.75 | 0.624 | 0.732 | 0.069 |
| 1990 | 2853 | 73988 | 25.93 | 0.703 | 0.764 | 0.116 | |
| 2000 | 450 | 14717 | 32.70 | 0.646 | 0.742 | 0.051 | |
| 2010 | 6199 | 90104 | 14.54 | 0.680 | 0.753 | 0.125 | |
| Oslo | 1980 | 741 | 17956 | 24.23 | 0.658 | 0.744 | 0.113 |
| 1990 | 883 | 23639 | 26.77 | 0.647 | 0.740 | 0.121 | |
| 2000 | 1410 | 46806 | 33.20 | 0.603 | 0.721 | 0.065 | |
| 2010 | 2883 | 54926 | 19.05 | 0.587 | 0.715 | 0.059 | |
| Oxford | 1980 | 971 | 39763 | 40.95 | 0.647 | 0.742 | 0.048 |
| 1990 | 1781 | 87390 | 49.07 | 0.692 | 0.761 | 0.076 | |
| 2000 | 3351 | 222433 | 66.38 | 0.687 | 0.756 | 0.046 | |
| 2010 | 5539 | 199266 | 35.98 | 0.665 | 0.747 | 0.034 | |
| Princeton | 1980 | 1122 | 46206 | 41.18 | 0.757 | 0.788 | 0.217 |
| 1990 | 1474 | 73535 | 49.89 | 0.743 | 0.784 | 0.196 | |
| 2000 | 1996 | 114847 | 57.54 | 0.714 | 0.767 | 0.139 | |
| 2010 | 2684 | 75697 | 28.20 | 0.683 | 0.753 | 0.136 | |
| SINP | 1980 | 31 | 180 | 5.81 | 0.670 | 0.746 | 0.194 |
| 1990 | 85 | 702 | 8.26 | 0.632 | 0.731 | 0.118 | |
| 2000 | 140 | 1576 | 11.26 | 0.648 | 0.741 | 0.157 | |
| 2010 | 229 | 2920 | 12.75 | 0.679 | 0.752 | 0.131 | |
| Stanford | 1980 | 2463 | 144640 | 58.73 | 0.737 | 0.780 | 0.117 |
| 1990 | 3559 | 199720 | 56.12 | 0.698 | 0.764 | 0.115 | |
| 2000 | 5541 | 393605 | 71.04 | 0.734 | 0.779 | 0.082 | |
| 2010 | 7522 | 226442 | 30.10 | 0.679 | 0.755 | 0.082 | |
| Stockholm | 1980 | 410 | 11393 | 27.79 | 0.695 | 0.762 | 0.124 |
| 1990 | 648 | 22535 | 34.78 | 0.664 | 0.752 | 0.094 | |
| 2000 | 521 | 25832 | 49.58 | 0.685 | 0.756 | 0.060 | |
| 2010 | 312 | 8346 | 26.75 | 0.698 | 0.762 | 0.090 | |
| TAU | 1980 | 1145 | 26937 | 23.53 | 0.718 | 0.770 | 0.114 |
| 1990 | 1761 | 40134 | 22.79 | 0.679 | 0.751 | 0.114 | |
| 2000 | 2657 | 77106 | 29.02 | 0.663 | 0.746 | 0.074 | |
| 2010 | 3402 | 55252 | 16.24 | 0.657 | 0.744 | 0.103 | |
| TIFR | 1980 | 163 | 2042 | 12.53 | 0.699 | 0.765 | 0.153 |
| 1990 | 322 | 5256 | 16.32 | 0.745 | 0.780 | 0.196 | |
| 2000 | 437 | 12043 | 27.56 | 0.736 | 0.774 | 0.114 | |
| 2010 | 578 | 13803 | 23.88 | 0.747 | 0.778 | 0.104 | |
| Tokyo | 1980 | 2595 | 60693 | 23.39 | 0.666 | 0.748 | 0.124 |
| 1990 | 4383 | 121428 | 27.70 | 0.677 | 0.754 | 0.094 | |
| 2000 | 7734 | 267430 | 34.58 | 0.676 | 0.752 | 0.079 | |
| 2010 | 8980 | 164182 | 18.28 | 0.655 | 0.743 | 0.085 | |
| Toronto | 1980 | 2568 | 80164 | 31.22 | 0.771 | 0.793 | 0.220 |
| 1990 | 3613 | 116662 | 32.29 | 0.714 | 0.769 | 0.184 | |
| 2000 | 5185 | 246853 | 47.61 | 0.684 | 0.756 | 0.123 | |
| 2010 | 8880 | 207596 | 23.38 | 0.649 | 0.739 | 0.091 | |
| Yale | 1980 | 2400 | 99265 | 41.36 | 0.716 | 0.770 | 0.202 |
| 1990 | 2940 | 165230 | 56.20 | 0.725 | 0.774 | 0.162 | |
| 2000 | 4707 | 249190 | 52.94 | 0.723 | 0.773 | 0.163 | |
| 2010 | 6588 | 156268 | 23.72 | 0.684 | 0.756 | 0.143 | |
| Zurich | 1980 | 712 | 16173 | 22.71 | 0.718 | 0.773 | 0.154 |
| 1990 | 844 | 28233 | 33.45 | 0.684 | 0.756 | 0.120 | |
| 2000 | 1991 | 97451 | 48.95 | 0.661 | 0.748 | 0.065 | |
| 2010 | 3423 | 87603 | 25.59 | 0.629 | 0.729 | 0.059 |
Table showing data for number of papers, total number of citations, average citation per paper , Gini () index, index, and the fraction of uncited papers from different journals for several years.
| Journals | Year | papers | citations | ||||
|---|---|---|---|---|---|---|---|
| Astronomy | 1980 | 728 | 20594 | 28.29 | 0.636 | 0.734 | 0.026 |
| Astrophys. | 1990 | 909 | 27208 | 29.93 | 0.577 | 0.715 | 0.019 |
| 2000 | 1412 | 51354 | 36.37 | 0.558 | 0.704 | 0.018 | |
| 2010 | 1916 | 40226 | 20.99 | 0.564 | 0.704 | 0.027 | |
| Astrophys. | 1980 | 1223 | 64099 | 52.41 | 0.550 | 0.701 | 0.008 |
| J. | 1990 | 1517 | 72110 | 47.53 | 0.533 | 0.696 | 0.010 |
| 2000 | 2388 | 136940 | 57.35 | 0.547 | 0.701 | 0.003 | |
| 2010 | 2501 | 73646 | 29.45 | 0.506 | 0.685 | 0.007 | |
| Biochem. | 1980 | 935 | 55002 | 58.83 | 0.486 | 0.674 | 0.002 |
| 1990 | 1510 | 104554 | 69.24 | 0.509 | 0.684 | 0.001 | |
| 2000 | 1823 | 79977 | 43.87 | 0.435 | 0.656 | 0.001 | |
| 2010 | 1142 | 18512 | 16.21 | 0.436 | 0.654 | 0.007 | |
| BMJ | 1980 | 809 | 26008 | 32.15 | 0.676 | 0.757 | 0.080 |
| 1990 | 626 | 31949 | 51.04 | 0.692 | 0.763 | 0.054 | |
| 2000 | 613 | 61513 | 100.35 | 0.709 | 0.769 | 0.038 | |
| 2010 | 293 | 14339 | 48.94 | 0.507 | 0.682 | 0.010 | |
| Circulation | 1980 | 412 | 32786 | 79.58 | 0.555 | 0.704 | 0.022 |
| 1990 | 541 | 62367 | 115.28 | 0.571 | 0.713 | 0.004 | |
| 2000 | 989 | 130463 | 131.91 | 0.528 | 0.693 | 0.004 | |
| 2010 | 554 | 41659 | 75.20 | 0.492 | 0.675 | 0.004 | |
| CPL | 1980 | 1067 | 31538 | 29.56 | 0.606 | 0.719 | 0.023 |
| 1990 | 1166 | 34366 | 29.47 | 0.627 | 0.730 | 0.025 | |
| 2000 | 1487 | 47478 | 31.93 | 0.579 | 0.713 | 0.011 | |
| 2010 | 1013 | 10966 | 10.83 | 0.525 | 0.687 | 0.051 | |
| Eur. J. | 1980 | 753 | 35476 | 47.11 | 0.545 | 0.697 | 0.005 |
| Biochem. | 1990 | 789 | 35456 | 44.94 | 0.531 | 0.693 | 0.009 |
| 2000 | 836 | 34696 | 41.50 | 0.514 | 0.683 | 0.004 | |
| 2010 | 447 | 9702 | 21.70 | 0.545 | 0.698 | 0.022 | |
| Inor. Chem. | 1980 | 823 | 31391 | 38.14 | 0.459 | 0.666 | 0.001 |
| 1990 | 1082 | 39076 | 36.11 | 0.476 | 0.672 | 0.004 | |
| 2000 | 941 | 36648 | 38.95 | 0.466 | 0.668 | 0.002 | |
| 2010 | 1416 | 31953 | 22.57 | 0.447 | 0.662 | 0.007 | |
| JAMA | 1980 | 503 | 13999 | 27.83 | 0.675 | 0.753 | 0.205 |
| 1990 | 743 | 48102 | 64.74 | 0.762 | 0.787 | 0.353 | |
| 2000 | 699 | 79037 | 113.07 | 0.757 | 0.788 | 0.330 | |
| 2010 | 535 | 34563 | 64.60 | 0.723 | 0.772 | 0.187 | |
| JAP | 1980 | 1108 | 34304 | 30.96 | 0.668 | 0.754 | 0.046 |
| 1990 | 2571 | 57132 | 22.22 | 0.638 | 0.739 | 0.054 | |
| 2000 | 2941 | 80656 | 27.42 | 0.613 | 0.727 | 0.027 | |
| 2010 | 3892 | 40286 | 10.35 | 0.511 | 0.685 | 0.053 | |
| J. Chem. | 1980 | 1849 | 101604 | 54.95 | 0.651 | 0.739 | 0.016 |
| Phys. | 1990 | 1958 | 95959 | 49.01 | 0.582 | 0.711 | 0.012 |
| 2000 | 2526 | 102525 | 40.59 | 0.579 | 0.710 | 0.005 | |
| 2010 | 2137 | 32872 | 15.38 | 0.522 | 0.686 | 0.022 | |
| JMMM | 1980 | 907 | 7467 | 8.23 | 0.631 | 0.735 | 0.128 |
| 1990 | 852 | 8734 | 10.25 | 0.653 | 0.744 | 0.131 | |
| 2000 | 802 | 12714 | 15.85 | 0.584 | 0.714 | 0.062 | |
| 2010 | 740 | 6382 | 8.62 | 0.570 | 0.708 | 0.099 | |
| J. Org. | 1980 | 1232 | 38706 | 31.42 | 0.513 | 0.687 | 0.004 |
| Chem. | 1990 | 1162 | 44254 | 38.08 | 0.494 | 0.680 | 0.001 |
| 2000 | 1396 | 53495 | 38.32 | 0.442 | 0.659 | 0.002 | |
| 2010 | 1201 | 25166 | 20.95 | 0.417 | 0.649 | 0.005 | |
| JPA | 1980 | 340 | 7800 | 22.94 | 0.752 | 0.790 | 0.106 |
| 1990 | 470 | 7507 | 15.97 | 0.625 | 0.735 | 0.085 | |
| 2000 | 644 | 8758 | 13.60 | 0.592 | 0.722 | 0.079 | |
| 2010 | 959 | 6545 | 6.82 | 0.573 | 0.707 | 0.115 | |
| Lancet | 1980 | 595 | 38780 | 65.18 | 0.650 | 0.736 | 0.229 |
| 1990 | 476 | 67331 | 141.45 | 0.604 | 0.721 | 0.048 | |
| 2000 | 822 | 109177 | 132.82 | 0.642 | 0.739 | 0.050 | |
| 2010 | 271 | 54158 | 199.85 | 0.463 | 0.670 | 0.000 |
| Journals | Year | papers | citations | ||||
| Langmuir | 1990 | 285 | 12679 | 44.49 | 0.589 | 0.716 | 0.014 |
| 2000 | 1476 | 72398 | 49.05 | 0.528 | 0.694 | 0.003 | |
| 2010 | 2664 | 55540 | 20.85 | 0.460 | 0.665 | 0.007 | |
| Macromol. | 1980 | 315 | 20018 | 63.55 | 0.642 | 0.737 | 0.029 |
| 1990 | 863 | 42799 | 49.59 | 0.567 | 0.710 | 0.008 | |
| 2000 | 1373 | 69158 | 50.37 | 0.499 | 0.682 | 0.001 | |
| 2010 | 1365 | 38215 | 28.00 | 0.472 | 0.668 | 0.006 | |
| Nature | 1980 | 1502 | 181108 | 120.58 | 0.637 | 0.736 | 0.007 |
| 1990 | 1391 | 315723 | 226.98 | 0.676 | 0.751 | 0.180 | |
| 2000 | 1517 | 464531 | 306.22 | 0.668 | 0.746 | 0.146 | |
| 2010 | 1012 | 163098 | 161.16 | 0.547 | 0.698 | 0.111 | |
| NEJM | 1980 | 360 | 67263 | 186.84 | 0.518 | 0.686 | 0.003 |
| 1990 | 374 | 111199 | 297.32 | 0.506 | 0.683 | 0.000 | |
| 2000 | 379 | 142799 | 376.78 | 0.603 | 0.720 | 0.055 | |
| 2010 | 342 | 77333 | 226.12 | 0.576 | 0.706 | 0.029 | |
| Physica A | 1980 | 195 | 3298 | 16.91 | 0.551 | 0.700 | 0.067 |
| 1990 | 402 | 6691 | 16.64 | 0.653 | 0.748 | 0.112 | |
| 2000 | 620 | 10776 | 17.38 | 0.649 | 0.744 | 0.077 | |
| 2010 | 617 | 5217 | 8.46 | 0.587 | 0.718 | 0.100 | |
| Physica B | 1990 | 1187 | 6787 | 5.72 | 0.632 | 0.732 | 0.190 |
| 2000 | 2630 | 13378 | 5.09 | 0.647 | 0.740 | 0.220 | |
| 2010 | 1058 | 7139 | 6.75 | 0.558 | 0.702 | 0.127 | |
| Physica C | 1990 | 608 | 16779 | 27.60 | 0.586 | 0.715 | 0.016 |
| 2000 | 1621 | 8481 | 5.23 | 0.664 | 0.748 | 0.240 | |
| 2010 | 897 | 2528 | 2.82 | 0.658 | 0.744 | 0.309 | |
| PRA | 1980 | 624 | 25452 | 40.79 | 0.609 | 0.724 | 0.024 |
| 1990 | 1859 | 57309 | 30.83 | 0.603 | 0.724 | 0.033 | |
| 2000 | 1410 | 42545 | 30.17 | 0.624 | 0.729 | 0.044 | |
| 2010 | 2858 | 39628 | 13.87 | 0.519 | 0.687 | 0.031 | |
| PRB | 1980 | 1354 | 64235 | 47.44 | 0.648 | 0.743 | 0.018 |
| 1990 | 3390 | 161651 | 47.68 | 0.649 | 0.741 | 0.017 | |
| 2000 | 4756 | 172663 | 36.30 | 0.602 | 0.722 | 0.025 | |
| 2010 | 6049 | 108383 | 17.92 | 0.528 | 0.692 | 0.021 | |
| PRC | 1980 | 619 | 19945 | 32.22 | 0.653 | 0.744 | 0.027 |
| 1990 | 703 | 16018 | 22.79 | 0.617 | 0.728 | 0.033 | |
| 2000 | 832 | 20521 | 24.66 | 0.569 | 0.709 | 0.040 | |
| 2010 | 1013 | 18071 | 17.84 | 0.545 | 0.697 | 0.032 | |
| PRD | 1980 | 775 | 37491 | 48.38 | 0.763 | 0.797 | 0.081 |
| 1990 | 1007 | 34899 | 34.66 | 0.681 | 0.759 | 0.049 | |
| 2000 | 2020 | 70517 | 34.91 | 0.613 | 0.728 | 0.040 | |
| 2010 | 2931 | 56035 | 19.12 | 0.532 | 0.693 | 0.028 | |
| PRE | 2000 | 2034 | 58313 | 28.67 | 0.584 | 0.715 | 0.022 |
| 2010 | 2310 | 26163 | 11.33 | 0.492 | 0.678 | 0.039 | |
| PRL | 1980 | 1194 | 92238 | 77.25 | 0.670 | 0.746 | 0.047 |
| 1990 | 1643 | 163084 | 99.26 | 0.604 | 0.724 | 0.003 | |
| 2000 | 3046 | 250871 | 82.36 | 0.589 | 0.717 | 0.006 | |
| 2010 | 3105 | 115955 | 37.34 | 0.493 | 0.679 | 0.004 | |
| Science | 1980 | 1021 | 115716 | 113.34 | 0.635 | 0.738 | 0.032 |
| 1990 | 1061 | 237803 | 224.13 | 0.663 | 0.745 | 0.168 | |
| 2000 | 1053 | 343455 | 326.17 | 0.614 | 0.725 | 0.092 | |
| 2010 | 974 | 135833 | 139.46 | 0.529 | 0.692 | 0.089 | |
| Tetrahedron | 1980 | 391 | 16696 | 42.70 | 0.709 | 0.771 | 0.013 |
| 1990 | 684 | 19410 | 28.38 | 0.556 | 0.701 | 0.034 | |
| 2000 | 1092 | 33027 | 30.24 | 0.503 | 0.680 | 0.007 | |
| 2010 | 1179 | 16155 | 13.70 | 0.465 | 0.665 | 0.015 | |
Table showing data for number of citable documents, total number of citations, average citation per paper , Gini () index, index, as well as the fraction of uncited papers from different journals of the Elite class for several years.
| Journals | Year | papers | citations | ||||
|---|---|---|---|---|---|---|---|
| BMJ | 1980 | 3056 | 27798 | 9.10 | 0.886 | 0.869 | 0.542 |
| 1990 | 2824 | 37353 | 13.23 | 0.884 | 0.867 | 0.482 | |
| 2000 | 3263 | 71373 | 21.87 | 0.901 | 0.877 | 0.451 | |
| 2010 | 3412 | 19308 | 5.66 | 0.900 | 0.883 | 0.601 | |
| Circulation | 1980 | 1895 | 35986 | 18.99 | 0.861 | 0.861 | 0.387 |
| 1990 | 3830 | 70278 | 18.35 | 0.907 | 0.891 | 0.478 | |
| 2000 | 5574 | 137302 | 24.63 | 0.906 | 0.887 | 0.628 | |
| 2010 | 6675 | 46645 | 6.99 | 0.951 | 0.931 | 0.827 | |
| JAMA | 1980 | 1440 | 20784 | 14.43 | 0.794 | 0.812 | 0.386 |
| 1990 | 1738 | 54443 | 31.33 | 0.876 | 0.862 | 0.472 | |
| 2000 | 1696 | 86713 | 51.13 | 0.869 | 0.862 | 0.381 | |
| 2010 | 1425 | 36235 | 25.43 | 0.863 | 0.857 | 0.435 | |
| Lancet | 1980 | 2981 | 56515 | 18.96 | 0.822 | 0.829 | 0.378 |
| 1990 | 3230 | 94008 | 29.10 | 0.846 | 0.842 | 0.344 | |
| 2000 | 3367 | 123585 | 36.70 | 0.870 | 0.863 | 0.365 | |
| 2010 | 1743 | 62028 | 35.59 | 0.876 | 0.873 | 0.368 | |
| Nature | 1980 | 2892 | 185484 | 64.14 | 0.799 | 0.809 | 0.336 |
| 1990 | 3606 | 318090 | 88.22 | 0.857 | 0.847 | 0.435 | |
| 2000 | 3612 | 330512 | 91.50 | 0.856 | 0.847 | 0.434 | |
| 2010 | 2577 | 177161 | 68.75 | 0.791 | 0.809 | 0.302 | |
| NEJM | 1980 | 1791 | 77780 | 43.43 | 0.858 | 0.855 | 0.376 |
| 1990 | 1684 | 122750 | 72.89 | 0.854 | 0.851 | 0.348 | |
| 2000 | 1561 | 155490 | 99.61 | 0.874 | 0.864 | 0.336 | |
| 2010 | 1753 | 93609 | 53.40 | 0.867 | 0.861 | 0.345 | |
| Science | 1980 | 1669 | 117642 | 70.49 | 0.765 | 0.795 | 0.217 |
| 1990 | 2178 | 243190 | 111.66 | 0.826 | 0.829 | 0.354 | |
| 2000 | 2575 | 363418 | 141.13 | 0.816 | 0.823 | 0.260 | |
| 2010 | 2439 | 154194 | 63.22 | 0.762 | 0.795 | 0.243 |
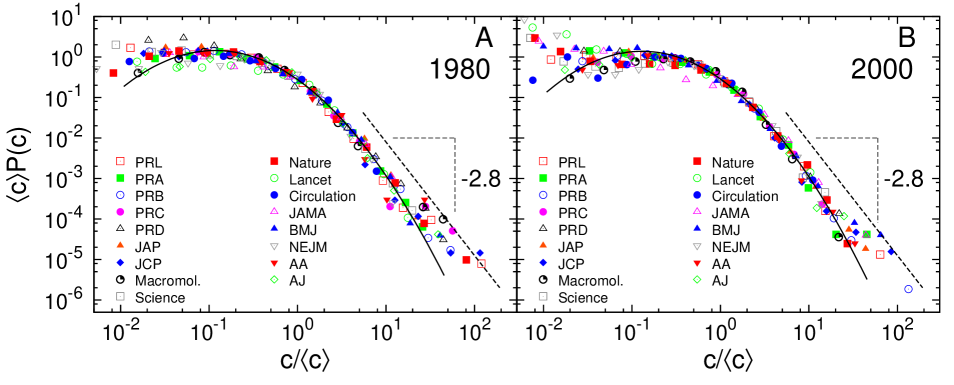
Probability distribution of citations rescaled by average number of citations to publications from 2 different years, (A) 1980 and (B) 2000 for several journals. The most of the range fits to a lognormal with , for 1980 and , for 2000. The largest citations for both the classes seem to follow a power law: , with for 1980 and for 2000.
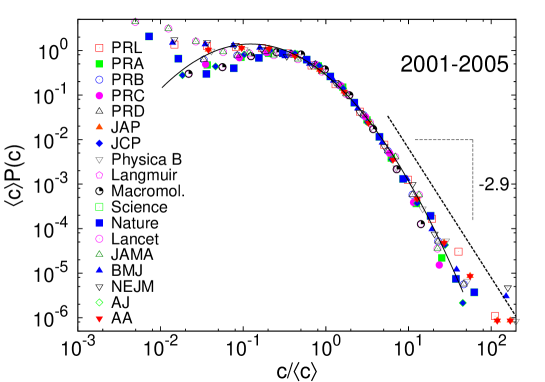
Probability distribution of citations rescaled by average number of citations to publications from 2001-2005 for several journals. The most of the range fits to a lognormal with , , while the largest citations seem to follow a power law: , with .
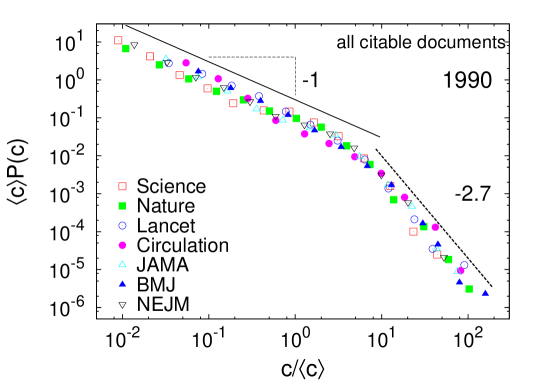
Probability distribution of citations rescaled by average number of citations to publications from 1990 for all citable documents of several academic journals in the Elite class: The scaling distribution is such that with , for the lower range of . The largest citations fit well to a power law: , with .
Probability distribution of citations rescaled by average number of citations to publications from 1980, 1990, 2000 and 2010 for all citable documents of several academic journals in the Elite class.
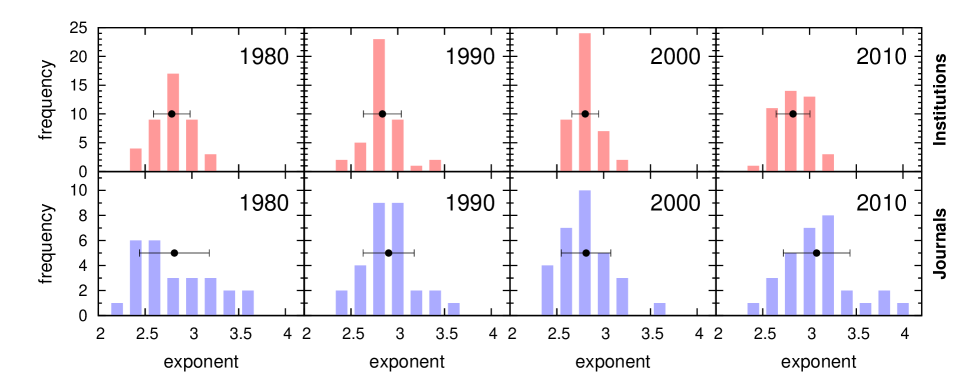
Histograms of power law exponents of the highest cited papers measured from individual data sets, their average along with error bar. Data is shown for 4 different years: 1980, 1990, 2000 and 2010, for institutions and journals.
Average power law exponents for the highest cited publications for different years (1980, 1990, 2000 and 2010), for all institutions and journals considered.
| Year | Institutions | Journals |
|---|---|---|
| 1980 | ||
| 1990 | ||
| 2000 | ||
| 2010 |