Verwey transition in Fe3O4 thin films: Influence of oxygen stoichiometry and substrate-induced microstructure
Abstract
We have carried out a systematic experimental investigation to address the question why thin films of Fe3O4 (magnetite) generally have a very broad Verwey transition with lower transition temperatures as compared to the bulk. We observed using x-ray photoelectron spectroscopy, x-ray diffraction and resistivity measurements that the Verwey transition in thin films is drastically influenced not only by the oxygen stoichiometry but especially also by the substrate-induced microstructure. In particular, we found (1) that the transition temperature, the resistivity jump, and the conductivity gap of fully stoichiometric films greatly depends on the domain size, which increases gradually with increasing film thickness, (2) that the broadness of the transition scales with the width of the domain size distribution, and (3) that the hysteresis width is affected strongly by the presence of antiphase boundaries. Films grown on MgO (001) substrates showed the highest and sharpest transitions, with a 200 nm film having a TV of 122 K, which is close to the bulk value. Films grown on substrates with large lattice constant mismatch revealed very broad transitions, and yet, all films show a transition with a hysteresis behavior, indicating that the transition is still first order rather than higher order.
pacs:
68.55.-a, 73.50.-h, 75.70.-i, 79.60.-iI Introduction
The theoretically predicted half-metallic character of Fe3O4 Groot83 ; Yanase84 ; Groot84 ; Groot86 has made magnetite one of the most studied transition metal oxide material for thin film applications in devices such as spin valves and magnetic tunnel junctions. A tremendous amount of work has been devoted to preparing thin films with high crystalline quality. Using a variety of deposition methods, epitaxial growth on a number of substrates has been achieved.Lind1992 ; Chambers1997 ; Chambers1997_2 ; Gao97 ; Chambers1997_4 ; Chambers1999 ; Kiyomura1999 ; Chambers2000 ; Chambers2000_2 ; ChambersRep2000 ; Voogt1997 ; Voogt1998 ; Voogt1999 ; Bloemen1996 ; Gaines1997 ; Gaines1997_2 ; Anderson_Mg ; Heijden95 ; Heijden1998 ; Fontijn1997 ; Hibma1999 ; Fuji1990 ; Fuji1990_2 ; Fuji1994 ; Fuji1999 ; Mijiritskii2001 ; Subagyo2006 ; Fonin2005 ; Moussy2013
Yet, the physical properties of the thin films are not that well defined as those of the bulk material. In particular, the first order metal-insulator transition, known as Verwey transition Verwey39 , is in thin films very broad Eerenstein02 ; Kumar06 ; Sena97 ; Gong97 ; Kale01 ; Li98 ; Arora05 ; Arora06 ; Ramos06 ; Ziese00 ; Ziese2000 ; Ziese02 ; Geprags13 ; Wang13 ; Liu13 ; Naftalis11 ; Moussy04 ; Margulies96 ; Orna10 as compared to that in the bulk single crystal. The Verwey transition temperature in thin films is also much lower, with reported values ranging from 100 to 120 KEerenstein02 ; Kumar06 ; Sena97 ; Gong97 ; Kale01 ; Li98 ; Arora05 ; Arora06 ; Ramos06 ; Ziese00 ; Ziese2000 ; Ziese02 ; Geprags13 ; Wang13 ; Liu13 ; Naftalis11 ; Moussy04 ; Margulies96 ; Orna10 while the stoichiometric bulk has of 124-125 K. It is not clear why the Verwey transition in thin films is so diffuse.
In this work, we investigate systematically the effect of oxygen stoichiometry, thickness, strain, and microstructure on the Verwey transition in epitaxial Fe3O4 thin films on a variety of substrates. We use molecular beam epitaxy (MBE) technique under ultra-high vacuum conditions combined with in situ electron diffraction and spectroscopic characterization as well as ex situ x-ray diffraction and electrical conductivity measurements. Our aim is to understand the factors that affect negatively the Verwey transition in thin films, so that we can identify the route to synthesize Fe3O4 thin films with transport properties as good as or perhaps even better than the bulk material.
II Experimental
Fe3O4 thin films were grown by molecular beam epitaxy (MBE) in an ultra-high vacuum (UHV) chamber with a base pressure in the 110-10 mbar range. High purity Fe metal was evaporated from a LUXEL Radak effusion cell at temperatures of about in a pure oxygen atmosphere onto single crystalline MgO (001), SrTiO3 (001) (STO), and MgAl2O4 (001) (MAO) substrates. These substrates were annealed for 2 h at in an oxygen pressure of 310-7 mbar to obtain a clean and well-ordered surface structure prior to the Fe3O4 deposition. The substrate temperature was kept at during growth.
The Fe flux was calibrated using a quartz-crystal monitor at the growth position prior to deposition and set to 1 Å per minute for the growth of all films. Molecular oxygen was simultaneously supplied through a leak valve. Fe3O4 films with different oxygen stoichiometries were grown by varying the partial oxygen pressure between 510-8 and 110-5 mbar, while keeping the Fe flux constant. The growth was terminated by simultaneously closing the oxygen leak valve and the Fe shutter.
In situ and real-time monitoring of the epitaxial growth was performed by reflection high-energy electron diffraction (RHEED) measurements. Oscillations in the RHEED specular beam intensity, where each oscillation corresponds to the formation of one new atomic monolayer (ML), allows for precise control of the film thickness. The crystalline structure was also verified in situ after the growth by low-energy electron diffraction (LEED). All samples were also analyzed in situ by x-ray photoelectron spectroscopy (XPS). The XPS data were collected using 1486.6 eV photons (monochromatized Al light) in normal emission geometry and at room temperature using a Scienta R3000 electron energy analyzer. The overall energy resolution was set to about 0.3 eV.
Temperature dependent resistivity measurements of the Fe3O4 thin films were performed by standard four probe technique using a physical property measurement system (PPMS). X-ray diffraction (XRD) was employed for further ex situ investigation of the structural quality and the microstructure of the films. The XRD measurements were performed with a high resolution Philips XPert MRD diffractometer using monochromatic Cu radiation ( = 1.54056 Å).
III Oxygen stoichiometry
It is well known that the oxygen stoichiometry greatly influences the Verwey transition in bulk Fe3(1-δ)O4 Aragon85 ; Kakol92 ; Aragon93 ; Honig95 ; Brabers98 . The order parameter shows a clear discontinuity across the transition in samples with -0.0005 = 0.0039, whereas for 3, the discontinuity disappears and the term second or higher order has been used to describe the temperature behavior of the order parameter. With increasing , the transition becomes broad and the transition temperature, TV, decreases continuously.Aragon85 ; Aragon93 ; Brabers98 For thin films, on the other hand, the few reports available on the effect of oxygen stoichiometry are mostly focused on the crystal structure, morphology, magnetic properties, and resistivity at room temperature Chambers1997 ; Gao97 ; Kiyomura1999 ; VoogtPhD ; Fuji1999 ; Huang2013 . In particular, little has been done to study the influence of the oxygen content on the Verwey transition itself with the resistivity as the order parameter in magnetite thin films.
To start our study, we first investigate the effect of the oxygen stoichiometry on the Verwey transition of single crystalline epitaxial Fe3O4 thin films. We prepared a series of samples, all with a thickness of 40 nm, where the Fe flux is set at 1 Å /min and the substrate temperature at . We varied the oxygen pressure in a wide range, from 510-8 to 1.010-5 mbar, to measure the changes of the crystalline structure, the Fe valence, and the temperature dependence of the resistivity. Our objective is hereby to find the optimal oxygen pressure for the growth of fully stoichiometric single crystalline Fe3O4 films.
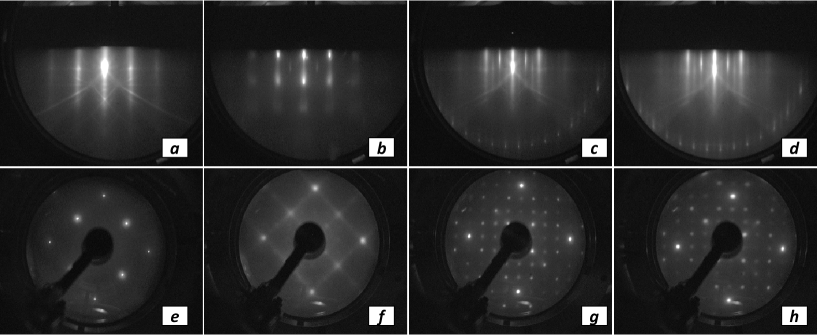
Figure 1 shows a selection of the RHEED and LEED patterns of the films that we have prepared, namely the clean MgO (001) substrate [Fig. 1(a) and (e)], and Fe3O4 thin films grown at 510-8 mbar (b) and (f), 1.010-6 mbar (c) and (g), and 1.010-5 mbar (d) and (h) oxygen pressure, respectively. RHEED patterns were taken at 20 keV electron energy, with the beam aligned parallel to the [100] direction of the substrate. The LEED patterns were recorded at an electron energy of 88 eV. The patterns and the quality thereof changes clearly with the oxygen pressure.
For the 1.010-6 mbar oxygen pressure we observed the characteristic surface structure of bulk Fe3O4 (001). Sharp RHEED streaks and the presence of Kikuchi lines, as well the intense and sharp LEED spots [Fig. 1(c) and (g)] indicate a flat and well ordered (001) crystalline surface structure of the 40 nm of Fe3O4 film. The lattice parameter of Fe3O4 (8.39 Å) is nearly twice that of MgO (4.21 Å), resulting in a very small lattice mismatch of 0.3. Because the growth is fully coherent, with the in-plane dimensions of the spinel unit cell of Fe3O4 being twice those of rocksalt unit cell of MgO, one expects a new sets of diffraction rods (spots) occurring with half spacing of the substrate. The RHEED and LEED patterns indeed show the occurrence of the half order diffraction rods (spots) in the zeroth Laue zone. The signature of the ()R45∘ surface reconstruction, which is also characteristic for single crystal magnetite, is a new set of diffraction rods which are positioned exactly in between the half-order rods (see Fig. 1(c)). We observed a clear and sharp reconstruction pattern both in RHEED and LEED electron diffraction for the film grown at 1.010-6 mbar oxygen pressure.
For the low 510-8 mbar oxygen pressure, the RHEED pattern shows transmission like characteristics. The half order diffraction rods are also not clearly visible. The LEED spots become broadened and less intense, indicating an appreciable disorder. Both RHEED and LEED do not show the characteristic crystalline structure of pure Fe3O4. It is conceivable that the film may also contain FeO and even Fe metal. Photoemission measurements, which will be discussed later, confirm these assumptions.
On the other hand, at the high 1.010-5 mbar oxygen pressure, the surface reconstruction of Fe3O4 is still visible in RHEED and LEED patterns, but the electron diffraction patterns are slightly broadened, indicating some increasing disorder in this film. A partial transformation of Fe3O4 to -Fe2O3, which has the same inverse spinel structure as magnetite, may have even taken place.

We have also recorded the time development of the crystalline structure during the growth of the films. As an example, we show in Fig. 2 the intensity of the specularly reflected RHEED beam for a Fe3O4 film grown under 1.010-6 mbar oxygen pressure. We can clearly observe pronounced intensity oscillations, which are indicative of a two-dimensional layer-by-layer growth. The time period of the oscillations is 56 s. This period corresponds to the time needed to grow 1 ML of Fe3O4 and allows for a precise thickness determination.
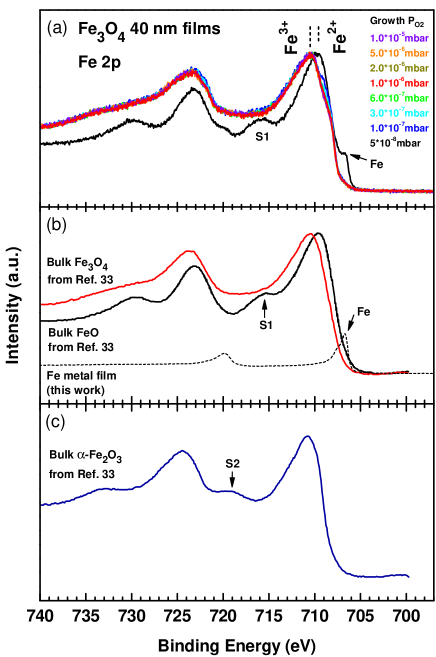
In order to clarify the chemical state of the iron oxide, the Fe core level XPS spectra were recorded for the Fe3O4 films grown under varying oxygen pressures, i.e., from 510-8 to 1.010-5 mbar, while the Fe flux and the thickness are kept constant. The results are plotted in Fig. 3(a). We also display in Fig. 3(b) the XPS spectra of bulk Fe3O4 Moussy2013 , bulk FeO Moussy2013 , and Fe metal film, and in Fig. 3(c) of bulk -Fe2O3Moussy2013 as reference. FeO has a clear satellite feature at 715.5 eV, marked as S1 in Fig. 3(b), while Fe2O3 shows a satellite feature at 719.1 eV, marked as S2 in Fig. 3(c). Such satellite structures are frequently used as fingerprints to identify the other iron oxide phases Chambers1997 ; Gao97 ; Fuji1999 ; Moussy2013 . One can clearly see that with the exception of the sample grown at the low 510-8 mbar pressure, the Fe spectrum for all the other Fe3O4 films show no signs for satellite structures S1 and S2.
The main peaks for Fe3O4 are relatively broad since they are given by the three different Fe contributions in Fe3O4, namely the tetrahedral Fe3+ and the octahedral Fe2+ and Fe3+ sites. The characteristic energies for the Fe2+ and Fe3+ are marked in Fig. 3. Going from high to low pressures: the spectra of the films prepared using 1.010-5 to 6.010-7 mbar all look identical and have very similar line shapes as the ones reported for magnetite in the literature Fuji1999 ; Chambers1997 ; Moussy2013 ; see the top curve in Fig. 3b. Comparing with the spectrum of Fe2O3 in Fig. 3(c) we also learn that a molecular oxygen pressure up to 110-5 mbar is still not enough to form the Fe2O3 phase. Subtle changes at 709 eV energy can be observed for films grown at 3.010-7 and 1.010-7 oxygen pressures, suggesting an increase of the Fe2+ content associated with the presence of oxygen defects. The Fe XPS spectra of the film grown at the lowest oxygen pressure of the series, 510-8 mbar, looks very much different and the feature at 707 eV (indicated by the ”Fe” label) can be taken as an indication that metallic Fe clusters are present since this 707 eV feature is the main peak in the XPS of Fe metal film as plotted in Fig. 3b.

In order to determine the optimum oxygen pressure for the growth of fully stoichiometric Fe3O4 film, we performed temperature dependent resistivity measurements on this set of films. Figure 4 shows that all films except the one grown under 510-8 mbar oxygen pressure exhibit a transition in the resistivity with a clear hysteresis. The Verwey transition is clearly first order in these films. The observation that the sample grown at P = 510-8 mbar does not show any metal-insulator transition is consistent with the results of the electron diffraction (RHEED and LEED) and XPS measurements, which all indicate the presence of a different phase.
We now define the Verwey transition temperature TV- and TV+ as the temperature of the maximum slope of (T) curve for the cooling down and warming up temperature branch, respectively. These transition temperatures are plotted as a function of the oxygen pressure P of the films as inset in Fig. 4. We can observe that TV+ varies between 116 K and 119 K, and that TV- ranges between 113.5 K and 115 K. The highest transition temperature is reached for the sample grown at 1.010-6 mbar oxygen pressure, with a TV+ of 119 K. We therefore choose this as the optimal oxygen pressure for the growth, also because the RHEED and LEED patterns are the best in terms of sharpness, indicating a good crystalline surface structure.

We calculated the absolute value of the room temperature resistivity of our thin films and plotted the results as a function of oxygen pressure in Fig. 5. Interestingly, we found a minimum of the resistivity for P = 1.010-6 mbar Kiyomura1999 . The magnetite film prepared at the optimum oxygen pressure has a room temperature resistivity of about 7 m-cm, compared to 4 m-cm measured in bulk Fe3O4 single crystal Miles57 . The higher resistivity values shown by the Fe3O4 films compared to the bulk may be attributed to the presence of antiphase boundaries (APBs). It was reported that APBs are likely to form in Fe3O4 thin films grown on MgO substrates Eerenstein02 ; Kumar06 because the larger unit cell of Fe3O4 (Fdm) in comparison to that of MgO (Fm3m) makes that nucleation sites equivalent on the MgO are not equivalent for the Fe3O4. Domains of Fe3O4 are therefore formed with APBs between them, and as the magnetic coupling over a large fraction of these boundaries is antiferromagnetic,Eerensteinprl02 these APBs act as scattering centers that hinder electron transport Eerenstein02 ; Kumar06 ; Ramos06 ; Sofin11 .
IV Thickness dependence
Having established the optimum oxygen pressure for growing fully stoichiometric Fe3O4 films, we proceed with the investigation on the effect of the film thickness on the Verwey transition. A new series of Fe3O4 thin films with different thicknesses (5, 10, 20, 40, 80, and 200 nm) was grown on MgO (001) substrates, all at P = 110-6 mbar. The Fe flux is set at 1 Å /min and the substrate temperature at . We verified the crystalline quality using RHEED and LEED. Sharp RHEED streaks of the surface reconstruction and the presence of Kikuchi lines indicate that the surface is very smooth, even after deposition of 200 nm Fe3O4.
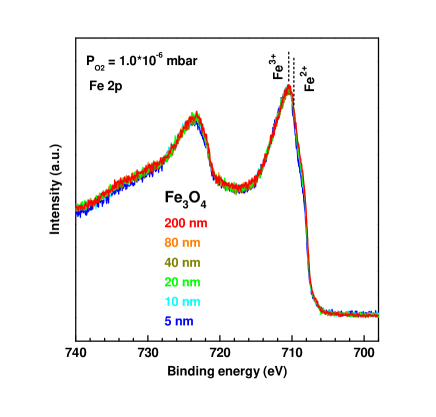
Figure 6 presents the Fe core level XPS spectra of the Fe3O4 films as a function of thickness. Overall, the XPS spectra show the characteristics of stoichiometric magnetite. There are no indications for the presence of other iron oxide phases. Only in the very thin film (5 nm) a slightly smaller Fe2+ contribution to the Fe main peaks can be noticed, otherwise no significant changes are observed with increasing the thickness from 10 nm to 200 nm.

Figure 7 displays the resistivity as a function of temperature for Fe3O4 films with different thicknesses grown on the MgO substrates. The 5 nm thick Fe3O4 film does not show a transition, while the 10 nm and thicker films all reveal a transition with hysteresis, establishing again that the Verwey transition in these films is first order. The transition becomes more pronounced and the transition temperature gets higher with increasing the thickness. The change in resistivity is the largest for the 200 nm Fe3O4 film (the thickest film grown in this study), with also the highest transition temperature (TV+) of about 122 K, similar to the value reported for much thicker films (660 nm) Li98 and close to the value reported for bulk samples Garcia04 ; Miles57 .
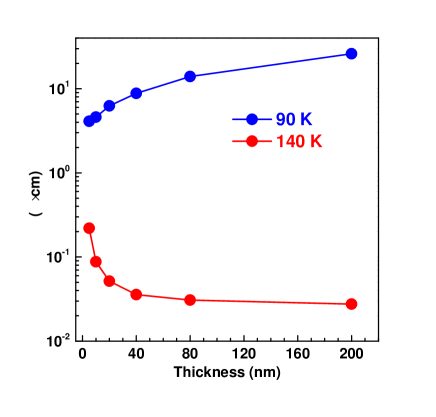
It is interesting to note that the resistivity above the transition temperature is the highest for the thinnest films, but that the situation is opposite below the transition temperature, namely, the highest resistivity is for the thickest films. See Fig. 8 which displays the resistivity at 90 K (below the transition) and 140 K (above the transition) as a function of film thickness. The influence of scattering due to imperfections in the vicinity of the surface and/or interface with the substrate will naturally be larger for the thinner films relative to the thicker ones, so it is to be expected that the thinner films will have higher resistivities. This is the case for temperatures above the transition. However, the situation below the transition requires a different explanation. Apparently the band gap or conductivity gap that can be opened in the low temperature phase is smaller in the thinner films. In fact, the data indicates that such a gap opening does not occur at all in the 5 nm film so that it becomes more conducting than the thicker films in the low temperature phase.
The Verwey transition temperatures TV+ and TV- as a function of thickness are plotted in the inset of Fig. 7. The transition temperature increases rapidly with the initial increase in the film thickness and then gradually approaches a value close to the bulk. Furthermore, the high temperature values of resistivity gradually decrease with increasing the thickness. We would like to note that the transitions shown in Fig. 7 are generally sharper than those reported in earlier Fe3O4 thin film studies; see, for comparison, Refs. [Eerenstein02, ; Kumar06, ; Li98, ; Ramos06, ; Sofin11, ].
The reduction of TV and the broadening of the Verwey transition for thinner films was attributed previously to the residual strain Li98 and the suppression of the orthorhombic deformation which takes place at the Verwey transition VanDeVeerdonk . Eerenstein et al Eerenstein02 have shown that the increase of the resistivity with decreasing film thickness can be related to a strong increase in APBs density, thus a significant decrease in domain size. By using transmission electron microscopy (TEM) they found that the domain size decreases from 40 nm for 100-nm-thick films, to 5 nm for 3-nm-thick films. It was suggested that the absence of the Verwey transition in films thinner than 25 nm may be also related to very small domain size Eerenstein02 . In contrast to the results reported by Eerenstein et al Eerenstein02 , we still observed a clear Verwey transition from a 10 nm thick film.

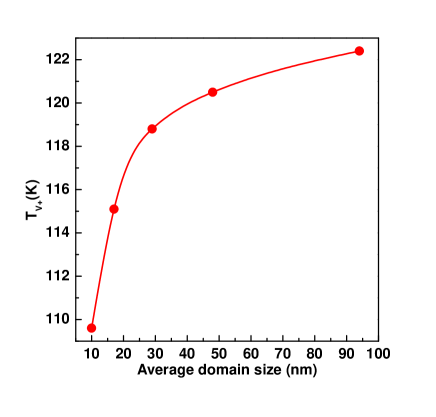
To better understand the effect of the thickness on the Verwey transition in Fe3O4 thin films we looked at the microstructure of our films by high-resolution x-ray diffraction (HR-XRD) and determined the relative changes of the average domain size with thickness. XRD rocking-curve measurements of the in-plane reflection (115) of the 10-, 20-, 40-, 80-, and 200-nm-thick Fe3O4 films grown on MgO are displayed as an inset in Fig. 9. A sharp decrease of the full width at half maximum (FWHM) with increasing the thickness is observed. By using the simple Scherrer formula Scherrer ; Boulch2001 ; Patterson1939 we calculated the average domain size (ADS) taking into account the instrumental broadening. Here we note that fitting the profiles with a Voigt function yields an appreciable Gaussian contribution (beyond that of the instrumental broadening) which indicates the presence of mosaicity in addition to the Lorentzian contribution which represents the average domain size Patterson1939 . Nevertheless, for the purpose of obtaining a crude characterization, we take the presence of mosaicity also as a sign for a decreased domain size. The ADS as a function of thickness is plotted in Fig. 9. It increases from 10 nm for the 10-nm-thick film to 94 nm for the 200-nm-thick film, a trend that agrees well with the results of other groups Eerenstein02 ; Ramos06 ; Eerenstein03 . The fact that the domain size plays an important role and greatly influences the Verwey transition of Fe3O4 thin films is nicely illustrated in Fig. 10, where the TV+ is plotted as a function of the ADS. This result strongly suggests that the larger the ADS of Fe3O4 films the higher the transition temperature TV and the larger the conductivity gap that can be opened in the low temperature phase.
V Strain and microstructure effects
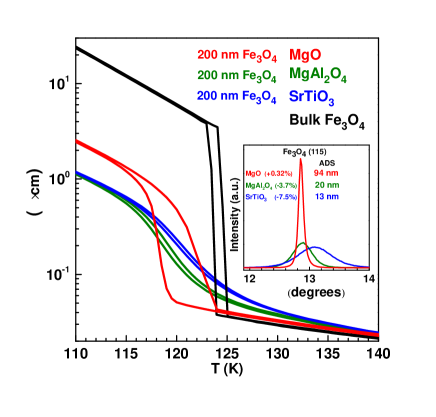
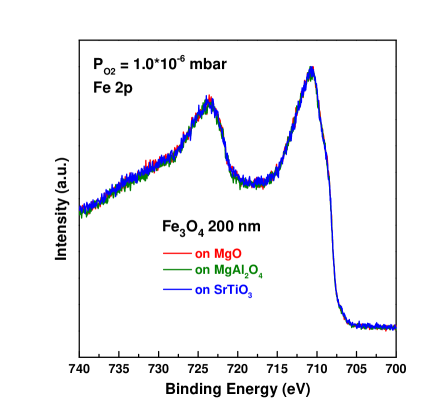
To investigate whether more factors than only oxygen stoichiometry and thickness have an influence on the Verwey transition, we have also grown films on substrates other than MgO. In particular, we have utilized MgAl2O4 (001) (MAO) and SrTiO3 (001) (STO) substrates. The lattice constant of bulk Fe3O4 is 8.397 Å Margulies97 , which is slightly smaller than twice that of MgO with 4.212 Å Margulies97 , but larger than that of MAO with 8.08 Å Eerensteinjmmm03 , and appreciably larger than twice that of STO with 3.905 Å Hamie12 . Figure 11 compares the temperature dependence of the resistivity of 200 nm Fe3O4 films grown on MgO, MAO, and STO with that of a single crystal Fe3O4 as reference. We note that the XPS spectra of the films grown on MgO, MAO and STO are essentially identical, see Fig. 12, indicating that the substrate has no influence on the chemical composition of the film.
We can observe the Verwey transition in bulk Fe3O4 with a TV+ of 125 K and a width of about 1 K. The 200 nm Fe3O4 film on MgO has a TV+ of 122 K with a width of about 3 K. Here the width is defined as the full width at half maximum of the temperature derivative of the resistivity across the transition. The transition for the 200 nm films grown on MAO and STO is by contrast extremely broad with a much less pronounced resistivity change. The width is of order of 10 K, and yet, the temperature curves still show a clear hysteresis, demonstrating that the transition is still first order and not second or higher order Aragon85 ; Kakol92 ; Aragon93 ; Honig95 ; Brabers98 . This is an important finding since the observation of a broad first order transition implies that the system is inhomogenous, i.e. it consists of a distribution of crystallites each having its own (sharp) first order transition temperature.
To address the effect of the substrate, we have to consider first of all the lattice mismatch between Fe3O4 and MgO, MAO, and STO, which are +0.32, -3.77 and -7.5, respectively Margulies97 ; Eerensteinjmmm03 ; Hamie12 . While the 200 nm Fe3O4 on MgO remains fully strained up to very high thicknesses Arora06 , the 200 nm Fe3O4 films on STO and MAO do relax to the bulk structure Luysberg09 due to the large mismatch. For the latter films one may then expect to see a Verwey transition like that of the bulk material, but the experiment reveals a very different behavior. To explain the observed broadness of the transition we performed high resolution x-ray diffraction measurements. Rocking curves of the (115) reflection of the Fe3O4 grown on the different substrates clearly show a much broadened peak for the Fe3O4 films on MAO and STO; see inset in Fig. 11. From these profiles we have calculated the average domain size to be about 20 nm for the Fe3O4 on MAO and 13 nm for Fe3O4 on STO, while it is about 94 nm for Fe3O4 on MgO. This result indicates that the strain relaxation of the Fe3O4 films on MAO and STO is accompanied by a breakup into small domains of Fe3O4 with a wide distribution of the domain size.
Another interesting observation that can be made from Fig. 11 is that the hysteresis is rather small in bulk Fe3O4 as well as in the 200 nm films of Fe3O4 on MAO and STO, i.e., about 1 K, but that the hysteresis is rather large for the 200 nm film on MgO, i.e., about 3 K. Since the hysteresis width does not depend very much on the film thickness, see Fig. 7, and therefore not on the average domain size, see Fig. 9, we deduce that the hysteresis must be connected to growth aspects that make MgO substrates different from MAO and STO. We infer that this is the presence of APBs of Fe3O4 films on MgO associated with equivalent nucleation sites on the MgO separated by nonunit cell vectors of the Fe3O4 lattice. For Fe3O4 films on MAO and STO, on the other hand, we expect the formation of APBs to be much less likely. Indeed, it is quite conceivable that the presence of APBs constitute an important energy barrier for the crystal structure transformation across the Verwey transition.
VI Conclusion
To summarize, we have carried out a systematic experimental investigation to identify the parameters that determine the quality of the Verwey transition in epitaxial Fe3O4 thin films. We have maximized the transition temperature by optimizing the oxygen pressure used for the growth of the films and we have found that the substrate-induced microstructure plays a crucial role. The transition temperature, the resistivity jump, and the conductivity gap of fully stoichiometric films greatly depend on the domain size, which increases gradually with increasing film thickness. The broadness of the transition correlates strongly with the width of the domain size distribution. We infer that the width of the hysteresis is influenced strongly by the presence of antiphase boundaries. Films grown on MgO (001) substrates showed the highest and sharpest transitions, while films grown on substrates with large lattice constant mismatch revealed very broad transitions. In all cases in which the Verwey transition is present, the transition shows a hysteresis behavior and is therefore first order by nature, irrespective of the broadness in temperature of the transition.
We note that for films grown on MgO substrates, anti-phase boundaries are inevitable, but perhaps prolonged annealing may help to increase the domain size Eerenstein03 . For films grown on spinel substrates, one can speculate that perhaps the domain size can also be enlarged by using substrates with smaller lattice mismatch.
ACKNOWLEDGEMENTS
We would like to thank T. Mende and C. Becker for their skillful technical assistance. The research of X.H.L was supported by the Max Planck-POSTECH Center for Complex Phase Materials.
References
- (1) R. A. de Groot, F. M. Mueller, P. G. van Engen, and K. H. J. Buschow, Phys. Rev. Lett. 50, 2024 (1983).
- (2) A. Yanase, and K. Siratori, J. Phys. Soc. Japan 53, 312 (1984).
- (3) R. A. de Groot, F. M. Mueller, P. G. van Engen, and K. H. J. Buschow, J. Appl. Phys. 55, 2151 (1984).
- (4) R. A. de Groot, and K. H. J. Buschow, J. Magn. Magn. Mater. 54, 1377 (1986).
- (5) D. M. Lind, S. D. Berry, G. Chern, H. Mathias, and L. R. Testardi, Phys. Rev. B 45, 1838 (1992).
- (6) Y. Gao, and S. A. Chambers, J. Crys. Growth 174, 446 (1997).
- (7) Y. J. Kim, Y. Gao, and S. A. Chambers, Surf. Sci. 371, 358 (1997).
- (8) Y. Gao, Y. J. Kim, S. A. Chambers, and G. Bai, J. Vac. Sci. Technol. A 15, 332 (1997).
- (9) Y. Gao, Y. J. Kim, and S. A. Chambers, J. Mater. Res. 13, 2003 (1998).
- (10) S. A. Chambers, and S. A. Joyce, Surf. Sci. 420, 111 (1999).
- (11) S. A. Chambers, S. Thevuthasan, and S. A. Joyce, Surf. Sci. 450, L273 (2000).
- (12) B. Stanka, W. Hebenstreit, U. Diebold, and S. A. Chambers, Surf. Sci. 448, 49 (2000).
- (13) S. A. Chambers, Surf. Sci. Rep. 39, 105 (2000).
- (14) F. C. Voogt, T. Hibma, P. J. M. Smulders, L. Niesen, and T. Fujii, in Epitaxial Oxide Thin Films III, edited by C-B. Eom, M. E. Hawley, C. M. Foster, J. S. Speck, MRS Symposium Proceedings No. 474 (Materials Research Society, Pittsburgh, 1997), pp. 211-216.
- (15) F. C. Voogt, T. T. M. Palstra, L. Niesen, O. C. Rogojanu, M. A. James, and T. Hibma, Phys. Rev. B 57, R8107 (1998).
- (16) F. C. Voogt, T. Fujii, P. J. M. Smulders, L. Niesen, M. A. James, and T. Hibma, Phys. Rev. B 60, 11193 (1999).
- (17) P. J. H. Bloemen, P. A. A. van der Heijden, R. M. Wolf, J. van de Stegge, J. T. Kohlhepp, A. Reinders, R. M. Jungblut, P. J. van der Zaag, and W. J. M. de Jonge, in Epitaxial Oxide Thin Films II, edited by D. K. Fork, T. Shiosaki, J. S. Speck, R. W. Wolf, MRS Symposium Proceedings No. 401 (Materials Research Society, Pittsburgh, 1996), pp. 485-499.
- (18) J. M. Gaines, P. J. H. Bloemen, J. T. Kohlhepp, C. W. T. Bulle-Lieuwma, R. M. Wolf, A. Reinders, R. M. Jungblut, P. A. A. van der Heijden, J. T. W. M. van Eemeren, J. van de Stegge, and W. J. M. de Jonge Surf. Sci. 373, 85 (1997).
- (19) J. M. Gaines, J. T. Kohlhepp, P. J. H. Bloemen, R. M. Wolf, A. Reinders, and R. M. Jungblut, J. Magn. Magn. Mater. 165, 439 (1997).
- (20) J. F. Anderson, M. Kuhn, U. Diebold, K. Shaw, P. Stoyanov, and D. Lind Phys. Rev. B 56, 9902 (1997).
- (21) P. A. A. van der Heijden, J. J. Hammink, P. J. H. Bloemen, R. M. Wolf, M. G. van Opstal, P. J. van der Zaag, and W. J. M. de Jonge, in Magnetic Ultrathin films, Multilayers and Surfaces, edited by A. Fert, H. Fujimori, G. Guntherodt, B. Heinrich, W. F. Egelhoff, Jr., MRS Symposium Proceedings No. 384 (Materials Research Society, Pittsburgh, 1995), pp. 27-32.
- (22) P. A. A. van der Heijden, M. G. van Opstal, C. H. W. Swuste, P. H. J. Bloemen, J. M. Gaines, and W. J. M. de Jonge, J. Magn. Magn. Mater. 182, 71 (1998).
- (23) W. F. J. Fontijn, R. M. Wolf, R. Metselaar, and P. J. van der Zaag, Thin Solid Films 292, 270 (1997).
- (24) T. Hibma, F.C. Voogt, L. Niesen, P. A. A. van der Heijden, W. J. M. de Jonge, J. J. T. M. Donkers, and P. J. van der Zaag, J. Appl. Phys. 85, 5291 (1999).
- (25) T. Fujii, M. Takano, R. Katano, Y. Bando, and Y. Isozumi, J. Cryst. Growth 99, 606 (1990).
- (26) T. Fujii, M. Takano, R. Katano, Y. Bando, and Y. Isozumi J. Appl. Phys. 68, 1735 (1990).
- (27) T. Fujii, M. Takano, R. Katano, Y. Isozumi, and Y. Bando, J. Magn. Magn. Mater. 130, 267 (1994).
- (28) T. Fujii, F. M. F. de Groot, G. A. Sawatzky, F.C. Voogt, T. Hibma, K. Okada, Phys. Rev. B 59, 3195 (1999).
- (29) A. V. Mijiritskii, and D. O. Boerma, Surf. Sci. 486, 73 (2001).
- (30) A. Subagyo, and K. Sueoka, Jpn. J. Appl. Phys. 45, 2255 (2006).
- (31) M. Fonin, R. Pentcheva, Y. S. Dedkov, M. Sperlich, D. V. Vyalikh, M. Scheffler, U. Rudiger, and G. Guntherodt, Phys. Rev. B 72, 104436 (2005).
- (32) T. Kiyomura, M. Gomi, Y. Maruo and H. Toyoshima, IEEE Trans. Magn. 35, 3046 (1999).
- (33) J.-B., Moussy, J. Phys. D: Appl. Phys. 46, 143001 (2013).
- (34) E. J. W. Verwey, Nature (London) 144, 327 (1939).
- (35) W. Eerenstein, T. T. M. Palstra, T. Hibma, and S. Celotto, Phys. Rev. B 66, 201101 (R) (2002).
- (36) R. Kumar, M. W. Khan, J. P. Srivastava, S. K. Arora, R. G. S. Sofin, R. J. Choudhary, and I. V. Shvets, J. Appl. Phys. 100, 033703 (2006).
- (37) S. P. Sena, R. A. Lindley, H. J. Blythe, C. Sauer, M. A. Kafarji, G. A. Gehring, J. Magn. Magn. Mater. 176, 111 (1997).
- (38) S. Kale, S. M. Bhagat, S. E. Lofland, T. Scabarozi, S. B. Ogale, A. Orozco, S. R. Shinde, T. Venkatesan, B. Hannoyer, B. Mercey, and W. Prellier, Phys. Rev. B 64, 205413 (2001).
- (39) G. Q. Gong, A. Gupta, G. Xiao, W. Qian, and V. P. Dravid, Phys. Rev. B 56, 5096 (1997).
- (40) X. W. Li, A. Gupta, G. Xiao, and G. Q. Gong, J. Appl. Phys. 83, 7049 (1998).
- (41) S. K. Arora, R. G. S. Sofin, and I. V. Shvets, Phys. Rev. B 72, 134404 (2005).
- (42) S. K. Arora, R. G. S. Sofin, I. V. Shvets, and M. Luysberg, J. Appl. Phys. 100, 073908 (2006).
- (43) A. V. Ramos, J. B. Moussy, M. J. Guittet, A. M. Bataille, M. G. Soyer, M. Viret, C. Gatel, P. B. Guillemaud, and E. Snoeck, J. Appl. Phys. 100, 103902 (2006).
- (44) M. Ziese, and H. J. Blythe, J. Phys.: Condens. Matter 12, 13 (2000).
- (45) M. Ziese, Phys. Rev. B 62, 1044 (2000).
- (46) M. Ziese, Rep. Prog. Phys. 65, 143 (2002).
- (47) S. Geprags, D. Mannix, M. Opel, S. T. B. Goennenwein, and R. Gross, Phys. Rev. B 88, 054412 (2013).
- (48) W. Wang, J. M. Mariot, M. C. Richter, O. Heckmann, W. Ndiaye, P. De Padova, A. Taleb-Ibrahimi, P. Le Fevre, F. Bertran, F. Bondino, E. Magnano, J. Krempasky, P. Blaha, C. Cacho, F. Parmigiani, and K. Hricovini, Phys. Rev. B 87, 085118 (2013).
- (49) M. Liu, J. Hoffman, J. Wang, J. Zhang, B. N. Cheeseman, and A. Bhattacharya, Sci. Rep. 3:1876 DOI: 10.1038/srep01876 (2013); Sci. Rep. 3:3582 DOI: 10.1038/srep03582 (2013).
- (50) N. Naftalis, A. Kaplan, M. Schultz, C. A. F. Vaz, J. A. Moyer, C. H. Ahn, and L. Klein, Phys. Rev. B 84, 094441 (2011).
- (51) J. B. Moussy, S. Gota, A. Bataille, M. J. Guittet, M. Gautier-Soyer, F. Delille, B. Dieny, F. Ott, T. D. Doan, P. Warin, P. Bayle-Guillemaud, C. Gatel, and E. Snoeck, Phys. Rev. B 70, 174448 (2004).
- (52) D. T. Margulies, F. T. Parker, F. E. Spada, R. S. Goldman, J. Li, R. Sinclair, and A. E. Berkowitz, Phys. Rev. B 53, 9175 (1996).
- (53) J. Orna, P. A. Algarabel, L. Morellon, J. A. Pardo, J. M. de Teresa, R. Lopez Anton, F. Bartolome, L. M. Garcia, J. Bartolome, J. C. Cezar, and A. Wildes, Phys. Rev. B 81, 144420 (2010).
- (54) Ricardo Aragon, Douglas J. Buttrey, John P. Shepherd, and Jurgen M. Honig, Phys. Rev. B 31, 430 (1985).
- (55) Z. Kakol, J. Sabol, J. Stickler, and J. M. Honig, Phys. Rev. B 46, 1975 (1992).
- (56) R. Aragon, P. M. Gehring, and S. M. Shapiro, Phys. Rev. Lett. 70, 1635 (1993).
- (57) J. M. Honig,J. Alloys and Compounds 229, 24 (1995).
- (58) V. A. M. Brabers, F. Walz, and H. Kronmuller, Phys. Rev. B 58, 14163 (1998).
- (59) F. C. Voogt, Ph.D. thesis, 1998, Materials Science Centre, University of Groningen, the Netherlands.
- (60) X. L. Huang, Y. Yang, and J. Ding, Acta Materialia 61, 548 (2013).
- (61) P. A. Miles, W. B. Westphal, and A. von Hippel, Rev. Mod. Phys. 29, 279 (1957).
- (62) W. Eerenstein, T. T. M. Palstra, S. S. Saxena, and T. Hibma, Phys. Rev. Lett. 88, 247204 (2002).
- (63) R. G. S. Sofin, S. K. Arora, and I. V. Shvets, Phys. Rev. B 83, 134436 (2011).
- (64) J. Garcia, and G. Subias, J. Phys.: Condens. Matter 16, R145 (2004).
- (65) R. J. M. van de Veerdonk, M. A. M. Gijs, P. A. A. van der Heijden, R. M. Wolf, and W. J. M. de Jonge, in Epitaxial Oxide Thin Films II, edited by D. K. Fork, T. Shiosaki, J. S. Speck, R. W. Wolf, MRS Symposium Proceedings No. 401 (Materials Research Society, Pittsburgh, 1996), pp. 455-460.
- (66) DS = 0.9Cu/(Bstructcos), where Cu is 1.54056 Å, Bstruct describes the structural broadening, which is the difference in integral profile width between a standard (0.006) and the sample to be analyzed, and is the angle of incidence.
- (67) F. Boulch, M. C. Schouler, P. Donnadieu, J. M. Chaix, and E. Djurado, Image Anal Stereol 20, 157 (2001).
- (68) A. L. Patterson, Phys. Rev. 56, 978 (1939).
- (69) W. Eerenstein, T. T. M. Palstra, T. Hibma, and S. Celotto, Phys. Rev. B 68, 014428 (2003).
- (70) D. T. Margulies, F. T. Parker, M. L. Rudee, F. E. Spada, J. N. Chapman, P. R. Aitchison, and A. E. Berkowitz, Phys. Rev. Lett. 79, 5162 (1997).
- (71) W. Eerenstein, L. Kalev, L. Niesen, T. T. M. Palstra, and T. Hibma, J. Magn. Magn. Mater. 258, 73 (2003).
- (72) A. Hamie, Y. Dumont, E. Popova, A. Fouchet, B. W. Fonrose, C. Gatel, E. Chikoidze, J. Scola, B. Berini, and N. Keller, Thin Solid Films 525, 115 (2012).
- (73) M. Luysberg, R. G. S. Sofin, S. K. Arora, and I. V. Shvets, Phys. Rev. B 80, 024111 (2009).