On the diffuse X-ray emission from the Wolf-Rayet bubble NGC 2359
Abstract
A recent XMM-Newton observation (Zhekov 2014) has revealed diffuse X-ray emission inside the nebula NGC 2359 around the Wolf-Rayet star WR 7. Taking advantage of an improved point-source rejection and background subtraction, and a detailed comparison of optical and X-ray morphology, we have reanalyzed these X-ray observations. Our analysis reveals diffuse X-ray emission from a blowout and the presence of emission at energies from 1.0 to 2.0 keV. The X-ray emission from NGC 2359 can be described by an optically-thin plasma emission model, but contrary to previous analysis, we find that the chemical abundances of this plasma are similar to those of the optical nebula, with no magnesium enhancement, and that two components at temperatures =2106 K and =5.7107 K are required. The estimated X-ray luminosity in the 0.3–2.0 keV energy range is =21033 erg s-1. The averaged rms electron density of the X-ray-emitting gas (0.6 cm-3) reinforces the idea of mixing of material from the outer nebula into the hot bubble.
keywords:
ISM: bubbles — ISM: individual objects (NGC 2359) — stars: Wolf-Rayet — X-rays: individual (NGC 2359)1 Introduction
High-quality X-ray observations (Chandra, XMM-Newton, and Suzaku) have been performed towards five WR nebulae, namely S 308, NGC 2359, RCW 58, and NGC 6888 (around WR 6, WR 7, WR 40, and WR 136, respectively) and that around WR 16, but diffuse X-ray emission has been detected only in three of them (S 308, NGC 2359, and NGC 6888; Chu et al., 2003; Gosset et al., 2005; Zhekov & Park, 2011; Toalá et al., 2012; Toalá & Guerrero, 2013; Toalá et al., 2014; Zhekov, 2014). In the cases of S 308 and NGC 6888, their X-ray spectra have been modeled with two-temperature plasma emission. The first temperature component is around 1-1.4106 K and the second 107 K, which contributes 10% of the total flux. The diffuse X-ray emission in these two WR bubbles has been successfully modeled using the optical nebular abundances, strongly indicative of injection of material from the outer ionized nebula into the hot interiors via instabilities created in the wind-wind interaction zone and/or via thermal conduction (e.g., Arthur, 2007; Pittard, 2007; Toalá & Arthur, 2011; Dwarkadas & Rosenberg, 2013). The spectral similarities do not translate to the spatial properties of the diffuse emission: S 308 displays a limb-brightened morphology, while NGC 6888 exhibits three maxima detected with Chandra and XMM-Newton (Toalá et al., 2012, 2014, Toalá et al. in prep.). It is, thus, imperative to increase the number of detections of WR bubbles that harbor diffuse hot gas in order to study the similarities (or differences), to study their dependence on the structure of the ISM and physical parameters of stellar winds that produce the hot plasma.
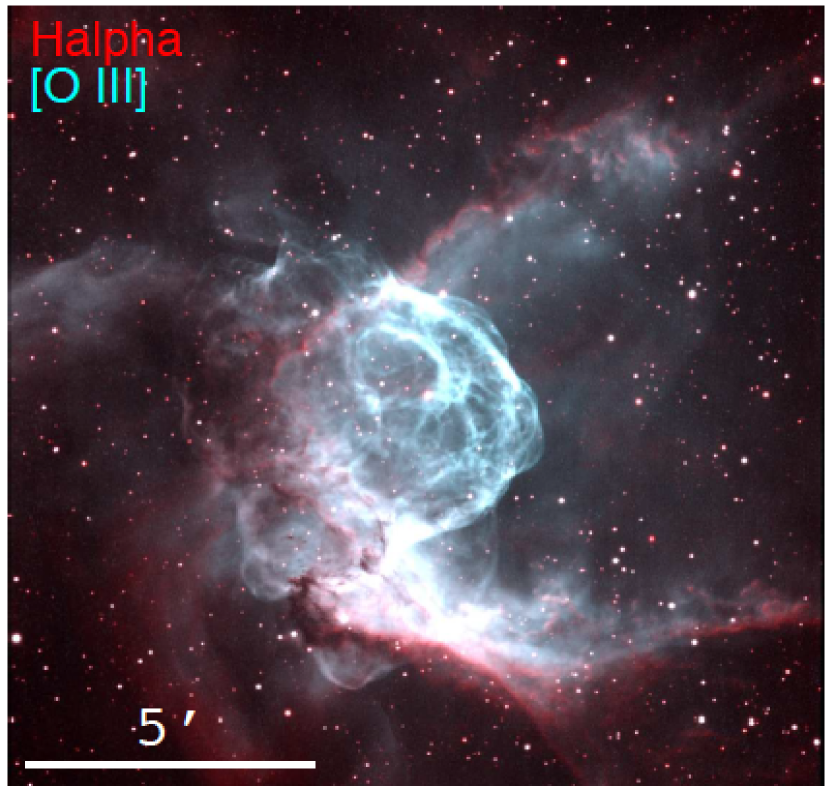
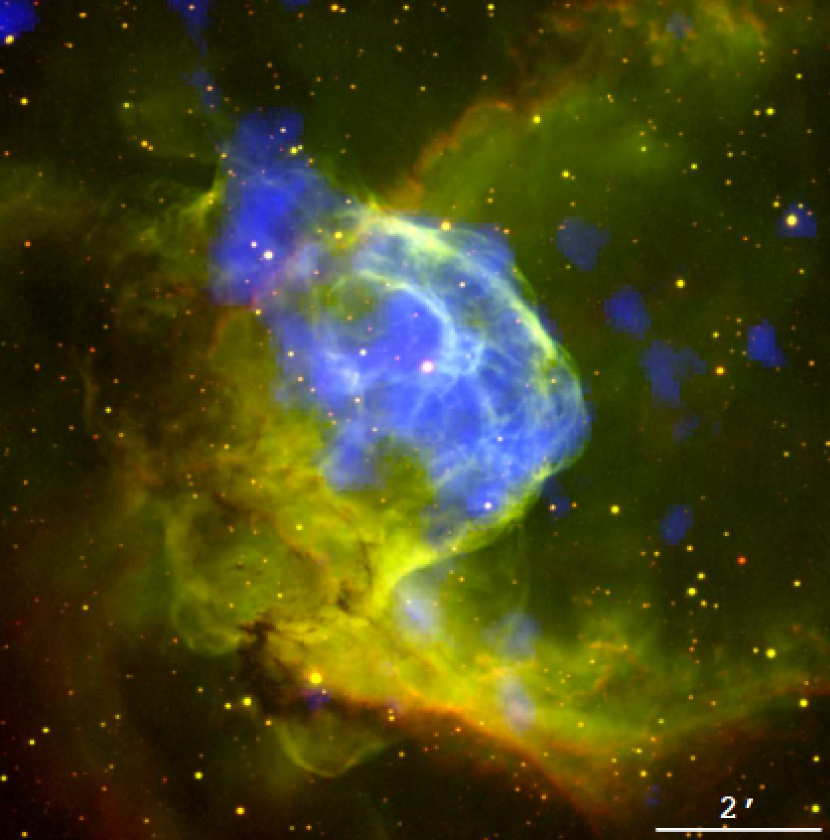
The WR nebula NGC 2359 around WR 7 presents a filamentary central bubble, blisters, and several filaments as seen in the optical image presented in Figure 1. These characteristics indicate that the central star has experienced a phase of strong and episodic mass loss as a yellow supergiant and/or luminous blue variable (LBV). Recently, Zhekov (2014, hereafter Z14) presented the discovery of diffuse X-ray emission towards this WR bubble. The XMM-Newton observations were analyzed using the XMM-ESAS tasks which are optimized for extended sources and apply very restrictive criteria for the selection of events that reduce considerably the net count number. The resulting spectrum was modeled with a single plasma temperature (=0.21 keV; =2.4106 K) for abundances of the optical nebula with anomalously enhanced magnesium abundances. The value of the reduced of the fit is smaller than unity, /DoF=0.72, casting doubts on the validity of the fit as it suggests that the errors in the data have been over-estimated.
Another problem that plagued the spectral fit presented by Z14 is the presence of an emission line at 1.14 keV, which has no identification and whose presence/absence depends on the selection of the background.
In this work we present a reanalysis of the XMM-Newton observations of NGC 2359. We show that point-like sources not removed by Z14 and a questionable selection of the background hampered the analysis of the diffuse X-ray emission. An additional patch of diffuse X-ray emission towards the northeast from the central WR star was also missed by that study. Our spectrum allows better spectral analysis up to energies of 3.0 keV improving the quality of the spectral and spatial characterizations and reliability of the analyses.
This paper is presented as follows. In Section 2 we give a short summary of the XMM-Newton observations. Section 3 and 4 present the distribution of the diffuse X-ray emission and the spectral analysis, respectively. We discuss our findings in Section 5, and finally conclude in Section 6.
2 XMM-Newton Observations
The XMM-Newton observations of the WR nebula NGC 2359 were performed on 2013 April 9 (Obs.Id: 0690390101; PI: S. Zhekov) during revolution 2442. The EPIC cameras (MOS1, MOS2, and pn) were operated in the full-frame mode with the medium optical filter for total exposure times of 110.8, 110.9, and 109.3 ks, respectively. The observations were processed using the XMM-Newton Science Analysis Software (SAS Ver 13.5.0) with the associated calibration Files (CCF) available on 2014 June 16.
We first analyzed the observations making use of the XMM-ESAS tasks to produce images of NGC 2359 in different energy bands (see Section 3). This allowed us to identify the distribution of the diffuse X-ray emission and the locations of point-like sources. We then used the SAS tasks evselect, arfgen, and rmfgen to extract the X-ray spectrum of the diffuse X-ray emission from the WR nebula and produce the associated calibration matrices as described in the corresponding SAS threads (Section 4). This is justified because the diffuse X-ray emission in NGC 2359 does not fill the field of view of the EPIC cameras. Whereas the XMM-ESAS tasks apply very restrictive event selection criteria which are appropriate for the analysis of the spatial distribution of the X-ray emission, these are not required for spectral analysis.
3 Distribution of the X-ray emission
The X-ray images were produced following Snowden & Kuntz’s cookbook for analysis of XMM-Newton EPIC observations of extended objects and the diffuse background (Version 5.9) taking into account their corresponding Current Calibration Files111ftp://legacy.gsfc.nasa.gov/xmm/software/xmm-esas/xmm-esas-v13.pdf. These routines remove the contribution from astrophysical background, soft proton background, and solar wind charge-exchange reactions. The final net exposure times of the MOS1, MOS2, and pn cameras are 89.1, 92.5, and 64.6 ks, respectively.
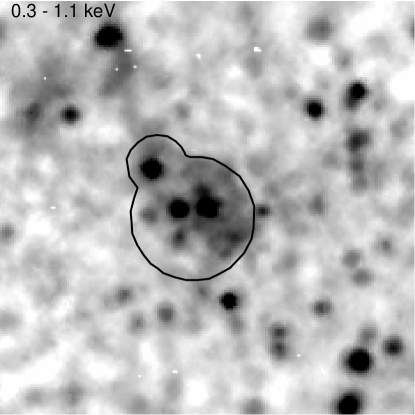
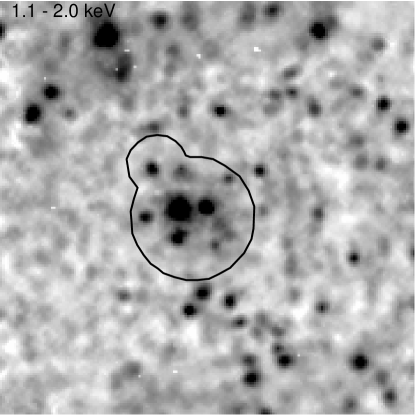
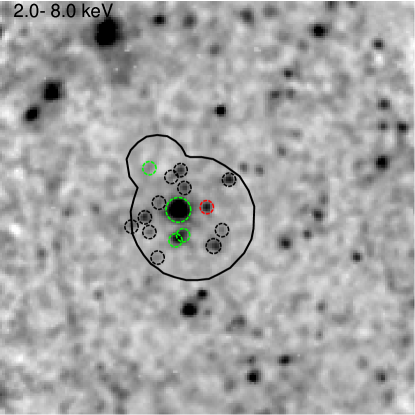
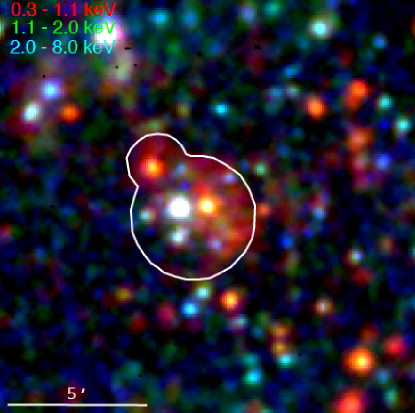
We created exposure-map-corrected, background-subtracted EPIC images in three different energy bands: 0.3–1.1 (soft), 1.1–2.0 (medium), and 2.0–8.0 keV (hard). Figure 2 shows the resulting images. These images have been adaptively smoothed using the adapt task requesting 100, 50, and 50 counts for the soft, medium, and hard band, respectively. As shown by Z14, diffuse emission is detected towards the WR nebula, but we note here an additional spatial component to the northeast of the central bubble. This is spatially coincident with a blowout observed in Figure 1 and imaged in great detail as presented in the Astronomy Picture of the Day by the team of the Star Shadows Remote Observatory (SSRO) South on 2010 June 5222See http://apod.nasa.gov/apod/ap100605.html. We will define the diffuse X-ray emission from NGC 2359 as the emission delineated by the solid line aperture shown in Figure 2, which encompasses the main nebula seen in Figure 1 and the extra blowout detected towards the northeast.
Figure 2 exhibits a significant number of point-like sources projected within the WR nebula. We identify 16 sources within the diffuse emission, including the central WR star, consistent with the pipeline identification of point-like sources. We note that Z14 only excised the five point sources, marked by red and green dashed circles in Figure 2 (bottom-left panel) from its spectral analysis of the diffuse emission from NGC 2359. Consequently, the remaining 11 point sources contaminated the spectrum of the diffuse emission presented by Z14.
In order to illustrate further the distribution of hot gas in NGC 2359 we have created a composite colour picture of the optical and soft X-ray images as shown in Figure 3. Point-like sources have been excised from this image making use of the CIAO dmfilth routine (CIAO Version 4.4; Fruscione et al., 2006). This image shows in great detail that the hot gas in NGC 2359 is distributed inside the main bubble with a contribution filling the northeast blowout.
4 Spectral extraction and analysis
For the rest of the X-ray data analysis, i.e., the spectra extraction and modeling, we reprocessed the data with the SAS tasks epproc and emproc. We then created lightcurves binning the data over 100 s for each of the EPIC cameras (MOS and pn) in the 10–12 keV energy range to identify periods of high background level. The background in the EPIC-pn and MOS cameras were considered high for values of 0.5 counts s-1 and 0.2 counts s-1, respectively. The net exposure times after excising high-background levels are 98.6, 98.6 and 83.8 ks, for the MOS1, MOS2, and pn cameras, respectively. As can be seen, this procedure does not reduce considerably the net exposure time of the EPIC cameras as compared to the net times obtained with the ESAS task, specially for the EPIC-pn camera.
The spectra of the three EPIC cameras and background have been extracted from a polygonal and circular apertures, respectively, as shown in Figure 4. We note that the selection of the background aperture by Z14 was unfortunate as it included diffuse emission from the northeast blowout.
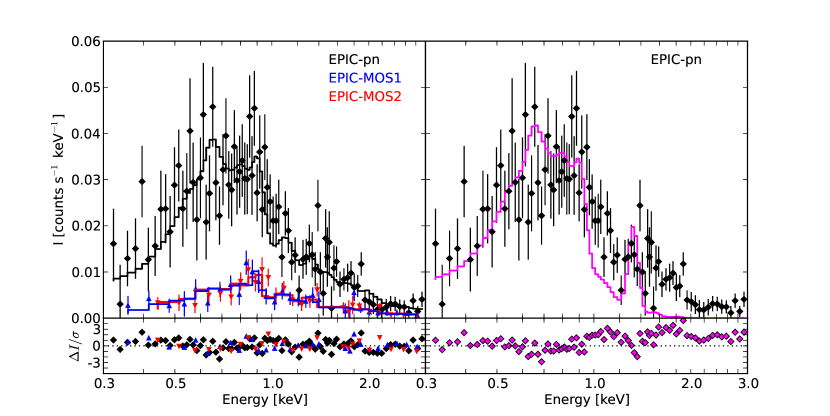
The count rates in the 0.3–1.5 keV range are 5.7, 6.1, and 25.9 counts ks-1, corresponding to 570, 600, and 2170 total counts for the EPIC cameras MOS1, MOS2, and pn, respectively. In the 0.3–3.0 keV energy range, the corresponding count rates are 8.4, 8.8, and 32.4 counts ks-1 and total counts 820, 870, and 2700 counts333Z14 only concentrated the spectral analysis in the 0.3-1.44 keV energy range.. Figure 5-left shows the resultant background-subtracted spectra of the diffuse emission in NGC 2359 in the 0.3–3.0 keV energy range as extracted from the EPIC-pn and MOS observations. A minimum of 60 counts per bin was requested for the creation of the spectra.
To assess the contamination level to the diffuse emission caused by the 11 point sources not excised by Z14, we have extracted their spectra from the EPIC-pn observations. The total count number from these 11 point sources in the 0.3–3.0 keV energy range is 400 counts, i.e., about 15% the count number of the diffuse X-ray emission in NGC 2359. Remarkably, the average spectrum of these sources is much harder than that of the diffuse emission from NGC 2359 (Figure 2), implying that their relative contribution to the spectrum extracted by Z14 increases with energy. This modifies the spectral shape of the diffuse emission reported in that paper.
4.1 Spectral properties
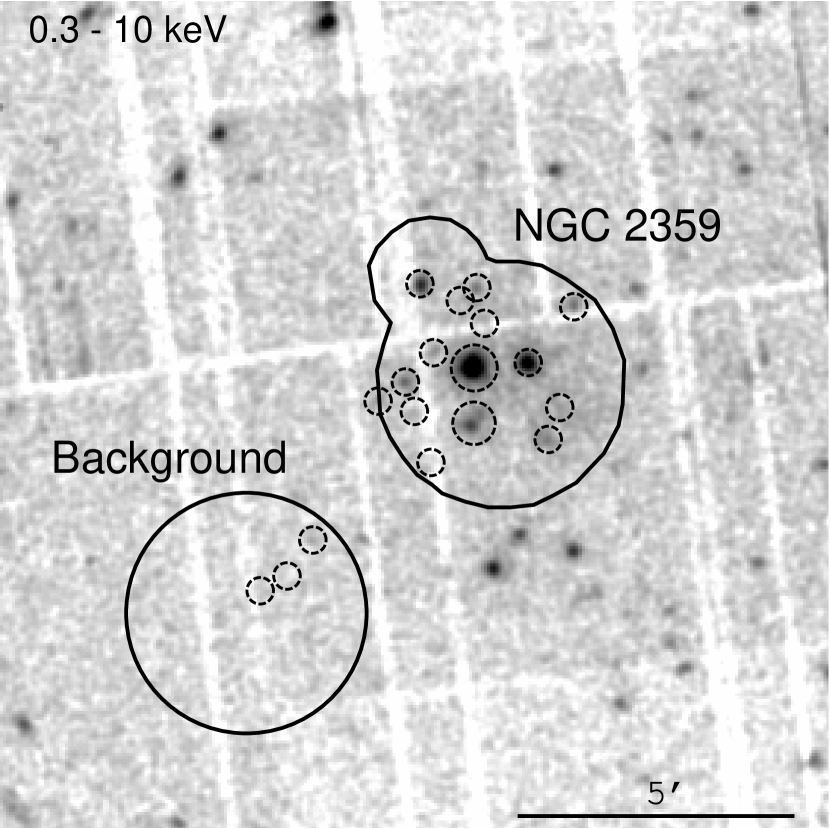
Figure 5 shows that the diffuse X-ray emission in NGC 2359 is detected mainly in the energy range of 0.3–2.0 keV, with a broad peak around 0.5–0.9 keV. More specifically, there are two apparent maxima at 0.6–0.7 and at 0.9 keV. There is a sharp decline above 0.9 keV with line contribution at 1.5 keV which would correspond to the Mg xi line described by Z14.
Following previous X-ray studies of WR nebulae, we used XSPEC (v12.8.1; Arnaud, 1996) to model the diffuse X-ray emission in NGC 2359. We first tried to fit an absorbed one-temperature apec optically thin plasma emission model following the procedure described by Z14, adopting nebular abundances as those reported by Esteban et al. (1993). To allow a fair comparison we fixed the column density to =4.771021 cm-2, which is the value adopted in Z14, even though this value is higher than the upper limit indicated by the extinction towards the central star in NGC 2359, WR 7. Details of all models attempted in this section are presented in Table 1.
The first model was performed on the EPIC-pn spectrum (Model A). This resulted in a poor fit (/DoF=3.30) with a temperature component of =0.180 keV. The second model was attempted with variable Mg (Model B) as used by Z14 but resulted in a similarly poor fit (/DoF=2.96; =0.175 keV) and a magnesium abundance of =40.6 times its solar value (Anders & Grevesse, 1989). This model is presented in Figure 5-right panel with a magenta solid line in comparison with the EPIC-pn spectrum (black diamonds).
We next model the EPIC-pn spectrum with two temperature components (Model C). This resulted in a better fit (/DoF=1.01) with plasma temperatures of =0.16 keV and =4.6 keV. Model D allowed the magnesium abundance to vary, but it resulted in very similar temperature components and varied around its solar value (=1.75).
| Model | /DoF | ||||||||
| (keV) | (cm-5) | (cgs) | (cgs) | (keV) | (cm-5) | (cgs) | (cgs) | ||
| A | 0.180 | 2.2610-3 | 4.210-14 | 1.210-12 | … | … | … | … | 280.82/58.10=3.30 |
| B | 0.175 | 2.2010-3 | 4.610-14 | 1.210-12 | … | … | … | … | 249.20/84.19=2.96 |
| C | 0.161 | 2.7010-3 | 3.510-14 | 1.210-12 | 4.6 | 1.1010-4 | 3.010-14 | 1.110-13 | 84.13/83=1.01 |
| D | 0.160 | 2.7210-3 | 3.610-14 | 1.210-12 | 4.5 | 1.0510-4 | 2.910-14 | 8.010-14 | 83.09/82=1.01 |
| E | 0.173 | 2.0410-3 | 3.510-14 | 1.110-12 | 4.9 | 1.0710-4 | 2.910-14 | 8.010-14 | 125.92/135=0.93 |
| Fc | 0.157 | 3.6010-3 | 3.710-14 | 1.610-12 | 4.8 | 1.1010-4 | 2.810-14 | 8.310-14 | 125.47/134=0.94 |
-
aThe normalization parameters is defined as , where , and are the distance, electron density, and volume in cgs units, respectively.
-
b and represent the absorbed and unabsorbed fluxes. Fluxes are computed in the 0.3–2.0 keV energy range. All fluxes are in cgs units (erg cm-2 s-1).
-
cModel F was performed with a variable absorption column density. This model resulted in a 5.151021 cm-2.
We decided to fit simultaneously the three EPIC (pn, MOS1, and MOS2) spectra444Note that the count number in our MOS spectra are comparable to that find for the EPIC-pn spectrum in Z14. with a two-temperature optically thin plasma model and abundances as those determined from the optical nebula (Model E). The resultant plasma temperature components are =0.17 keV and =4.9 keV with a good quality (=0.93). Model E is shown in Figure 5-left panel with solid black, blue, and red lines for the EPIC-pn, MOS1, and MOS2, respectively.
Finally, we fit the three EPIC cameras with a two-temperature plasma model with variable absorption column density (Model F). This also resulted in a good fit (/DoF=0.94) with a higher absorption column, 1021 cm-2, and similar temperature components within the errors (=0.157 keV and =4.75 keV; see Table 1) as Model E.
We would like to mention that models with variable neon abundance were also attempted to raise the emission around 0.9 keV, but did not yield a major improvement, with values ranging around its nebular value.
5 Discussion
We have reanalysed the XMM-Newton archival observations towards NGC 2359 in two steps: (i) using the XMM-ESAS task to study the distribution of the diffuse X-ray emission and point-like sources and (ii) extracting spectra from the three EPIC cameras reprocessing the observations with the classic SAS procedures.
The X-ray images of NGC 2359 allowed us to disentangle the diffuse emission from that coming from point-like sources in a very effective way. This procedure has also helped us identify an additional spatial component associated with a blowout at the northeast rim of the WR bubble. Such blisters or blowouts are also detected in the XMM-Newton and Chandra observations towards S 308 and NGC 6888 (Toalá et al., 2012, 2014, and Toalá et al. in prep.) and might have different origins. In the case of NGC 6888 the caps seem to be interacting with the interstellar medium and the formation of the blowout is due to the low density towards the northwest (see Figure 7 in Toalá et al., 2014). In the case of NGC 2359, it seems to be interacting with material ejected in a previously eruptive and non-isotropic wind, this is, the previous dense material did not have a distribution. Indeed, Rizzo et al. (2003) found three different velocity components towards NGC 2359 that reinforces the idea that WR 7 evolved through an LBV phase. Furthermore, it is probable that the southeastern blister shown in Figure 1 is also part of the main nebula but due to the molecular material in the line of sight towards this region (St-Louis et al., 1998; Cappa et al., 2001; Rizzo et al., 2001, 2003) could not be detected in X-rays. This is corroborated by the lack of diffuse X-ray emission towards the southeast of the nebula as illustrated in Figure 2 and 3. The variations in the foreground absorption precludes a clear view of the distribution of the X-ray-emitting gas. With all this in mind, the formation scenario of such a complex WR bubble should not be taken lightly as it would require the assumption of a previous LBV non-isotropic wind with massive ejections of material and the inclusion of the photoionizing flux from the central star in the WR phase.
The physical conditions of the hot gas in NGC 2359 can be assessed by modeling the X-ray spectra. Table 1 and Figure 5 illustrate that one-temperature plasma models do not result in good quality fits. A one-temperature plasma model is not able to fit the most energetic part of the spectrum as shown by the magenta line in Figure 5-right panel (Model B). The analysis presented by Z14 does not model the spectral range above 1.44 keV, in which a considerably emission is present. Leaving the magnesium abundance as a free parameters makes the abundance increase because the model tries to compensate the lack of emission in the one-temperature model towards energies around 1.5 keV. On the other hand, two-temperature plasma models improve the fits to the observed spectra and it is consistent to that found for other WR nebulae (e.g., Chu et al., 2003; Zhekov & Park, 2011; Toalá et al., 2012; Toalá & Guerrero, 2013; Toalá et al., 2014). A low temperature component is used to model the bulk of the X-ray emission while a higher-temperature component models the extra emission at higher energies. Model E, performed with a fixed 4.771021 cm-2 and simultaneously fitting the three EPIC spectra, yielded reasonable fits with temperature components =2106 K and =5.7107 K and close to the solar value. Model F, which allowed the absorption column to vary, resulted in plasma components of =1.8106 K and =5.6107 K with 5.151021 cm-2. This last model was attempted because the absence of diffuse X-ray emission towards the southeast of the main bubble could be due to higher absorption column densities.
Models E and F appear to indicate that the plasma in NGC 2359 has higher temperatures than those reported for S 308 and NGC 6888, but in accordance with those WR bubbles, the flux ratio () show that the secondary component represents 10% of the observed emission in NGC 2359. The total observed flux in the 0.3–2.0 keV energy range of Model E is =6.410-14 erg cm-2 s-1 which corresponds to an unabsorbed flux of =1.110-12 erg cm-2 s-1. The estimated observed flux from Model F is the same but due to its higher absorption column density, its unabsorbed flux is =1.310-12 erg cm-2 s-1. The estimated luminosities for these flux values at a distance of 3.67 kpc (van der Hucht, 2001) are =1.81033 erg s-1 and =2.01033 erg s-1. Finally, using the normalization parameters of best-fit models we can estimate the electron density of the X-ray-emitting gas in NGC 2359 assuming a spherical morphology with a radius 2.2′. This sets an upper value to the electron density as cm-3.
As in other wind-blown bubbles (e.g., planetary nebulae and H ii regions), the hot bubble in NGC 2359 can be expected to have a temperature 107 K as calculated for an adiabatically shocked gas (e.g., Dyson & Williams, 1997) for a stellar wind velocity of 1600 km s-1 (van der Hucht, 2001). The gas inside the hot bubble is very tenuous (=10-3–10-2 cm-3), thus it would produce low-luminosity, hard X-rays non detectable by the current X-ray satellites. Weaver et al. (1977) proposed that for the case of interstellar bubbles, thermal conduction at the interface between the hot bubble and the outer ionized nebula could diminish the temperature of the hot bubble while raising its density. This model, however, fails in explaining the low X-ray luminosities reported by observations of diffuse X-ray-emitting gas in planetary nebulae, WR bubbles, and superbubbles around young star clusters (e.g., Townsley et al., 2003; Toalá et al., 2012; Ruiz et al., 2013, and references therein). Thus, none of these two models are applicable to the diffuse X-ray emission in wind-blown bubbles. The fragmentation of the ionized shell due to instabilities and the effects of the ionization flux from the central star needs to be incorporated in the models. The clumps formed by instabilities in the wind-wind interaction are an important source of mass, injecting material into the hot bubble via hydrodynamic ablation and photoevaporation. Two-dimension numerical simulations taking into account the time evolution of the stellar wind parameters and ionization photon flux are able to give a reasonable description of both the plasma temperatures and luminosities in WR nebulae (Toalá & Arthur, 2011; Dwarkadas & Rosenberg, 2013). Thus, the estimated plasma temperature, electron density, luminosity, and nebular abundances of the diffuse X-ray emission in NGC 2359 indicate that the density in the hot bubble has been raised by mixing of material from the outer nebula as in S 308 and NGC 6888.
6 Conclusions
We have presented our analysis of archival XMM-Newton observations of NGC 2359. We find significant differences between our analysis and that presented in Z14. Our findings can be summarized as:
-
•
There is an additional spatial component to the diffuse X-ray emission towards the northeast from the main bubble in NGC 2359 identified as a blister in optical images.
-
•
We identify 16 point-like sources projected in the line of sight of the WR nebula, including WR 7. We have excised all of these sources for a cleaner spectral analysis.
-
•
Our background selection in the spectral analysis does not contain any contribution of the diffuse X-ray emission from a blowout nor point-like sources, allowing us to perform a more accurate spectral analysis in the 0.3-2.0 keV energy range.
-
•
We model the diffuse X-ray emission with a two-temperature plasma model for abundances of the optical WR nebula without magnesium enhancement. This model resulted in plasma temperatures of =2106 K and =5.7107 K. The second temperature component contributes less than 10% of the total flux in the 0.3–2.0 keV energy range, similar to other WR bubbles.
-
•
The estimated unabsorbed flux and X-ray luminosity of NGC 2359 are =1.310-12 erg cm-2 s-1 and =21033 erg s-1, respectively.
-
•
The estimated electron density, 0.6 cm-3, and the fact that the X-ray emission can be modeled with the abundances as those as the optical nebula imply that the hot bubble in NGC 2359 has raised its density as a result of strong mixing from the outer material.
Acknowledgments
The authors would like to thank Steve Mazlin, Jack Harvey, Daniel Verschatse, and Rick Gilbert from SSRO-South and PROMPT/CTIO for providing the optical images of NGC 2359. J.A.T. acknowledges support by the CSIC JAE-Pre student grant 2011-00189. J.A.T. and M.A.G. are supported by the Spanish MICINN grant AYA 2011-29754-C03-02 co-funded with FEDER funds.
References
- Anders & Grevesse (1989) Anders, E., & Grevesse, N. 1989, GeCoA, 53, 197
- Arnaud (1996) Arnaud, K. A. 1996, Astronomical Data Analysis Software and Systems V, 101, 17
- Arthur (2007) Arthur, S. J. 2007, Diffuse Matter from Star Forming Regions to Active Galaxies, 183
- Cappa et al. (2001) Cappa, C. E., Rubio, M., & Goss, W. M. 2001, AJ, 121, 2664
- Chu et al. (2003) Chu, Y.-H., Guerrero, M. A., Gruendl, R. A., García-Segura, G., & Wendker, H. J. 2003, ApJ, 599, 1189
- Dyson & Williams (1997) Dyson, J. E., & Williams, D. A. 1997, The physics of the interstellar medium. Edition: 2nd ed. Publisher: Bristol: Institute of Physics Publishing, 1997. Edited by J. E. Dyson and D. A. Williams. Series: The graduate series in astronomy. ISBN: 0750303069
- Dwarkadas & Rosenberg (2013) Dwarkadas, V. V., & Rosenberg, D. L. 2013, High Energy Density Physics, 9, 226
- Esteban et al. (1993) Esteban, C., Smith, L. J., Vilchez, J. M., & Clegg, R. E. S. 1993, A&A, 272, 299
- Fruscione et al. (2006) Fruscione, A., et al. 2006, Proc. SPIE, 6270
- Gosset et al. (2005) Gosset, E., Nazé, Y., Claeskens, J.-F., et al. 2005, A&A, 429, 685
- Güdel et al. (2008) Güdel, M., Briggs, K. R., Montmerle, T., et al. 2008, Science, 319, 309
- Pittard (2007) Pittard, J. M. 2007, Diffuse Matter from Star Forming Regions to Active Galaxies, 245
- Rizzo et al. (2001) Rizzo, J. R., Martín-Pintado, J., & Henkel, C. 2001, ApJL, 553, L181
- Rizzo et al. (2003) Rizzo, J. R., Martín-Pintado, J., & Desmurs, J.-F. 2003, A&A, 411, 465
- Ruiz et al. (2013) Ruiz, N., Chu, Y.-H., Gruendl, R. A., et al. 2013, ApJ, 767, 35
- St-Louis et al. (1998) St-Louis, N., Doyon, R., Chagnon, F., & Nadeau, D. 1998, AJ, 115, 2475
- Toalá & Arthur (2011) Toalá, J. A., & Arthur, S. J. 2011, ApJ, 737, 100
- Toalá & Guerrero (2013) Toalá, J. A., & Guerrero, M. A. 2013, A&A, 559, A52
- Toalá et al. (2012) Toalá, J. A., Guerrero, M. A., Chu, Y.-H., et al. 2012, ApJ, 755, 77
- Toalá et al. (2014) Toalá, J. A., Guerrero, M. A., Gruendl, R. A., & Chu, Y.-H. 2014, AJ, 147, 30
- Townsley et al. (2003) Townsley, L. K., Feigelson, E. D., Montmerle, T., et al. 2003, ApJ, 593, 874
- van der Hucht (2001) van der Hucht, K. A. 2001, New Astron. Rev., 45, 135
- Weaver et al. (1977) Weaver, R., McCray, R., Castor, J., Shapiro, P., & Moore, R. 1977, ApJ, 218, 377
- Zhekov (2014) Zhekov, S. A. 2014, MNRAS, 443, 12
- Zhekov & Park (2011) Zhekov, S. A., & Park, S. 2011, ApJ, 728, 135