Lattice dynamics of the heavy fermion compound URu2Si2
Abstract
We report a comprehensive investigation of the lattice dynamics of URu2Si2 as a function of temperature using Raman scattering, optical conductivity and inelastic neutron scattering measurements as well as theoretical ab initio calculations. The main effects on the optical phonon modes are related to Kondo physics. The B1g ( symmetry) phonon mode slightly softens below 100 K, in connection with the previously reported softening of the elastic constant, , of the same symmetry, both observations suggesting a B1g symmetry-breaking instability in the Kondo regime. Through optical conductivity, we detect clear signatures of strong electron-phonon coupling, with temperature dependent spectral weight and Fano line shape of some phonon modes. Surprisingly, the line shapes of two phonon modes, Eu(1) and A2u(2), show opposite temperature dependencies. The A2u(2) mode loses its Fano shape below 150 K, whereas the Eu(1) mode acquires it below 100 K, in the Kondo cross-over regime. This may point out to momentum-dependent Kondo physics. By inelastic neutron scattering measurements, we have drawn the full dispersion of the phonon modes between 300 K and 2 K. No remarkable temperature dependence has been obtained including through the hidden order transition. Ab initio calculations with the spin-orbit coupling are in good agreement with the data except for a few low energy branches with propagation in the (a,b) plane.
I Introduction
After almost three decades Palstra et al. (1985) of intensive experimental and theoretical research, the nature of the ordered phase found in the Kondo system URu2Si2 at temperature below T0=17.5 K remains to be unraveled Mydosh and Oppeneer (2011, 2014). Whereas appearing clearly in the thermodynamic and transport quantities Palstra et al. (1985); Schlabitz et al. (1986); de Visser et al. (1986), the order parameter of this electronic hidden order (HO) state could not be determined by any usual or sophisticated experimental techniquesBroholm et al. (1991). Theoretical proposals are numerous, starting from itinerant or localized picture for the 5f electrons Kusunose and Harima (2011); Haule and Kotliar (2009); Ikeda et al. (2012); Rau and Kee (2012); Fujimoto (2011); Riseborough et al. (2012); Das (2014); Pépin et al. (2011); Chandra et al. (2013); Elgazzar et al. (2009).
Particular features of the HO state have been determined. Inelastic neutron measurements Broholm et al. (1991); Bourdarot et al. (2010); Wiebe et al. (2007) observe two magnetic excitations with a commensurate wave vector Q0=(1,0,0) and an incommensurate wave vector Q1=(1.4,0,0)(0.6,0,0), the first one being a fingerprint of the HO state Villaume et al. (2008). A partial Fermi-surface gapping with a strong reduction of the carriers number occurs at T0 Bonn et al. (1988); Schoenes et al. (1987). At higher temperature, a heavy-electron Kondo liquid regime emerges below 100 KPalstra et al. (1985, 1986); Aynajian et al. (2010). This cross-over temperature, observed in resistivity for instance, has been shown to be drastically reduced under high magnetic field Scheerer et al. (2012) until the HO state vanishes at 35 T, suggesting that the Kondo liquid regime is a precursor of the HO state. It is well admitted that a Brillouin zone folding from a body center tetragonal (bct) to a simple tetragonal (st) phase occurs upon entering the HO state Hassinger et al. (2010); Elgazzar et al. (2009); Buhot et al. (2014). Recently, various experiments have identified a four-fold symmetry breaking upon entering the HO state Okazaki et al. (2011); Tonegawa et al. (2012) and orthorhombic static lattice distortion has been reported by Tonegawa et al. Tonegawa et al. (2014).
The physics of URu2Si2 being mainly electronic, the lattice properties have been hardly investigated. Raman scattering Cooper et al. (1986) mainly reported temperature dependence of the intensity of the fully-symmetric phonon mode and optical conductivity studies were mostly focused on the electronic properties. A more detailed study by ultrasonic measurements versus temperature and under high magnetic field Yanagisawa et al. (2013); Kuwahara et al. (1997) reported a softening of the elastic constant below 120 K suggesting a B1g-type (or ) lattice instability in connection with the Kondo cross-over. Quite recently, an anomalous phonon softening below in the [1,1,0] direction has been reported by inelastic neutron scattering Butch et al. (2012), calling on for further detailed studies.
We report here a comprehensive study of the lattice dynamics of URu2Si2 from 300 K to 2 K; the optical phonon modes have been investigated by Raman scattering (section III) and infrared (IR) (section IV) spectroscopies, the dispersion of the phonon branches by inelastic neutron scattering (including polarization techniques) (section V), and ab initio calculations (section VI) were used for comparison with all measurements.
II Phonon modes in URu2Si2 and selection rules
| Modes | Irreductible representation | Corresponding symmetry | Phonon | Atom displacements |
| activity | in Mulliken’s notation | in Bethe’s notation (function) | Multiplicity | (direction) |
| Raman active | A1g | 1 | Si (c-axis) | |
| A2g | 0 | No active phonon | ||
| B1g | 1 | Ru (c-axis) | ||
| B2g | 0 | No active phonon | ||
| Eg | 2 | Si+Ru (ab-plane) | ||
| IR active | A2u | 2 | U+Ru+Si (c-axis) | |
| Eu | 2 | U+Ru+Si (ab-plane) |
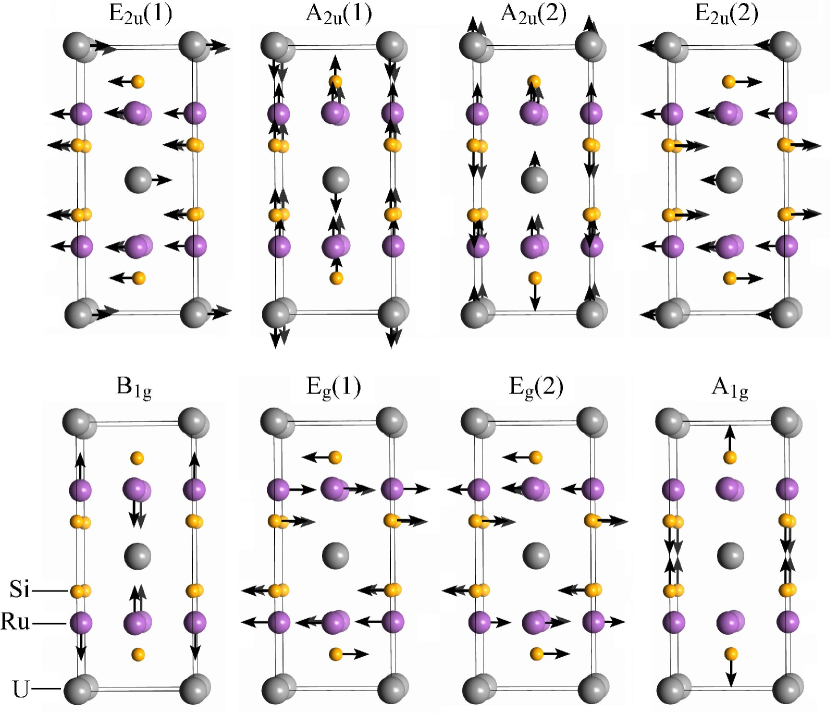
The URu2Si2 compound belongs to the tetragonal space group I4/mmm (D4h), with the U, Ru and Si atoms located at the 2a, 4d and 4e Wyckoff positions, respectively. From group symmetry analysisHayes and Loudon (2004), 8 zone center optical phonons are expected, A1g, B1g, 2Eg, 2A2u and 2Eu. Table 1 reports all these phonon modes, their multiplicity and the motion of the atoms involved. Due to inversion center in URu2Si2 elementary cell, the gerade (g) mode are Raman active and the ungerade (u) ones are IR actives. The corresponding atomic displacement patterns are sketched in Figure 1. A1g and B1g modes involve motions of the Si and Ru atoms, respectively, along the c-axis. The Eg modes correspond to the motions of Si and Ru atoms in the ab-plane. The IR active modes involve motions of all atoms along the c-axis for the A2u modes and in the ab-plane for the Eu modes.
In optical measurements, all the symmetries have been probed by combining different orientations of the samples and/or different incident () and scattered () light polarizations. Both Raman and IR scattering probes excitation with a transfered wave vector close to zero. To obtain the full dispersion of the optic and acoustic phonon branches we have carried out inelastic neutron scattering (INS). Here the transverse or longitudinal character of the phonon modes has been obtained by using different configurations of scattering vector as well as by comparison with the theoretical prediction for each branch.
III Raman spectroscopy of the phonons
III.1 Methods
Polarized Raman scattering has been performed in quasi-backscattering geometry with a incident laser line at 532 nm from a solid state laser. We have used a closed-cycle 4He cryostat with sample in high vacuum (10-6 mbar) for the measurements from 8 K to 300 K and a 4He pumped cryostat with the sample in exchange gas for measurements below 8 K or under magnetic field up to 10 T. By comparing Stokes and anti-Stokes Raman spectra and via the evolution of phonon frequencies with incident laser power, we have estimated the laser heating of the samples at +1.3 K/mW and +1 K/mW for the samples in high vacuum and in exchange gas, respectively. Typical laser power of 5 mW was used. The scattered light was analyzed by a Jobin Yvon T64000 triple substractive grating spectrometer equipped with a cooled CCD detector. In the triple substractive configuration we used, the resolution of the spectrometer is 2.5 cm-1. For large energy scale measurements (up to 3000 cm-1), the spectrometer was used in the simple grating configuration, with a lower resolution. The contribution of the Bose factor has been removed for all spectra.
III.2 Sample preparation
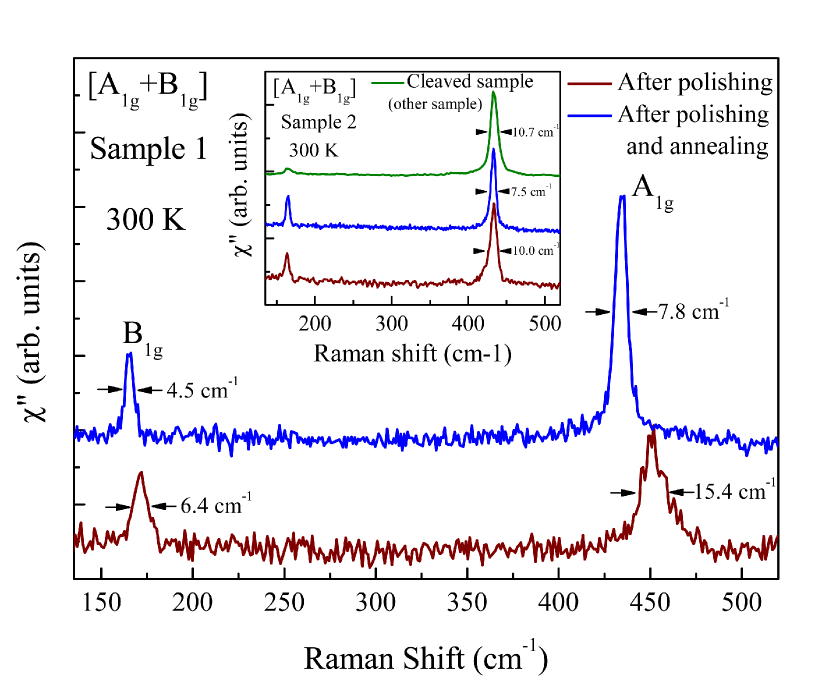
The URu2Si2 single crystals were grown by the Czochralski method using a tetra-arc furnace Aoki et al. (2010). Two samples, from the same batch, were prepared. The initial residual resistivity ratio of the samples is about 50. Samples 1 and 2 were polished along the (a,c) and (a,a) planes, respectively. By cleaving, we obtained samples along the (a,a) plane. The Eg phonon modes can be probed only in (a,c) plane (//(a,c)), so only on polished sample. Figure 2 shows the A1g and B1g phonon modes after polishing then after annealing, for sample 1 and for sample 2 (see inset). After polishing along the (a,c) plane (sample 1), both phonon modes are shifted by about 4% to higher energy and broadened. Most probably, the stress induced by polishing gives rise to such hardening and to the shortening of their lifetime. However, no such stress effect have been observed on the sample polishing along (a,a) plane (see inset of Figure 2). In order to release the stress induced by polishing, both samples have been annealed for two days at 950 ∘under ultra high vacuum. This process has shifted down the phonon modes and it has clearly sharpened them. The final position and width are similar to what is measured on the cleaved sample of the same batchBuhot et al. (2013) (see inset of Fig.2) (Note that even sharper A1g phonon mode with a full width at half maximum (FWHM) at 4 K of 4have been measured on cleaved samples from another batch). The Eg modes measured on final sample 1 are very sharp, comparable to the resolution of the spectrometer at low temperature.
III.3 Anharmonic model
The temperature dependence of the FWHM, , and energy, , of the phonon mode is usually described by a simple symmetric anharmonic decay model, i.e. decay of an optical phonon into two acoustic modes with identical frequencies and opposite momentaKlemens (1966); Menéndez and Cardona (1984) :
| (1) |
| (2) |
where and are positive constants, is the bare phonon frequency, and a residual (temperature independent) linewidth originating from sample imperfections. With this purely phononic effect, upon cooling down, the energy and the width of the phonon mode hardens and decreases, respectively, before saturating.
In addition, electron-phonon coupling can also induce renormalization of the frequency and width as well as a change of the shape of the phonon mode. In a simple model Fano (1961); Cardona (1982), the width change is directly related to the electronic density at the energy of the phonon mode and the frequency relies on the full electronic spectrum. Generally, a loss of electronic density of states produces a narrowing of the phonon mode. Such coupling can also induce an asymmetric Fano shape of the phonon. If this last effect remains negligible, the line shape of the phonon can be described by a Lorentzian profile, i.e. :
III.4 Results
Figure 3 shows typical Raman spectra obtained at 4 K on sample 1 after polishing and annealing. A1g and B1g phonon modes are visible in parallel polarization and Eg modes in cross-polarization. We observe a leakage of the A1g mode in cross-polarization due to a weak crystal misalignment. At 300 K, the two Eg modes are seen at 213 and 391 cm-1, and A1g and B1g at respectively, 434 and 163 cm-1. The B1g and both Eg phonon modes are sharper (with a FWHM of 3.2 cm-1, 2.8 cm-1 and 1.8 cm-1 at 4K, respectively) than the A1g phonon mode (FWHM=6.6 cm-1 at 4K). All phonons have a Lorentzian line shape.
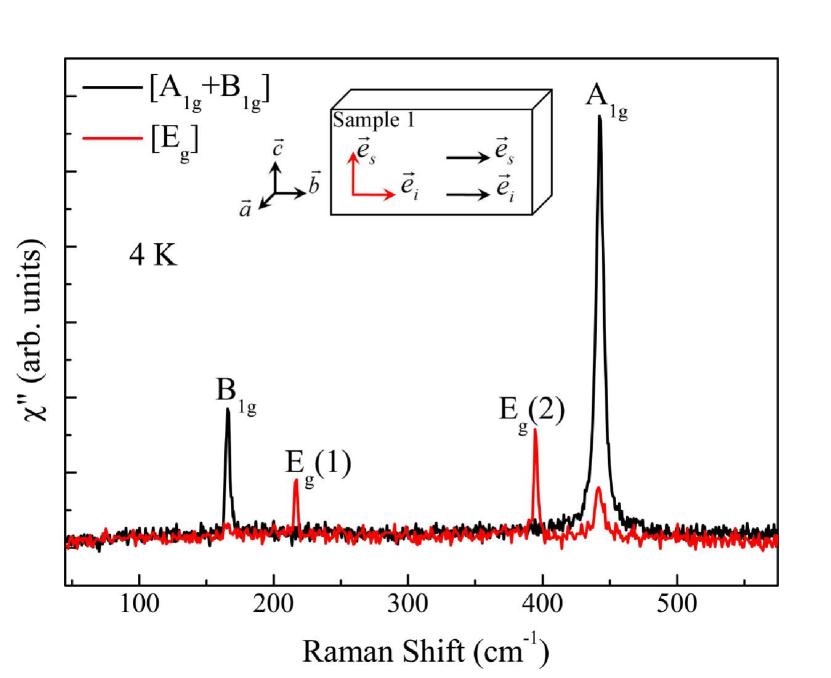
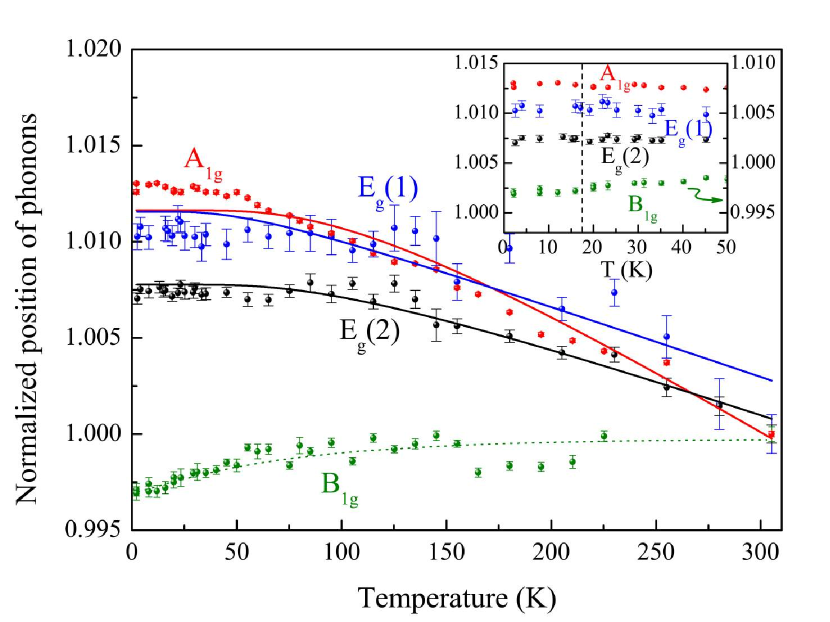
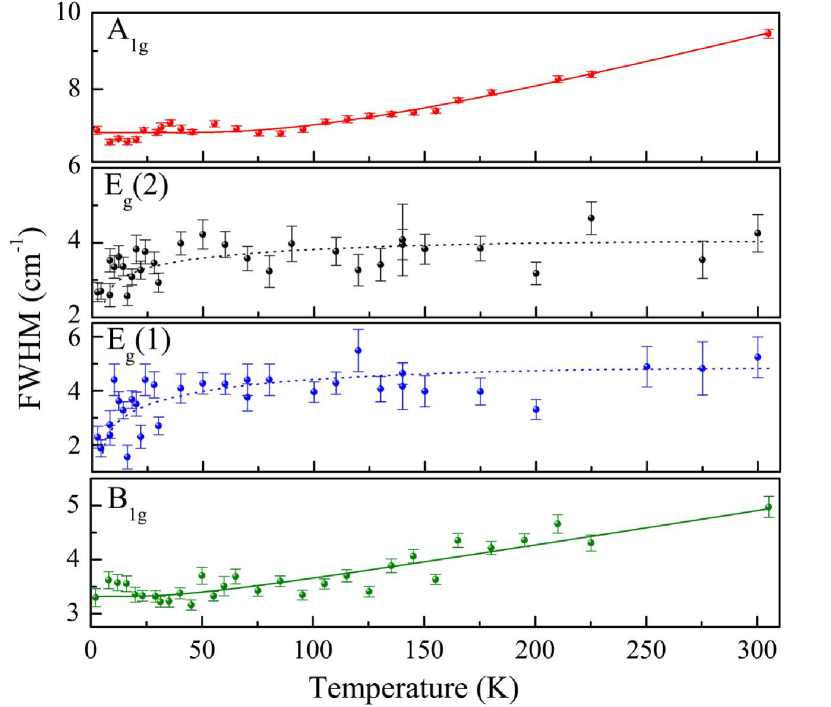
Figure 4 and 5 present the temperature dependence of the energies and FWHM of the Raman-active phonon modes. The energies are normalized to their value at 300 K. We have investigated precisely the energy of the phonons through the hidden order transition but no particular effect has been observed within our accuracy (see inset of Figure 4). The energy of the A1g mode increases with decreasing temperature before saturating at 1.25 higher energy than at 300 K. It narrows upon cooling before saturating. The general temperature dependence of this mode is naturally explained by anharmonic effects (full line are fits with the anharmonic model described in section III.3). Other ingredients, like anharmonic effect of higher rank (four-phonon process), would be necessary to accurately fit the data.
The temperature dependence of the A1g mode energy is consistent with previous Raman experiments Cooper et al. (1987). No particular change of the integrated intensity of the A1g phonon mode has been detected contrary to what Cooper et al. have reportedCooper et al. (1987). Nor do we see any abrupt increase of the linewidth of A1g below 20 K contrary to what is reported by Lampakis et al. Lampakis et al. (2006).
Whereas both Eg modes exhibit usual increasing energy when cooling down, their FWHM are almost constant in all the temperature range with a slight sharpening below K. Within our accuracy, the increase of the lifetime of these phonons might be concomitant with the electronic gap opening at T0 observed by optical conductivity Bonn et al. (1988); Nagel et al. (2012); Guo et al. (2012); Levallois et al. (2011) and Raman scattering Buhot et al. (2014). If so, a simple electron-phonon coupling model Fano (1961); Cardona (1982) would qualitatively explain such behavior.
Intriguingly, whereas the FWHM of the B1g phonon shows the usual temperature evolution with narrowing when temperature decreases, its energy remains constant down to about 100 K before softening by about 0.5 below. This softening occurs in the temperature range of the Kondo cross-over and upon entering the Kondo liquid regime below the Kondo temperature reported between 70 KPalstra et al. (1985, 1986) and 120 K Aynajian et al. (2010). Clearly, the temperature dependence of the energy of the B1g phonon cannot be reproduced by the simple anharmonic model. Moreover, contrary to what we observe, a simple electron-phonon coupling model generally predicts a change of the width as an initial effect on top of which the energy of phonon can be modified. We will further discuss this B1g-symmetry softening in section III.5.
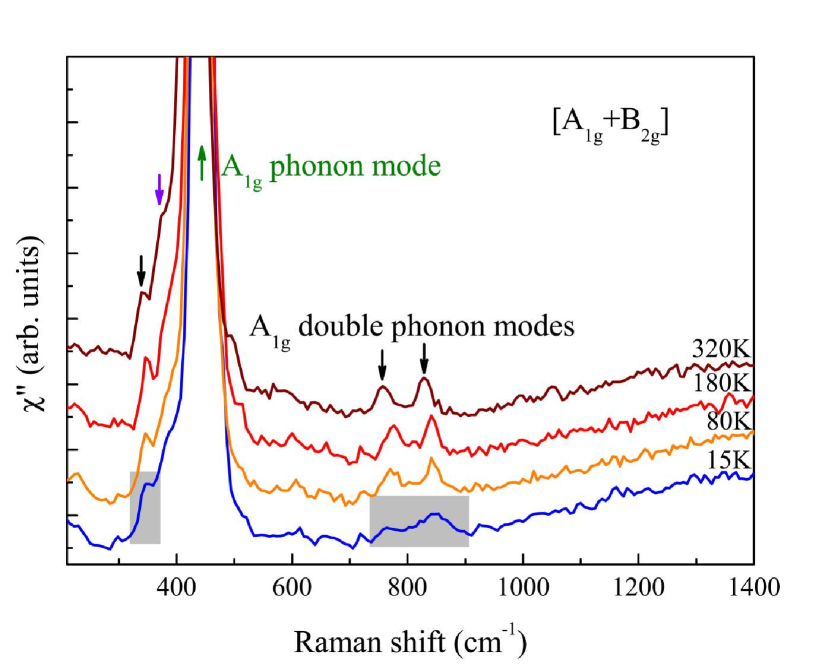
A large energy scale investigation in all symmetries reveals three new peaks in A1g symmetry, as shown Figure 6. In A1g + B2g symmetry three broad peaks appear at 350, 760 and 832 cm-1 with a linewidth of 21, 37 and 37 cm-1, respectively. A slight hardening is observed with decreasing temperature. These new excitations are of pure A1g symmetry as they are not observed in the B1g + B2g symmetry (not shown). These broad features could be due to crystal electric field excitations or double phonon processes. Because of a good agreement with theoretical calculation (see section VI), we attributed them to this last process. Indeed as shown in Figure 6 and 14, the energy ranges of the peaks (grey areas) are consistent with double excitations, either pure or mixed, of the B1g, Eg or A1g branches.
Finally, we have probed all phononic excitations under high magnetic field up to 10 T (not shown). No effect has been observed.
III.5 Discussion
Our most noticeable result of the Raman scattering investigation is the unusual temperature dependence of the energy of the B1g phonon mode with softening below the Kondo temperature. The B1g mode breaks the four-fold rotational symmetry. So the behavior of this B1g phonon suggests a tendency toward lattice instability with orthorhombic distortion. Four-fold symmetry breaking and even orthorhombic distortion upon entering the HO state have been reported by various experiments Okazaki et al. (2011); Tonegawa et al. (2012, 2014). However, the symmetry broken here is B2g, i.e. 45∘ from the B1g symmetry, both being in the (a,b) plane. Moreover, the temperature ranges are claimed to be different. Clearly, there is no direct relationship between these measurements and our Raman scattering result. The tendency toward lattice instability with B1g symmetry is most probably related with the Kondo physics. Interestingly, similar softening effect (of 0.7%) of the elastic constant in the same symmetry (B) has been reported below 120 K by ultrasound velocity measurementsYanagisawa et al. (2013). In addition, they show that this effect disappears when high magnetic field of 35 T is applied along the c axis. At this magnetic field, the coherence temperatures are strongly reduced concomitantly with the vanishing of the hidden order phaseScheerer et al. (2012). The softening of the elastic constant has been related to the emergence of the hybridized electronic state between the 5f electron and the conduction electrons (s or d) and associated to a symmetry-breaking band instability. Both results, on acoustic (ultrasound experiment) and optical phonon (Raman experiment) modes, are nicely consistent and point to a B1g symmetry-breaking instability upon entering into the Kondo regime of URu2Si2. While the acoustic phonon modes involve the motion of all atoms, the B1g mode involves only the Ru atoms. This may suggest that the electronic environment of the Ru atoms are particularly affected by the Kondo physics.
On the basis of our inelastic neutron scattering study and theoretical calculations, we conclude that two origins for this small B1g lattice instability are unlikely. First, our theoretical calculations including global anharmonic effects from purely phononic origin (See Section VI and Figure 15) indicates that none of the phonon branches, except the A2u one, are strongly affected by these anharmonic effects. Secondly, by following the full dispersion of the "B1g" branch as well as magnetic excitations by inelastic neutron scattering (See V) we show that the k-dependence of the phonon is smooth going through the minima in the magnetic dispersion ( and ). This does not give any indication of magneto-elastic coupling. Finally, as the B1g mode is not affected by the large loss of carriers upon entering the HO state, as the phenomenon which induces the unusual B1g energy behavior does not involve any noticeable change of its FWHM, a complex electron-phonon coupling related to the Kondo physics is certainly in play for this B1g mode.
IV Optical conductivity of phonons
IV.1 Methods
Unpolarized optical reflectivity was measured on a cleaved (a,a) plane. The c-axis reflectivity was taken with appropriate polarizers on sample 1 (see section III), an optically polished (a,c) surface. We checked that the data along the a direction at 5 K was identical for unpolarized measurements on the (a,a) plane and a-polarized measurements on the (a,c) surface. Spectra were recorded at several temperatures from 5 K to 300 K, between 20 (2.5 meV) and (1.5 eV). This data was extended to (5 eV) at room temperature. To obtain the absolute reflectivity we utilized an in-situ overfilling (gold or aluminum) evaporation technique.Homes et al. (1993) In order to obtain the optical conductivity from Kramers-Kronig, we took a Hagen-Rubens extrapolation below our lowest measured frequency. Above , we utilized the data by Degiorgi et al.Degiorgi et al. (1997) up to (12 eV), followed by a free electron termination.
IV.2 Data modeling
In this paper, we are interested in the real part of the optical conductivity (), which is built upon the sum of the contributions from individual excitations:
| (3) |
where the superscripts , and stand for contributions from coherent mobile charge carriers, interband transitions, and phonons, respectively.
We describe the coherent part by a Drude conductivity in the form
| (4) |
where is a plasma frequency, the scattering rate, and the vacuum impedance. Both, interband and phonon contributions can be modeled by Lorentz oscillators
| (5) |
where each contribution has a resonance frequency , a linewidth , and a dielectric oscillator strength .
The Lorentz model does not take into account coupling between localized (e.g. phonon) states and the continuum. FanoFano (1961) described phonon lineshapes in a conducting medium, when an electron-phonon coupling exists. Here we adopt the formalism proposed by Davis and FeldkampDavis and Feldkamp (1977), who generalized Fano’s approach to multiple discrete states:
| (6) |
where two new quantities are introduced. is a renormalization parameter that takes into account the transition rate between continuum and localized states. But more interesting is the Fano-Breit-Wigner , which vanishes when the electron-phonon interaction disappears. It probes the continuum density of states at the phonon frequency.
IV.3 Results & Discussion
Figure 7 shows the optical conductivity around each phonon for both polarizations. We do observe all predicted modes by group theory: 2 Eu phonons in the (a,a) plane [panels (a) and (b)] and 2 A2u modes along the c-direction [panels (c) and (d)]. This is the first observation of the very weak A2u phonon at 115, which we could only detect at low temperatures. Above K, this phonon becomes too broad to be resolved in the spectra.
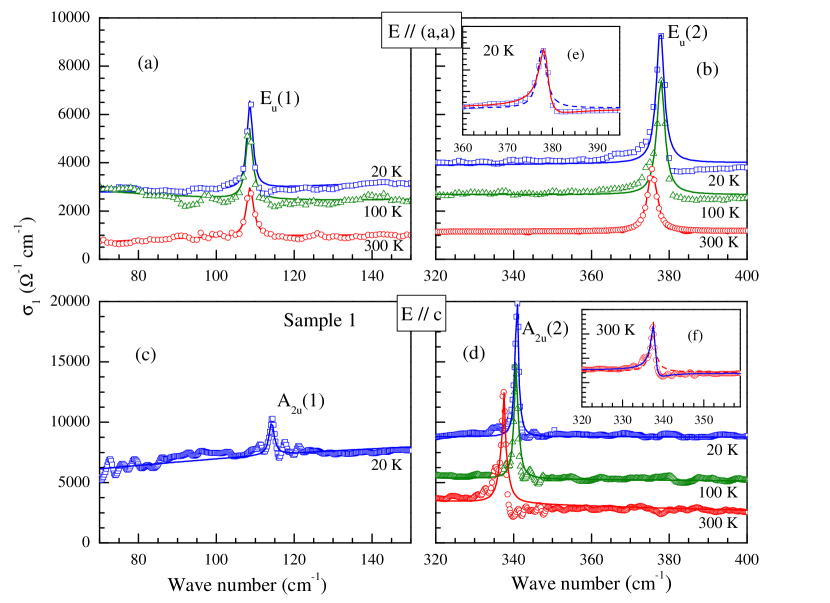
In panels (a) through (d) the symbols are the data and the solid lines are fits utilizing a Drude-Lorentz approach (Eqs. 4 and 5). To describe the continuum, we fitted the data to one Drude peak and two broad Lorentz oscillators. This is a convenient way to parametrize the continuum but the values of the parameters do not carry a particular physical meaning and will not be discussed here. On top of this continuum we added a Lorentz oscillator for each phonon. One can see that the Lorentz oscillator describes reasonably well the phonon responses although the line shape is not perfect at a few temperatures, such as 20 K in panel (b) and 300 K in panel (d) (Fano line shape will be discussed later). Nevertheless, the Lorentz oscillator is very useful in analyzing the phonon spectral weight.
The spectral weight, characterizing the charge in a restricted spectral range, is defined as:
| (7) |
When and , one recovers the -sum rule ( is the total number of electrons, is the electronic charge, and the bare electronic mass). This rule states that the total integral under the real part of the optical conductivity is a constant independent of external parameters such as the temperature or pressure.
The spectral weight for a phonon within the Lorentz framework is:
| (8) |
If phonons were decoupled from each other and from other excitations (e.g. electronic continuum), Eq. 8 should be temperature independent for each phonon.
Figure 8 shows the temperature dependence of the spectral weight of each phonon from Eq. 8, normalized by the total spectral weight for its respective polarization at room temperature, integrated up to . Data for the lowest frequency A2u is shown for completeness, but we do not have enough temperatures to draw any conclusion about this phonon.
The spectral weight of both Eu phonons almost doubles upon cooling the sample from room temperature to 5 K. The highest energy A2u phonon also shows a temperature dependent spectral weight, albeit of smaller magnitude. Interestingly, for this phonon, the spectral weight decreases with decreasing temperature.
A temperature dependent spectral weight indicates that the effective charge of the phonons change with temperature. As the sum rule states that the total spectral weight must be conserved, this charge must be transfered from or to some other excitation. Because the spectral weight of the phonons correspond to less than 1% of the total spectral weight, we do not have enough resolution to pinpoint the energy (and hence the excitation) from which this charge is being transfered. However, the obvious candidate is the electronic continuum.
Indeed, let us go back to Fig. 7 and make a closer inspection on the phonon line shapes. In panel (e), we show the data for the highest E2u phonon fitted by a Lorentz oscillator (dashed line) or a Fano mode (solid line) at 20 K. Only the latter properly describes the asymmetry observed in the measured data. This is the hallmark of an electron-phonon coupling and substantiates our claim that the phonon charge is changing due to a spectral weight transfer with the electronic continuum. Panel (f) shows that the same effect is present in the highest energy A2u mode at 300 K.
Using the Fano mode fitting, we first extract the temperature dependence of the phonons energy normalized to their value at 300 K as presented Figure 9. At 300 K, the two Eu phonon modes are seen at 108.7 and 375.6 cm-1, and the highest A2u phonon mode at 337.8 cm-1. Whereas the Eu(2) and A2u(2) phonon modes exhibit the expected hardening when cooling down, the Eu(1) phonon mode shows constant energy down to 20K and a small hardening of 0.2 % upon entering the HO phase. Even if only this low energy phonon Eu(1) has a singular temperature dependence, the Eu(2) and A2u(2) phonon modes exhibit Fano line shape with peculiar temperature dependence, again evidencing that a complex electron-phonon coupling is in play in URu2Si2.
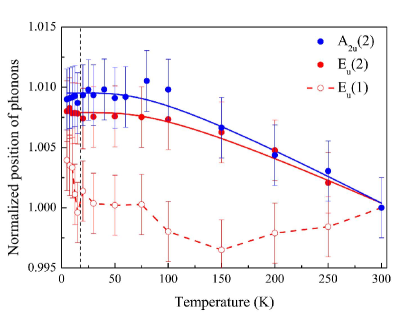
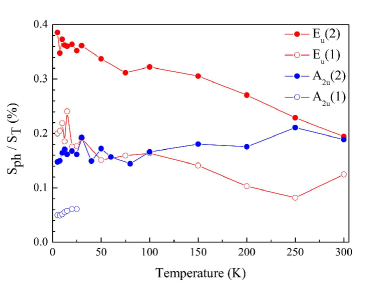
Fig. 10 shows the temperature behavior for the Fano-Wigner-Breit parameter for both Eu ((1) at 108 and (2) at 378) and the highest energy A (at 340) phonons. The parameter for mode E shows a behavior similar to its effective charge. Both quantities increase almost featurelessly with decreasing temperature. This joint behavior corroborates the electron-phonon coupling for this mode. Whereas we observe a clear drop in at the hidden order transition for the mode Eu, a drop which is directly related to the loss of carriers number at T0, we cannot pinpoint a particular change of coupling in the paramagnetic state.
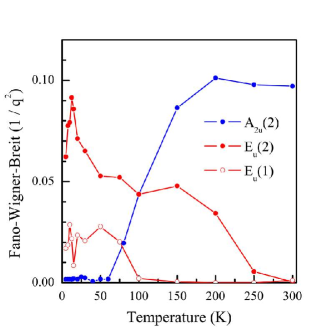
The phonons E and A, on the other hand, show a striking change of regime close to the Kondo transition where coherent transport develops. E has a very small, yet finite, at high temperatures. Close to the Kondo temperature it suddenly increases and the phonon develops an asymmetric shape. The opposite is observed for phonon A, which has an asymmetric shape and a large value above the Kondo temperature.
The temperature dependence of probes the variation of the continuum density of states close to the phonon energy. A decrease in indicates then that the density of states close to the phonon energy becomes smaller, i.e., gapped. The optical conductivity results on the A2u mode indicate that we would have a gapped system along around 40 meV in the Kondo regime. Phonon E, conversely, may indicate that the system is gapped or with strongly depleted density of states on the plane at about 12 meV but this gap closes below the Kondo temperature or more generally the electronic density of state is enhanced when entering into the Kondo liquid regime.
Such observation of a temperature dependent Fano shape of a phonon mode in metallic Kondo systems has already been reported in CeCoIn5 by Raman scatteringMartinho et al. (2007). Indeed, according to their study of the lattice dynamics and electronic Raman response of CeCoIn5, the entrance into the Kondo liquid regime below the crossover temperature T* 45 K manifests by the divergence of the Fano coefficient of the A1g phonon and by the significant drop of the scattering rate of the electronic scattering background. Both have been related to the enhancement of the electronic density of states due to the hybridization of 4f electrons with the conduction band. However the behavior as measured on the A mode in URu2Si2 and even more the concomitant opposite behaviors of two phonons A and E within the same compounds is striking and has never been reported to our knowledge. Most probably, this points to strongly momentum-dependent Kondo physics in URu2Si2, which affect distinctively both phonon modes with movements into different and perpendicular planes, namely the (x,y) and (z) planes.
V Phonons and magnetic excitations studies by inelastic neutron scattering
V.1 Experimental Details
The phonon spectrum of URu2Si2 was investigated by Inelastic Neutron Scattering (INS) at the Institute Laue-Langevin. The first experiment was performed on the thermal neutron three axis spectrometer IN8. In the first configuration, the initial beam is provided by a double focusing Si monochromator (Si(1,1,1)) and the scattered beam is analyzed by a double focusing Pyrolytic Graphite (PG) analyzer (PG(0,0,2)) with fixed = 2.662 Å-1. In the second configuration, the initial beam is provided by a double focusing Cu monochromator (Cu(2,0,0)) and the scattered beam is analyzed as previously but with fixed = 4.1 Å-1. This second configuration is used to investigate high energy modes. The second experiment was performed on the thermal neutron three axis spectrometer IN22 where the initial beam is provided by a double focusing PG monochromator (PG(0,0,2)) and the scattered beam is analyzed by a double focusing PG analyzer (PG(0,0,2)) with fixed = 2.662 Å-1. For these two experiments, the sample is a cylinder of diameter 4.5 mm and of length 8 mm along the -axis; the scattering plane is defined by (1,0,0) and (0,0,1). The third experiment was performed on IN22 in polarized neutron setup with Heussler monochromator and analyzer with fixed = 2.662 Å-1. The neutron polarization is kept along the neutron path by guide fields and by an Helmholtz coil around the sample ; a Mezei flipper is placed before the analyzer. The experiment was performed with the neutron polarization parallel to the scattering vector ( // ). With this configuration, all the magnetic scattering appears in the Spin Flip (SF) channel while the phonon scattering appears in the Non Spin Flip (NSF) channel. For this experiment, the sample is a cylinder of diameter 4.5 mm and of length 12 mm along the -axis and the scattering plane is defined by (1,0,0) and (0,1,0). In all measurements, the sample was inside an helium-4 flow cryostat covering the range 2-300 K. A PG filter was always placed in the scattered beam in order to remove higher order contamination. (Note for comparison between Raman, IR and neutron scattering that 1 meV=8.06 cm-1).
V.2 RESULTS
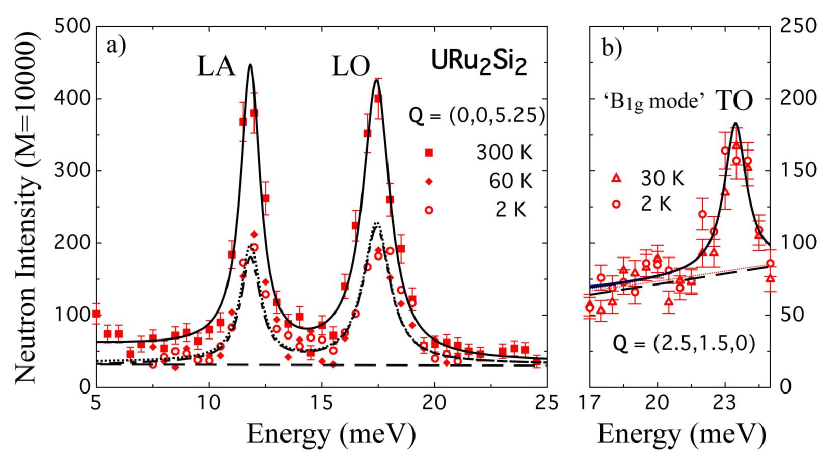
In the present paper, the scattering vector is decomposed into , where is a reciprocal lattice wave vector and is the wave-vector of the excitation. The cartesian coordinates of =(, , ) are expressed in reciprocal lattice units (r.l.u.). Representative phonon spectra measured on IN8 are shown in Figure 11(a) for =(0, 0, 5.25). The two peaks at 11.8 and respectively 17.5 meV correspond to longitudinal acoustic (LA) and respectively longitudinal optic (LO) modes. Fits of the data are made at =300 K using a flat background and a damped harmonic oscillator for the scattering function. The data at 2 K and 60 K are described by using the parameters obtained at 300 K except the intensity that is rescaled by the Bose factor. This procedure allows us to spot anomalous temperature behavior of the phonons.
The overall phonon modes measured along [0,0,1], [1,0,0] and [1,1,0] directions do not show noticeable temperature dependence on cooling from 300 K to 2 K or on crossing , except for a small expected hardening (See the LO branch in Figure 11 shifting a little to higher energy with decreasing temperature) which is a normal behavior of phonon on cooling. Although the softening of the B1g mode seen by Raman scattering is too small (0.5%) to be detected by neutron measurement, a larger softening could occur at finite . Therefore a particular attention has been focused on the temperature dependence of the "B1g" branch for in [0,0,1] and [1,1,0] directions. As presented for instance Figure 11(b) for =(2.5,1.5,0), no temperature difference has been observed between 2K and 30K.
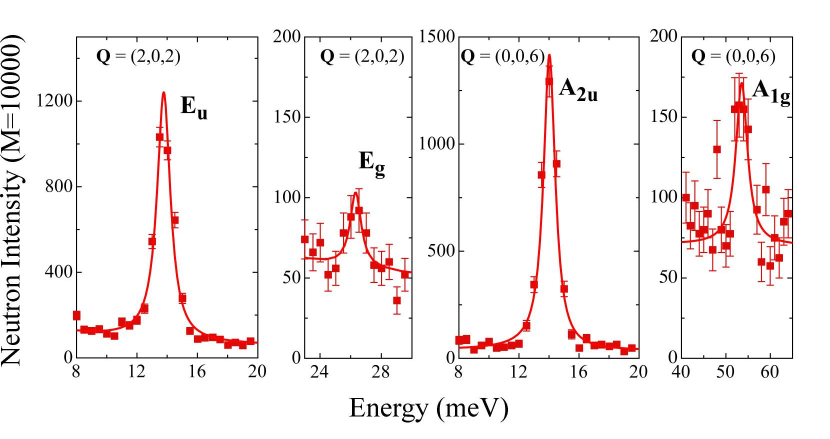
Figure 12 shows the four phonon modes Eu, Eg, A2u and A1g seen at point by INS. A good agreement is found with the energy of these phonon modes measured by IR and Raman spectroscopy.
Further emphasis was given in the study of the phonons along the [1,1,0] direction by polarized neutron scattering following the report of anomalous phonon softening in this direction below Butch et al. (2012).
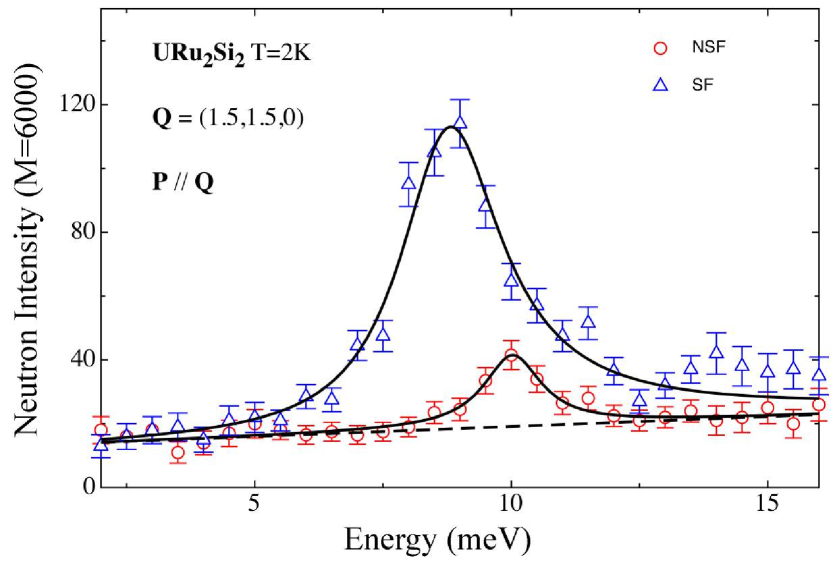
Figure 13 shows a representative measurement performed on IN22, with the neutron polarization parallel to , at X point in the Brillouin zone (See Figure 14) for =(1.5, 1.5, 0) at =2 K for SF and NSF scattering. In the NSF scattering a phonon mode is observed at around 10 meV. In the SF channel, the large intensity peak centered at around 8.7 meV corresponds to the well-known magnetic excitation of URu2Si2. The peak position is in agreement with an early study performed along the [1,1,0] direction by Broholm et al. Broholm et al. (1991). We therefore conclude the reported soft phonon mode Butch et al. (2012) is in fact a magnetic excitation, an unambiguous result obtained by polarized INS.
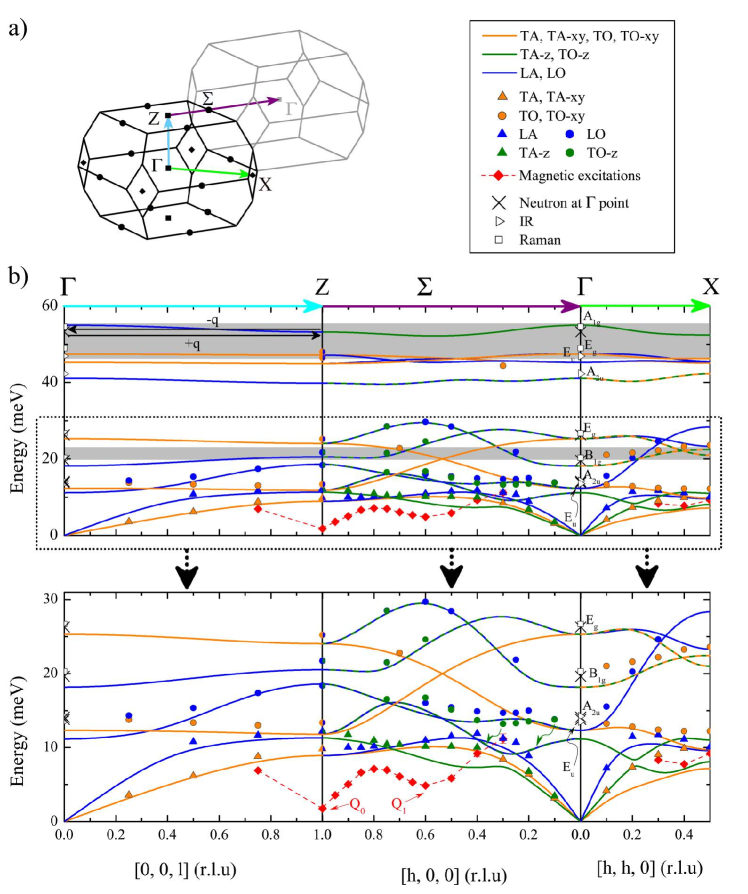
Figure 14 summarize all the phonon and magnetic excitations dispersions we have measured along the main directions [1,0,0], [0,0,1] and [1,1,0]. As we have not observed any significant variation of the phonon energies as a function of temperature between 300 K and 2 K, we have reported the energy average of all measured temperature for each phonon mode. There is a fairly good agreement between the measurement and the calculation which includes the spin-orbit coupling (See section VI), except for few branches. The energy of the transverse (T) modes TA-z and TO-z (or "A2u(1)" branch) along [1,0,0] and TA-xy along [1,1,0] lines is higher than what is expected by the calculation.
We have not observed any magnetic excitations along [1,0,0] nearby point. Then, most probably, the excitations reported by Broholm Broholm et al. (1991) in this -space zone are the optical phonon mode (’Eu’ or ’A2u’ branches).
Furthermore, we report no particular anomaly of the phonon branches around and points where magnetic excitations are centered. No strong magneto-elastic coupling related to these magnetic modes is in play in URu2Si2.
VI THEORETICAL CALCULATIONS OF PHONON DISPERSION CURVES
The calculations have been performed using the density functional theory (DFT) implemented in the VASP software. Kresse and Furthmüller (1996) The electron potentials and wave-functions were obtained within the projector-augmented waves method Blochl (1994) and the exchange and correlation energy was described by the generalized-gradient approximation. Perdew et al. (1996) The expansion of the single-particle plane waves has been restricted by the energy cutoff of 340 eV. The electronic and crystal structure have been optimized in the supercell (40 atoms) with the periodic boundary conditions. We performed two types of calculations, with and without spin-orbit coupling (SOC), assuming in both cases the non-magnetic ground state. The optimization with the SOC gives slightly larger lattice constants than without SOC (see Table 2). In both cases, the optimized lattice constants and the position of Si atoms () show good agreement with the experimental values and the previous relativistic full-potential calculations Oppeneer et al. (2010).
| (Å) | (Å) | (Å3) | |||
|---|---|---|---|---|---|
| SOC | 4.143 | 9.589 | 2.31 | 164.59 | 0.374 |
| no SOC | 4.136 | 9.549 | 2.31 | 163.35 | 0.375 |
| exp. | 4.124 | 9.582 | 2.32 | 162.96 | 0.371 |
| Phonon modes | measured by | Atomic intensities | |||||
|---|---|---|---|---|---|---|---|
| at point | Raman spectroscopy | IR | neutron | calculated | U | Ru | Si |
| A2u | / | 114.8 | 111.2 | 90.1 (84.7) | 0.52 | 0.42 | 0.06 |
| Eu | / | 109.1 | 113.6 | 99.5 (101.6) | 0.52 | 0.42 | 0.06 |
| B1g | 163.6 | / | 158.1 (leakage) | 146.7 (144.2) | 0 | 1.00 | 0.00 |
| Eg | 215.1 | / | 212.0 | 204.3 (206.6) | 0 | 0.74 | 0.26 |
| A2u | / | 340.8 | / | 331.5 (331.3) | 0 | 0.17 | 0.83 |
| Eu | / | 378.6 | / | 365.3 (364.2) | 0 | 0.17 | 0.83 |
| Eg | 394.1 | / | / | 382.9(382.7) | 0 | 0.26 | 0.74 |
| A1g | 439.7 | / | 429.1 | 443.9 (459.7) | 0 | 0.00 | 1.00 |
The phonon dispersion curves were obtained by using the direct method.Parlinski et al. (1997); Parlinski (2011) In this approach, the force constants are derived from the Hellmann-Feynman (HF) forces calculated by displacing atoms from equilibrium positions. Due to symmetry constraints, only three atoms (Si, Ru, and U) have to be displaced along two non-equivalent directions, and . In total, 12 independent calculations have been performed, including displacements in positive and negative directions. The phonon dispersions were calculated by the exact diagonalization of the dynamical matrix, obtained directly from the force constants.
The nature of the Raman and infrared-active vibrations are described in Fig. 1 and Table 1. However, calculations of the phonon dispersion curves allow for a more detailed description of the actual atomic character of the vibrations. The atomic intensities for each phonon branch at the point is shown in Table 3. In this case, the intensity refers to the square of the vibrational amplitude of each atom for a given branch. This is particularly useful for the infrared-active A2u and Eu modes, which in principle involve displacements of all of the atoms in the unit cell. The atomic intensity reveals that at the point, the low-frequency A2u and Eu modes involve mainly the U and Ru atoms, while the high-frequency A2u and Eu modes are almost entirely Si in character with a slight involvement of the Ru atom.
.
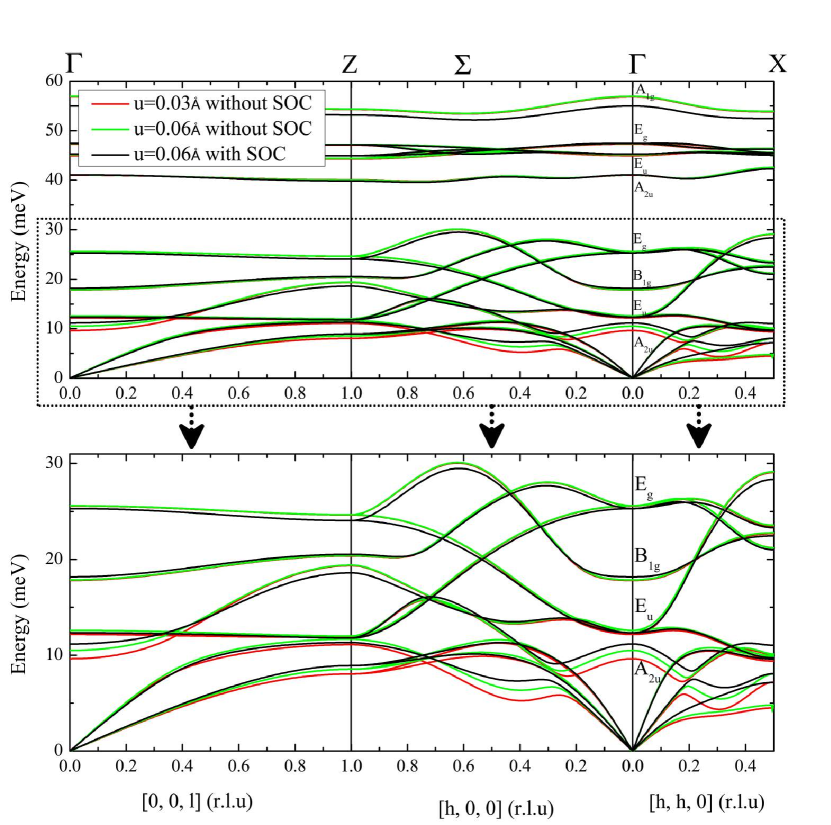
In order to investigate possible anharmonic effects, two different sets of displacements, with Å and Å, were used to derive the HF forces. This approach would give us information about the possible deviation from the harmonic potential and it has been used previously to study the anharmonic behaviour in magnetite Hoesch et al. (2013). The results of both calculations are presented in Figure 15. Instead of phonon softening typical for an anharmonic potential, we observe the increase in energy at larger value of . The effect is more apparent for the TA-z and the lowest TO mode along the and directions and TA-xy along the direction. At the point, two lowest infrared modes A2u and Eu shift by and , respectively 111In the case of smaller displacements Å numerical values of forces are too small, which may be the origin of some numerical error, therefore, we present phonon energies c and dispersions obtained for Å.. The energies of other modes depend on very weakly.
To analyze the effect of the SOC, we have compared the results obtained with and without the SOC calculated for Å. As we see in Figure 15, the strongest effect is found for the lowest infrared A2u mode, which is shifted upward by due to the SOC. The increase in energy in spite of larger lattice constants indicates a direct influence of the modified electronic structure on interatomic forces and phonon energies. Interestingly, the modes, which are strongly modified by the SOC, exhibit also the most pronounced dependence on , and simultaneously they show the largest disagreement with the INS data (see Figure 14 and Table 3). The results obtained with the SOC and Å,are slightly closer to the experimental points than the two other calculations.
VII General discussion and Conclusion
Recently, orthorhombic distortion upon entering the HO has been measured by X-ray scattering by Tonegawa et al. Tonegawa et al. (2014) in disagreement with results by Amitsuka et al. 222H. Amitsuka, Workshop on hidden order, superconductivity and magnetism in URu2Si2, Leiden (2013).. Quantitative prediction of the effect of such distortion on the lattice dynamics would be of high interest as the phonon modes with displacements in the (a,a) plane would be expected to broaden or split. We do not observe any splitting or broadening of the phonons measured by Raman scattering or by optical conductivity measurements, but a quantitative comparison with the predictions based on this recent measurement and the width across T0 as measured by optical spectroscopy would be necessary to definitively conclude.
Based on the observation of the same characteristic vector Q0 in the HO and AF phase Hassinger et al. (2010); Yoshida et al. (2013); Buhot et al. (2014) (Brillouin zone folding from a bct to st) and the absence of lattice distortion across T0, Harima et al. Harima et al. (2010) have selected 4 subgroups of the group 139 as candidates for the lower space group of the HO state (n∘ 126, 128, 134, and 136); all have D4h symmetry. Even without lattice distortion, across T0, group theory predicts that new active phonon modes are allowed to emerge (B2g phonon mode in the group n∘ 126, 134 and 136; only the group n∘ 128 doesn’t have active B2g phonon mode), some modes can be split (Eg or Eu modes) or new atoms are allowed to participate to the phonon movements (Uranium atoms in the Eg mode in group n∘ 126 and 134). None of these predictions have been observed here. Of course the effects of the electronic transition on the lattice dynamics might be very limited. Quantitative calculations on the lattice dynamics based on precise electronic ordering at T0 would be necessary to distinguish which effects would be sizable.
In conclusion, we have performed Raman scattering, optical conductivity, inelastic neutron scattering measurements and ab initio calculations focused on the lattice dynamic properties of URu2Si2 in the 300 K - 2 K temperature range. We have measured all the optical phonon modes at the center of the Brillouin zone (BZ) and we have followed almost all phonon branches below 30 meV in the main symmetry directions of the BZ, together with their temperature dependencies. No particular effect of the entrance into the hidden order state has been detected except a change in the Fano shape of the Eu(2) phonon mode, a phonon which exhibits also a large increase of its spectral weight upon cooling from 300 K consistently with important electron-phonon coupling for this phonon. We attribute this behavior to the large loss of carriers upon entering the HO state. Other main effects have been obtained when entering into the Kondo regime. Indeed, we measure a small (0.5) but sizable softening of the B1g phonon mode below 100 K. Most probably a complex electron-phonon coupling is in play, related to the Kondo physics. This and the previously reported softening of the elastic constant of the same symmetry observed by ultrasound velocity measurements strongly suggest a B1g symmetry-breaking instability in the Kondo regime. The Kondo cross-over also impacts the infrared-active Eu(1) and A2u(2)modes. Both of them present a Fano shape but whereas the A2u(2) mode loses its Fano shape below 150 K, the Eu(1) mode acquires it below 100 K, in the Kondo cross-over regime. We attribute this behavior to strongly momentum-dependent Kondo physics. By drawing the full dispersion of the phonon modes and magnetic excitations, we conclude that there is no strong magneto-elastic coupling in URu2Si2. No remarkable temperature dependence has been obtained by INS including through the hidden order transition. Thanks to polarized inelastic neutron scattering, we were able to distinguish between phonon and magnon modes near the X and points of the BZ, shedding light on previous reports Broholm et al. (1987); Butch et al. (2012). The ab initio calculations of phonon energies and polarization vectors allowed us for the detailed analysis of phonon modes in the zone center and along the high-symmetry directions. A good agreement between the theory and experiment observed for most of dispersion curves indicates the itinerant character of electrons. The discrepancy found for the lowest TA and TO modes propagating in the plane may be caused by additional effects such as strong electron correlations, magnetic interactions or relativistic effects not fully included in the present calculations.
Acknowledgements.
This work was supported by the Labex SEAM (Grant No. ANR-11-IDEX-0005-02) and by the french Agence Nationale de la Recherche (ANR PRINCESS). CCH is supported by the U.S. Department of Energy (DOE), Office of Basic Energy Sciences, Division of Materials Sciences and Engineering under Contract No. DE-AC02-98CH10886. The IT4Innovations National Supercomputing Center, VSB-Technical University, Ostrava, Czech Republic is acknowledged for providing the computer facilities under Grant Reg. No. CZ.1.05/1.1.00/02.0070. We thanks I. Paul, G. Knebel, C. Lacroix and P. Oppeneer for very fruitful discussions.References
- Palstra et al. (1985) T. T. M. Palstra, A. A. Menovsky, J. van den Berg, A. J. Dirkmaat, P. H. Kes, G. J. Nieuwenhuys, and J. A. Mydosh, Physical Review Letters 55, 2727 (1985).
- Mydosh and Oppeneer (2011) J. A. Mydosh and P. M. Oppeneer, Reviews of Modern Physics 83, 1301 (2011).
- Mydosh and Oppeneer (2014) J. Mydosh and P. Oppeneer, Philosophical Magazine , 1 (2014).
- Schlabitz et al. (1986) W. Schlabitz, J. Baumann, B. Pollit, U. Rauchschwalbe, H. M. Mayer, U. Ahlheim, and C. D. Bredl, Zeitschrift für Physik B Condensed Matter 62, 171 (1986).
- de Visser et al. (1986) A. de Visser, F. E. Kayzel, A. A. Menovsky, J. J. M. Franse, J. van den Berg, and G. J. Nieuwenhuys, Physical Review B 34, 8168 (1986).
- Broholm et al. (1991) C. Broholm, H. Lin, P. T. Matthews, T. E. Mason, W. J. L. Buyers, M. F. Collins, A. A. Menovsky, J. A. Mydosh, and J. K. Kjems, Physical Review B 43, 12809 (1991).
- Kusunose and Harima (2011) H. Kusunose and H. Harima, Journal of the Physical Society of Japan 80, 084702 (2011).
- Haule and Kotliar (2009) K. Haule and G. Kotliar, Nature Physics 5, 796 (2009).
- Ikeda et al. (2012) H. Ikeda, M.-T. Suzuki, R. Arita, T. Takimoto, T. Shibauchi, and Y. Matsuda, Nature Physics 8, 528 (2012).
- Rau and Kee (2012) J. G. Rau and H.-Y. Kee, Physical Review B 85, 245112 (2012).
- Fujimoto (2011) S. Fujimoto, Physical Review Letters 106, 196407 (2011).
- Riseborough et al. (2012) P. S. Riseborough, B. Coqblin, and S. G. Magalhães, Physical Review B 85, 165116 (2012).
- Das (2014) T. Das, Physical Review B 89, 045135 (2014).
- Pépin et al. (2011) C. Pépin, M. R. Norman, S. Burdin, and A. Ferraz, Physical Review Letters 106, 106601 (2011).
- Chandra et al. (2013) P. Chandra, P. Coleman, and R. Flint, Nature 493, 621 (2013).
- Elgazzar et al. (2009) S. Elgazzar, J. Rusz, M. Amft, P. M. Oppeneer, and J. A. Mydosh, Nature Materials 8, 337 (2009).
- Bourdarot et al. (2010) F. Bourdarot, E. Hassinger, S. Raymond, D. Aoki, V. Taufour, L.-P. Regnault, and J. Flouquet, Journal of the Physical Society of Japan 79, 064719 (2010).
- Wiebe et al. (2007) C. R. Wiebe, J. A. Janik, G. J. MacDougall, G. M. Luke, J. D. Garrett, H. D. Zhou, Y.-J. Jo, L. Balicas, Y. Qiu, J. R. D. Copley, Z. Yamani, and W. J. L. Buyers, Nature Physics 3, 96 (2007).
- Villaume et al. (2008) A. Villaume, F. Bourdarot, E. Hassinger, S. Raymond, V. Taufour, D. Aoki, and J. Flouquet, Physical Review B 78, 012504 (2008).
- Bonn et al. (1988) D. A. Bonn, J. D. Garrett, and T. Timusk, Physical Review Letters 61, 1305 (1988).
- Schoenes et al. (1987) J. Schoenes, C. Schonenberger, J. J. M. Franse, and A. A. Menovsky, Physical Review B 35, 5375 (1987).
- Palstra et al. (1986) T. T. M. Palstra, A. A. Menovsky, G. J. Nieuwenhuys, and J. A. Mydosh, Journal of Magnetism and Magnetic Materials 54, 435 (1986).
- Aynajian et al. (2010) P. Aynajian, E. H. da Silva Neto, C. V. Parker, Y. Huang, A. Pasupathy, J. Mydosh, and A. Yazdani, Proceedings of the National Academy of Sciences 107, 10383 (2010).
- Scheerer et al. (2012) G. W. Scheerer, W. Knafo, D. Aoki, G. Ballon, A. Mari, D. Vignolles, and J. Flouquet, Physical Review B 85, 094402 (2012).
- Hassinger et al. (2010) E. Hassinger, G. Knebel, T. D. Matsuda, D. Aoki, V. Taufour, and J. Flouquet, Physical Review Letters 105, 216409 (2010).
- Buhot et al. (2014) J. Buhot, M.-A. Méasson, Y. Gallais, M. Cazayous, G. Lapertot, D. Aoki, and A. Sacuto, arXiv:1407.4651 [cond-mat] (2014).
- Okazaki et al. (2011) R. Okazaki, T. Shibauchi, H. J. Shi, Y. Haga, T. D. Matsuda, E. Yamamoto, Y. Onuki, H. Ikeda, and Y. Matsuda, Science 331, 439 (2011).
- Tonegawa et al. (2012) S. Tonegawa, K. Hashimoto, K. Ikada, Y.-H. Lin, H. Shishido, Y. Haga, T. D. Matsuda, E. Yamamoto, Y. Onuki, H. Ikeda, Y. Matsuda, and T. Shibauchi, Physical Review Letters 109, 036401 (2012).
- Tonegawa et al. (2014) S. Tonegawa, S. Kasahara, T. Fukuda, K. Sugimoto, N. Yasuda, Y. Tsuruhara, D. Watanabe, Y. Mizukami, Y. Haga, T. D. Matsuda, E. Yamamoto, Y. Onuki, H. Ikeda, Y. Matsuda, and T. Shibauchi, Nature Communications 5, 5188 (2014).
- Cooper et al. (1986) S. L. Cooper, M. V. Klein, Z. Fisk, and J. L. Smith, Physical Review B 34, 6235 (1986).
- Yanagisawa et al. (2013) T. Yanagisawa, S. Mombetsu, H. Hidaka, H. Amitsuka, M. Akatsu, S. Yasin, S. Zherlitsyn, J. Wosnitza, K. Huang, and M. Brian Maple, Journal of the Physical Society of Japan 82, 013601 (2013).
- Kuwahara et al. (1997) K. Kuwahara, H. Amitsuka, T. Sakakibara, O. Suzuki, S. Nakamura, T. Goto, M. Mihalik, A. Menovsky, A. De Visser, and J. Franse, Journal of the Physical Society of Japan 66, 3251 (1997).
- Butch et al. (2012) N. P. Butch, M. E. Manley, J. R. Jeffries, M. Janoschek, K. Huang, M. B. Maple, and J. W. Lynn, arXiv preprint arXiv:1212.6238 (2012).
- Hayes and Loudon (2004) W. Hayes and R. Loudon, Scattering of Light by Crystals, Dover Books on Physics (Dover Publications, 2004).
- Aoki et al. (2010) D. Aoki, F. Bourdarot, E. Hassinger, G. Knebel, A. Miyake, S. Raymond, V. Taufour, and J. Flouquet, Journal of Physics: Condensed Matter 22, 164205 (2010).
- Buhot et al. (2013) J. Buhot, M.-A. Méasson, Y. Gallais, M. Cazayous, A. Sacuto, G. Lapertot, and D. Aoki, Journal of the Korean Physical Society 62, 1427 (2013).
- Klemens (1966) P. G. Klemens, Physical Review 148, 845 (1966).
- Menéndez and Cardona (1984) J. Menéndez and M. Cardona, Physical Review B 29, 2051 (1984).
- Fano (1961) U. Fano, Physical Review 124, 1866 (1961).
- Cardona (1982) M. Cardona, Light Scattering in Solids I: Introductory Concepts (Springer Berlin Heidelberg, 1982).
- Cooper et al. (1987) S. L. Cooper, M. V. Klein, M. B. Maple, and M. S. Torikachvili, Physical Review B 36, 5743 (1987).
- Lampakis et al. (2006) D. Lampakis, D. Palles, E. Liarokapis, and J. Mydosh, Physica B: Condensed Matter 378-380, 578 (2006).
- Nagel et al. (2012) U. Nagel, T. Uleksin, T. Room, R. P. S. M. Lobo, P. Lejay, C. C. Homes, J. S. Hall, A. W. Kinross, S. K. Purdy, T. Munsie, T. J. Williams, G. M. Luke, and T. Timusk, Proceedings of the National Academy of Sciences 109, 19161 (2012).
- Guo et al. (2012) W. T. Guo, Z. G. Chen, T. J. Williams, J. D. Garrett, G. M. Luke, and N. L. Wang, Physical Review B 85, 195105 (2012).
- Levallois et al. (2011) J. Levallois, F. Lévy-Bertrand, M. K. Tran, D. Stricker, J. A. Mydosh, Y.-K. Huang, and D. van der Marel, Physical Review B 84, 184420 (2011).
- Homes et al. (1993) C. C. Homes, M. Reedyk, D. A. Cradles, and T. Timusk, Applied Optics 32, 2976 (1993).
- Degiorgi et al. (1997) L. Degiorgi, S. Thieme, H. R. Ott, M. Dressel, G. Grüner, Y. Dalichaouch, M. B. Maple, Z. Fisk, C. Geibel, and F. Steglich, Zeitschrift für Physik B Condensed Matter 102, 367 (1997).
- Davis and Feldkamp (1977) L. C. Davis and L. A. Feldkamp, Physical Review B 15, 2961 (1977).
- Martinho et al. (2007) H. Martinho, P. G. Pagliuso, V. Fritsch, N. O. Moreno, J. L. Sarrao, and C. Rettori, Physical Review B 75, 045108 (2007).
- Panarin et al. (2011) J. Panarin, S. Raymond, G. Lapertot, J. Flouquet, and J.-M. Mignot, Physical Review B 84, 052505 (2011).
- Kresse and Furthmüller (1996) G. Kresse and J. Furthmüller, Physical Review B 54, 11169 (1996).
- Blochl (1994) P. E. Blochl, Physical Review B 50, 17953 (1994).
- Perdew et al. (1996) J. P. Perdew, K. Burke, and M. Ernzerhof, Physical Review Letters 77, 3865 (1996).
- Oppeneer et al. (2010) P. M. Oppeneer, J. Rusz, S. Elgazzar, M.-T. Suzuki, T. Durakiewicz, and J. A. Mydosh, Physical Review B 82, 205103 (2010).
- Cordier et al. (1985) G. Cordier, E. Czech, H. Schäfer, and P. Woll, Journal of the Less Common Metals 110, 327 (1985).
- Parlinski et al. (1997) K. Parlinski, Z. Q. Li, and Y. Kawazoe, Physical Review Letters 78, 4063 (1997).
- Parlinski (2011) K. Parlinski, Collection SFN 12, 161 (2011).
- Hoesch et al. (2013) M. Hoesch, P. Piekarz, A. Bosak, M. Le Tacon, M. Krisch, A. Kozłowski, A. M. Oleś, and K. Parlinski, Physical Review Letters 110, 207204 (2013).
- Note (1) In the case of smaller displacements Å numerical values of forces are too small, which may be the origin of some numerical error, therefore, we present phonon energies c and dispersions obtained for Å.
- Note (2) H. Amitsuka, Workshop on hidden order, superconductivity and magnetism in URu2Si2, Leiden (2013).
- Yoshida et al. (2013) R. Yoshida, K. Tsubota, T. Ishiga, M. Sunagawa, J. Sonoyama, D. Aoki, J. Flouquet, T. Wakita, Y. Muraoka, and T. Yokoya, Scientific Reports 3, 02750 (2013).
- Harima et al. (2010) H. Harima, K. Miyake, and J. Flouquet, Journal of the Physical Society of Japan 79, 033705 (2010).
- Broholm et al. (1987) C. Broholm, J. K. Kjems, W. J. L. Buyers, P. Matthews, T. T. M. Palstra, A. A. Menovsky, and J. A. Mydosh, Physical Review Letters 58, 1467 (1987).