X-ray Flare Spectra from the DIOGENESS Spectrometer and its concept applied to ChemiX on the Interhelioprobe spacecraft
Abstract
The DIOGENESS X-ray crystal spectrometer on the CORONAS-F spacecraft operated for a single month (25 August to 17 September) in 2001 but in its short lifetime obtained one hundred and forty high-resolution spectra from some eight solar flares with GOES importance ranging from C9 to X5. The instrument included four scanning flat crystals with wavelength ranges covering the regions of Si xiii (6.65 Å), S xv (5.04 Å), and Ca xix (3.18 Å) X-ray lines and associated dielectronic satellites. Two crystals covering the Ca xix lines were oriented in a “Dopplerometer” manner, i.e. such that spatial and spectral displacements both of which commonly occur in flares can be separated. We describe the DIOGENESS spectrometer and the spectra obtained during flares which include lines not hitherto seen from spacecraft instruments. An instrument with very similar concept is presently being built for the two Russian Interhelioprobe spacecraft due for launch in 2020 and 2022 that will make a near-encounter (perihelion a.u.) to the Sun in its orbit. We outline the results that are likely to be obtained.
keywords:
Flares, Spectrum; Spectral Line, Intensity and Diagnostics; Spectrum, X-ray1 Introduction
Scanning X-ray flat crystal spectrometers on rockets and spacecraft have been used to observe flares and non-flaring active regions for many years, and the resulting spectra have helped our understanding of the energetics and physical characteristics of the emitting regions and the mechanism of flare energy release. Instruments with an accurate absolute intensity calibration have also enabled element abundances in the corona to be found. The rapidly developing initial phases of flares, in which high-temperature plasma is ejected from localised sources such as the footpoints of magnetic flux tubes, requires X-ray spectrometers that can acquire and store data on very short time scales. This has led to the application of bent crystal spectrometers with position-sensitive detectors for solar-dedicated spacecraft. Early examples include those on the Solar Maximum Mission (BCS or Bent Crystal Spectrometer: Acton et al. (1980)), Yohkoh (BCS or Bragg Crystal Spectrometer: Culhane et al. (1991)), and CORONAS-F (RESIK or REntgenovsky Spektrometr s Izognutymi Kristalami: Sylwester et al. (2005)).
Bent crystal spectrometers have the advantage of obtaining spectra over their wavelength ranges instantaneously in a particular data-gathering interval, typically a few seconds, and also of generally having higher sensitivity than flat crystal spectrometers. However, for observing the initial phases of flares, spectra from bent crystal spectrometers, especially those without a fine collimator which reduces their sensitivity, are subject to a confusion of spectral and spatial blurring without the possibility of untangling the two unless independent measurements are available. This difficulty may be overcome with the simultaneous observation of flares with a pair of crystals oriented in such a way that the spatial displacements occur to longer wavelengths for one of them and to shorter wavelengths for the other. This “dopplerometer” mode was proposed for an instrument initially launched on a Vertical rocket in the Russian space programme by the Space Research Centre of the Polish Academy of Sciences in 1981. A later version, called DIOGENESS (DIagnostics Of Global ENErgy Sources and Sinks) was built by SRC for inclusion on the Russian CORONAS-I spacecraft in the mid-1990s and, following the failure of the instrument, for the subsequent CORONAS-F spacecraft, which was operational from 2001 till 2006. Four scanning flat crystals were included for the observation of the vicinity of intense lines of high-temperature ions – Si xiii (6.65 Å), S xv (5.04 Å), and Ca xix (3.18 Å) – prominent in flare and some active region spectra, with two of the crystals observing the Ca xix lines in a dopplerometer arrangement.
The CORONAS-F spacecraft was launched on 31 July 2001 and worked successfully until the end of 2006, with RESIK and DIOGENESS included in the instrument package. While RESIK obtained spectra until May 2003, DIOGENESS operated for only a few weeks as a fault in the scanning drive mechanism occurred on 17 September 2001. However, eight flares with GOES importance up to X5.5 were observed and one hundred and forty spectra were obtained in four wavelength channels. Detailed analysis was delayed for some years while the more extensive RESIK data set were examined. In the meantime, another version of DIOGENESS called ChemiX is being built for inclusion in the instrument package on two Russian Interhelioprobe spacecraft, due for launch in 2020 and 2022, which will eventually orbit the Sun in highly elliptical paths, with inclination to the ecliptic plane, bringing them to within 0.3 astronomical unit from the Sun. It is appropriate, therefore, to describe the DIOGENESS and ChemiX instruments in some detail at this time, even though the two earlier versions were launched some years ago. In particular it is of interest to describe the DIOGENESS spectra which have particularly good resolution and allow the flare dynamics and abundance ratios to be determined as well as investigation of lines not previously noted in solar spectra.
In this paper, we give a description of the DIOGENESS instrument and some details of the CORONAS-F spacecraft and operations (Section 2), the flare spectra obtained in its operating lifetime including a list of the lines observed (Section 3), and a description of the forthcoming ChemiX instrument due to fly on the Interhelioprobe missions (Section 4).
2 CORONAS-F and the DIOGENESS instrument
2.1 Spacecraft and performance
CORONAS-F was the second of three Russian spacecraft designed to observe various solar phenomena over the period 1994–2009, with thirteen instruments studying global oscillations, variations in ultraviolet, X-ray, and gamma-ray emission, and particle emission. The spacecraft was launched into a near-circular orbit around the Earth with an altitude range of 501–549 km. The orbital plane was inclined at to the equator, and its initial period was 94.9 minutes. Intervals of uninterrupted solar observation were possible for up to 20 days on two occasions during a year, while at other times the spacecraft night-time periods lasted no more than 35 minutes. Solar X-ray observations were also interrupted by passages through the auroral oval particle zones near the Earth’s magnetic poles and the South Atlantic Anomaly. Spacecraft pointing at the Sun was achieved with a 15-arcminute precision.
The instrument package is described by Oraevsky and Sobelman (2002). The RESIK and DIOGENESS instruments were built by teams led by the Space Research Centre, Polish Academy of Sciences, in Wrocław, Poland. RESIK has been described by Sylwester et al. (2005). It was a bent crystal spectrometer with four channels observing X-ray flare and non-flaring active region in the range 3.3–6.1 Å, which included emission lines of highly ionized Si, S, Cl, Ar, and K ions. An absolute flux calibration of % precision was achieved for the instrument, allowing element abundances to be determined. These estimates have been discussed in several publications: see Sylwester et al. (2014) and references therein. RESIK operated from the time of spacecraft launch until May 2003 when there was an instrument power supply failure.
2.2 DIOGENESS: instrument and performance
The DIOGENESS instrument by contrast with RESIK had a lifetime of only a few weeks, but the instrument’s concept including that of the Dopplerometer was adequately verified. The construction of the instrument was outlined by Płocieniak et al. (2002) and Siarkowski et al. (2002). DIOGENESS had four channels covering wavelength ranges in the vicinity of intense lines of highly ionized Si, S, and Ca lines visible in solar flares. Two quartz crystals covered the Ca xix lines (channels 1 and 4), and ADP and beryl crystals (channels 2 and 3) covered the S xv and Si xiii lines respectively. Table \irefdiog_channels gives details of the wavelength ranges and crystals. The mono-crystals were flat and mounted on a common rotatable shaft, so a scanning motion back and forth of the shaft allowed X-rays with various wavelengths to be diffracted according to Bragg’s diffraction law,
| (1) |
where is the crystal lattice spacing, the angle of incidence, and the diffraction order. Only first-order () spectra were recorded. The angular range of the crystal shaft was 140 arcmin, giving the wavelength ranges specified in Table \irefdiog_channels. The spectral resolution of each crystal is defined by the rocking curve, values of which (FWHM) are given in arcsec in Table \irefdiog_channels. The instrument was uncollimated but as flares generally have small angular extents (typically a few arcmin) the emission region can be considered to be a point source so a collimator is generally not necessary. The diffracted X-rays are registered by double proportional counters with beryllium entrance windows of 145 m thickness and filled with argon gas with small admixture of carbon dioxide quenching gas at atmospheric pressure. An Fe55 source (energy 5.9 keV) illuminates the other, non-solar proportional counter section so that the detector’s electronic system’s energy gain could be checked. A multi-slit collimator with soft X-ray detectors scanning in the direction of the spectrometer’s dispersion was also included to give spatial context information, but unfortunately this part of the instrument failed early in the mission.
| Channel | 1 | 2 | 3 | 4 |
| Crystal | Quartz | ADP | Beryl | Quartz |
| Diffracting plane | 101 | 101 | 1010 | 101 |
| spacing (Å)\tabnotePrelaunch measurement. | 6.6855 | 10.5657 | 15.9585 | 6.6875 |
| Central wavelength (Å) | 3.1781 | 5.0374 | 6.6488 | 3.1781 |
| Principal lines in range | Ca xix | S xv | Si xiii | Ca xix |
| Min. of wavelength range (Å) | 3.1436 | 4.9807 | 6.1126 | 2.9601 |
| Max. of wavelength range (Å) | 3.3915 | 5.3721 | 6.7335 | 3.2123 |
| Crystal reflectivity (rad)1 | 91 | 91 | 15 | 90 |
| Rocking curve (FWHM, arcsec)1 | 24.1 | 68.1 | 94.1 | 25.6 |
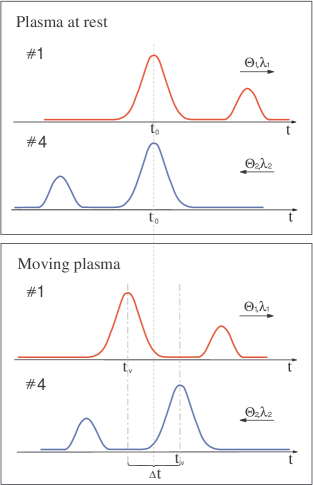
For channels 2 and 3, the Si xiii and S xv lines were scanned over the period of a flare in the direction of alternately increasing and decreasing wavelengths repeatedly. Figure \irefdiag_principle shows the arrangement for channels 1 and 4 which viewed the Ca xix lines with identical quartz crystals cut from the same parent mono-crystal at an angle between the diffracting planes of the crystals, the so-called dopplerometer mode. Solar X-rays are incident on each crystal in the manner illustrated in the figure. As the two crystals on their common shaft are rotated, solar X-ray lines are successively recorded by each channel from the point-like flare on the Sun, as shown in the right-hand panel of Figure \irefdiag_principle. The angle was selected such that the Ca xix resonance line emitted by flare emission with zero radial velocity was observed simultaneously, its theoretical value being . (In practice, owing to co-alignment uncertainty, the angle was set to .) In Figure \irefdiag_principle, the two occasions when the vicinity of the Ca xix line was scanned simultaneously in the sense of increasing wavelengths (red scan in the figure) and decreasing wavelengths (blue scan) are shown. The horizontal axis indicates the stepper drive’s address rather than wavelength. For zero radial velocity of the flare source, the Ca xix line would be coincident for each scan but because of the presence of an approach velocity (such wavelength shifts have been commonly attributed to “chromospheric evaporation” or upward convection of the emitting plasma) the lines are separated in each scan. The linearity of the scanning mechanism was checked during the spacecraft mission using strain-gauge systems.

The effective areas of the four DIOGENESS channels (see Figure \irefeff_areas) were measured before spacecraft launch, and are the product of detector efficiency, filter transmission, crystal integrated reflectivity, and projected area of the detector window as seen from the Sun.

3 DIOGENESS Observations
3.1 Flare Spectra
Eight intense flares were observed during the lifetime of DIOGENESS; see Table \irefflares for details of these flares including times, standard IAU flare notation, GOES and H importance, and heliographic location. One hundred and forty spectra were obtained in the four channels for these events.
| Date | UT of | Flare notation | GOES | H | Location\tabnoteNo H records for Sept. 3 flares; locations from Yohkoh HXT images. |
|---|---|---|---|---|---|
| (2001) | peak | importance | importance | ||
| Aug. 25 | 16:45 | SOL2001-08-25T16:45 | X5.3 | 3B | S17E34 |
| Aug. 30 | 17:57 | SOL2001-08-30T17:57 | M1.5 | 2N | S21W28 |
| Sept. 2 | 06:02 | SOL2001-09-02T06:02 | M1.3 | 1F | S17W66 |
| Sept. 2 | 13:48 | SOL2001-09-02T13:48 | M3.0 | 2N | S21W65 |
| Sept. 3 | 01:58 | SOL2001-09-03T01:58 | C9.0 | - | S17E90 |
| Sept. 3 | 17:16 | SOL2001-09-03T17:16 | M1.1 | - | N10W06 |
| Sept. 3 | 18:41 | SOL2001-09-03T18:41 | M2.5 | - | S26E90 |
| Sept. 16 | 03:53 | SOL2001-09-16T03:53 | M5.6 | 2N | S29W54 |
The X5 flare on 25 August 2001 was observed to great advantage by DIOGENESS, from the earliest pre-flare state including a small precursor flare (16:17 UT) and the impulsive stage at around 16:30–16:32 UT, also seen with the Yohkoh Hard X-ray Telescope (HXT), until late in the decay stage, a total of nearly two hours. Figure \irefGOES_diag_lightcurves_color shows the light curves from the two GOES channels and the total emission in DIOGENESS channel 1 (Ca xix channel). The DIOGENESS light curve shows the Ca xix line emission as the Bragg diffraction condition (Eq. 1) was successively satisfied for the Ca xix emission lines a total of scans, i.e. approximately 140 s per scan. At the impulsive stage, the HXT saw emission up to its highest-energy channel (53–93 keV): see the light curves at four energy bands in Figure \irefhxt_Aug25flare (left-hand panel). The HXT images show the double-footpoint emission characteristic of large flares with soft X-ray emission (from the Yohkoh Soft X-ray Telescope) in between (see right-hand panel of Figure \irefhxt_Aug25flare).


(a) (b)
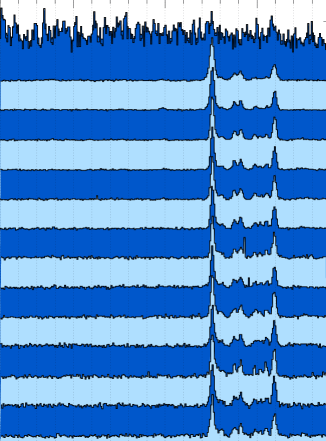
In Figure \irefcaxix_scans, channel 4 spectra over the Ca xix lines are indicated during the 25 August 2001 flare with forward and backward scans (wavelength increasing and decreasing with time respectively).

3.2 Plasma Dynamics in the 25 August 2001 Flare
Velocities of the emitting plasma during the 25 August 2001 flare were found from DIOGENESS Si xiii, S xv, and Ca xix spectra, with the Ca xix spectra from the dopplerometer part of the instrument. The left panel of Figure \irefdiog_vels shows the Ca xix spectra in channels 1 and 4 plotted in stepper motor addresses. The main lines apparent are the resonance (), intercombination (, ), and forbidden () lines of Ca xix in order of wavelength (see Table \irefline_ids). The channel 1 spectrum (in blue in Figure \irefdiog_vels) has wavelength increasing to the left, the channel 4 spectrum (in red) with channel 1 to the right. The scan times of the spectra are almost coincident. The deduced velocities for all channels are given as a function of time in Figure \irefdiog_vels (right panel). They indicate that there were high approach velocities at the time (approximately 16:31 UT) of the hard X-ray impulses recorded by the Yohkoh HXT M1, M2, and H channels (see light curves and images in Figure \irefhxt_Aug25flare). The highest velocity, 150 km s-1, is recorded by the S xv (temperature MK) line emission. The velocity of the higher-temperature ( MK) Ca xix line emission indicates a velocity of about 100 km s-1 as does the lower-temperature ( MK) Si xiii line emission.
These velocities are rather smaller than those previously observed for large disk flares. Thus, Doschek et al. (1980) in discussing several X-class flares seen with X-ray spectrometers on the P78-1 spacecraft found approach velocities of about 400 km s-1 for disk flares, as did Tanaka et al. (1982) for a very large disk flare seen with an X-ray spectrometer on the Hinotori spacecraft. It is possible that plasma motions during the 25 August 2001 flare observed by DIOGENESS were directed at a substantial angle to the line of sight (although the flare was on the disk, it was east of the central meridian), so accounting for the smaller observed approach velocities in its rise phase.


3.3 Spectral Line Identifications
Figure \irefdiog_sp shows an averaged spectrum from DIOGENESS channels 1 and 4 during the 25 August 2001 flare, peak time in soft X-rays at 16:45 UT (Table \irefflares), with flux on a logarithmic scale to show the weak line emission either side of the Ca xix line emission to better advantage. Table \irefline_ids gives the wavelengths of identifiable line features for the Å range. Channels 1 and 4 spectra cover the region of the Ca xix resonance () line and includes other Ca xix lines and dielectronic satellites of the Li-like (Ca xviii) and lower stages of ionization. These lines are familiar from previously flown X-ray spectrometers on the P78-1, SMM, Hinotori, and Yohkoh spacecraft. The ratios of the principal satellites ( and the , lines) to the Ca xix line have been used extensively to find flare and non-flaring active region temperatures and emission measures, based on the theory of Gabriel (1972) (whose line notation we use here) and Bely-Dubau et al. (1982). Ca xviii satellite is indistinguishable from Ca xix line . The ratio of the inner-shell excitation satellite to line depends on the ion fraction and so is in principle a means of finding departures of ionization equilibrium in the emitting plasma. However, satellite is blended with the Ar xvii line (this notation being used for the transition ).
In the DIOGENESS spectrum shown in Figure \irefdiog_sp, the Rydberg series of Ar xvii lines up to the line can be discerned. The Ca xix and Ar xvii spectra up to the line have been observed during strong flares with crystal spectrometers on the P78-1 spacecraft (Doschek, Feldman, and Seely, 1985; Seely and Feldman, 1985), with lines and blended with Ca xix dielectronic satellites on the long-wavelength side of the Ca xx Ly- doublet. Spectra from the Alcator C-Mod tokamak plasmas, recently reported by Rice et al. (2014), also show Ar xvii high- lines up to the ionization limit at 3.009 Å. All these lines, which are shortward of 3.06 Å, are outside the DIOGENESS range. We note that the estimated temperatures ( MK) and electron densities ( cm-3) in the Alcator plasmas are both higher than those typical of large solar flare plasmas ( MK and cm-3 respectively), but this has little effect on the appearance of the spectral lines, the principal excitation mechanism for which is electron collisional excitation from the ground state of ions in both cases.
In Table \irefline_ids, we follow Rice et al. (2014) and Seely and Doschek (1989) in identifying lines in the DIOGENESS spectrum on the long-wavelength side of the Ca xix forbidden line as Ca xvii satellites including the strong inner-shell-excited line , as well as Ca xviii satellites and which are both dielectronically and collisionally excited (Gabriel, 1972). In addition, a feature possibly made up of several lines between 3.261 Å and 3.272 Å, not apparently identified before, is likely to be due to a group of Ca xvi lines by analogy with equivalent lines of Fe xxii seen in solar flare spectra with the SMM Bent Crystal Spectrometer (Phillips et al., 1983). The Ca xviii two-electron-jump satellites and (transitions , ) may also contribute to this line feature: their wavelengths are estimated by Bely-Dubau et al. (1982) to be 3.2688 Å and 3.2636 Å respectively.

In DIOGENESS channel 2 spectra, the predominant lines are the resonance, intercombination, and forbidden lines of S xv and the Ly- () line of Si xiv, prominent also in RESIK spectra. The and lines are partially blended as are S xiv satellites , with S xv line and S xiv satellites , with S xv line . There is a possible long-wavelength “shoulder” of emission to the Si xiv line which may be due to the Si xiii line. In channel 3 spectra, the Si xiii – lines are the most prominent with Si xii satellites , , and identifiable. Possible very weak line features to the short-wavelength side of the Si xiii line occur. The Mg xii Rydberg sequence occur in this region, and were seen with the crystal spectrometers on OSO-8 (Parkinson et al., 1978). They may account for the 6.410 Å (), 6.490 Å (), and 6.580 Å () lines in the DIOGENESS spectra although the Mg xii line at 6.448 Å is not apparent. The Mg xii line blends with the Si xiii line. Note that the anomaly in the effective area due to the beryl crystal reflectivity at about 6.75 Å (see Figure \irefeff_areas) distorts the intensity of the Si xiii line.
In time, the line identifications given in Table \irefline_ids will be refined with better atomic data. In particular, we plan to run atomic codes to find the wavelengths of the satellites due to Ca xvi as was done for the case of the equivalent Fe ions (Phillips et al., 1983).
| Channels 1 and 4 | |||||
| Measured | Line identification | ||||
| line (Å) | Ion | (Å) | Transition | Name\tabnoteGabriel(1972) for He-like ion transitions and Li-like ion satellites. | Source\tabnoteD=Doschek et al. (1985); K=Kelly (1987); R=Rice et al. (2014); Ph=Phillips et al. (1983); S=Seely & Feldman (1985). |
| 3.068 | Ar xvii | 3.068 | R,S | ||
| 3.089 | |||||
| 3.095 | Ar xvii | 3.095 | K,S | ||
| 3.127 | Ar xvii | 3.128 | K,S | ||
| 3.148 | |||||
| 3.177 | Ca xix | 3.177 | K | ||
| 3.181 | Ca xviii | 3.1809 | K | ||
| 3.188 | Ca xix | 3.1889 | K | ||
| 3.191 | Ca xix | 3.1925 | K | ||
| 3.199 | Ca xviii | 3.2003 | K | ||
| Ar xvii | 3.200 | K | |||
| 3.203 | Ca xviii | 3.2031 | K | ||
| 3.206 | Ca xviii | 3.2058 | K | ||
| 3.210 | Ca xix | 3.2111 | K | ||
| Ca xviii | 3.2097 | K | |||
| 3.222 | Ca xvii | 3.2217 | R | ||
| 3.225 | Ca xvii | ? | Ph | ||
| 3.225 | Ca xviii | 3.2266 | R,D | ||
| 3.230 | Ca xviii | 3.2277 | R,D | ||
| 3.230 | Ca xvii | ? | Ph | ||
| 3.272 | Ca xvi | ? | Ph | ||
| Channel 2 | |||||
| 5.037 | S xv | 5.0385 | K | ||
| 5.047 | S xiv | 5.0468 | K | ||
| 5.062 | S xv | 5.06? | K | ||
| 5.064 | S xv | 5.0662 | K | ||
| 5.083 | S xiv | 5.0861 | K | ||
| 5.099 | S xiv | 5.0964 | K | ||
| S xv | 5.101 | K | |||
| S xiv | 5.1010 | K | |||
| Si xiv | 5.217 | Ly- | |||
| Channel 3 | |||||
| 6.410 | Mg xii ? | 6.497 | Ly- | K | |
| 6.490 | Mg xii ? | 6.497 | Ly- | K | |
| 6.513 | |||||
| 6.545 | |||||
| 6.574 | Mg xii ? | 6.580 | Ly- | K | |
| 6.641 | Si xiii | 6.6477 | K | ||
| 6.681 | |||||
| 6.686 | Si xiii | 6.6879 | K | ||
| 6.713 | Si xii | 6.718 | K | ||
| 6.737 | Si xiii | 6.740 | K | ||
4 The ChemiX Instrument for Interhelioprobe
ChemiX (CHEMical composition In X-rays) is a bent crystal spectrometer under construction that will observe the soft X-ray spectra of solar flares, continuing the objectives of previous spectrometers such as the Flat Crystal Spectrometer and Bent Crystal Spectrometer on Solar Maximum Mission (Acton et al., 1980), SOLEX and SOLFLEX on P78-1 (Doschek, Kreplin, and Feldman, 1979), and RESIK and DIOGENESS on CORONAS-F. We give here a brief description while a more detailed account is in preparation (Siarkowski et al.). ChemiX will have four “spectrometer” channels viewing spectral lines of Fe xxv, Ca xix, S xv, Si xiii and Si xiv, and three pairs of crystals in a dopplerometer arrangement like that on DIOGENESS and its predecessors viewing lines of Fe xxv, Ca xix, and Ar xvii. There will be important improvements over both the RESIK and DIOGENESS instruments in that the detectors will be X-ray-sensitive, cooled (to C.) charged coupled devices (CCDs) and there will be a two-dimensional collimator with arcmin (FWHM) field of view that will enable the instruments to view single active regions and so avoid possible spatial and spectral confusion for the spectrometer channels. A projected 1-s time resolution will allow the highly dynamic impulsive phases of flares to be observed, in particular changes to spectral line profiles and shifts indicative of plasma turbulence and motions. Table \irefchemix_channels gives details of the Bragg-diffracting crystals to be used and the wavelength ranges in each of the seven channels. There will be full spectral coverage in the range Å with a spectral resolution that should be four to ten times better than that of RESIK because of the use of CCDs over gas proportional counters. There will also be much improved signal-to-noise ratio, and because of the use of crystals with low atomic number, there will be very little instrumental background due to crystal fluorescence, enabling the solar continuum to be measurable. Figure \irefChemiX_Doppler_scheme gives the scheme for ChemiX which is under construction at present.
| Channel | Crystal | Diffracting | Wavelength | Av. spectral | |
| No. | plane | (Å) | Range (Å) | resolution | |
| (mÅ per pixel) | |||||
| Spectrometer channels | |||||
| 1 | Si | 111 | 6.271 | 1.500–2.713 | 1.46 |
| 2 | Quartz | 8.514 | 2.700–4.304 | 1.95 | |
| 3 | KDP | 011 | 10.185 | 4.290–5.228 | 1.43 |
| 4 | KAP | 001 | 26.64 | 5.200–8.800 | 4.73 |
| Dopplerometer channels | |||||
| 1 | LiF | 022 | 2.848 | 1.830–1.925 | 0.10 |
| 2 | Si | 111 | 6.271 | 3.150–3.245 | 0.10 |
| 3 | Si | 111 | 6.271 | 3.90–4.080 | 0.19 |


Other subsystems of ChemiX include an energetic particle (electrons, protons, and alpha-particles) detector, so that the instrument will have its own monitor for safety concerns with the electronics; a soft X-ray pin-hole camera with CCD detector, providing X-ray context images with one-arcmin spatial resolution helping to ascertain which active region a flare originated from; and a movable target-pointing platform that can lock the spectrometer and CCDs on to a particular flare or other region within seconds of command from a flare trigger. Spectral atlases consisting of full spectral scans over the entire Å range will be taken while the instrument is directed at particular sources with a user-chosen intensity level (e.g. a total of photon counts over the spectrum). Spectral line and continuum fluxes will be obtained with unprecedented precision, especially when the spacecraft is at perihelion, about 0.3 a.u. from the Sun. Thermal filters over the instrument entrance aperture will prevent solar ultraviolet radiation from entering.
5 Conclusions
The DIOGENESS instrument on CORONAS-F operated for only a few weeks in 2001 but several flares with GOES importance of up to X5 were recorded. Its scanning crystal spectrometers observed the neighbourhood of the He-like Ca, S, and Si (Ca xix, S xv, and Si xiii) X-ray emission lines at 3.17 Å, 5.04 Å, and 6.65 Å, with the two quartz crystals of channels 1 and 4 in a dopplerometer mode, i.e. arranged in such a way that the Doppler line shifts at flare impulsive stages could be separated from spatial shifts. The concept was validated for the X5 flare on 25 August 2001, in which velocities of up to 150 km s-1 were observed. The strong X-ray emission during this flare enabled many lines to be distinguished and identified. The Ca xix lines predominate in channels 1 and 4 spectra, with dielectronic satellites of Ca xviii, Ca xvii, and Ca xvi also present. The spectra are similar to those recorded with the X-ray spectrometer on the P78-1 spacecraft (Doschek, Feldman, and Seely, 1985; Seely and Feldman, 1985), and resemble to a high degree those obtained from the Alcator C-Mod tokamak (Rice et al., 2014), including the Rydberg series of Ar xvii lines which are seen up to in DIOGENESS spectra. In channel 3 and 4 spectra, lines of S xv, Si xiii, and Si xiv predominate, with dielectronic satellites of the Li-like stages occurring.
The ChemiX instrument on the forthcoming Russian Interhelioprobe spacecraft, which will be launched into elliptical orbits around the Sun in 2020 and 2022, will have four channels viewing Fe xxv, Ca xix, S xv, Si xiii, and Si xiv X-ray emission lines, with a full coverage of the Å range. The diffracting crystals will be arranged in a dopplerometer manner as for DIOGENESS but will be bent and non-moving, not flat and scanning. This will be a considerable improvement in that the time resolution should be much higher. Also the use of cooled CCD detectors will give much better spectral resolution over the RESIK spectrometer on CORONAS-F which had position-sensitive proportional counters. A collimator will allow the emission from individual active regions to be observed.
Acknowledgements
We acknowledge support from the Polish National Science Centre grants: 2011/01/B/ST9/05861, 4 T12E 045 29, 2011/01/M/ST9/06096, 2314/7.PR/2012/2 and the European Commission grant FP7/2007-2013: eHEROES, Project No. 284461 We also thank Rutherford Appleton Laboratory (UK) for the provision of the beryl crystal of DIOGENESS, which was a spare crystal from the construction of the Solar Maximum Mission Flat Crystal Spectrometer. The chianti atomic database and code is a collaborative project involving George Mason University, University of Michigan (USA) and University of Cambridge (UK).
References
- Acton et al. (1980) Acton, L.W., Finch, M.L., Gilbreth, C.W., Culhane, J.L., Bentley, R.D., Bowles, J.A., Guttridge, P., Gabriel, A.H., Firth, J.G., Hayes, R.W.: 1980, The soft X-ray polychromator for the Solar Maximum Mission. Sol. Phys. 65, 53. DOI. ADS.
- Bely-Dubau et al. (1982) Bely-Dubau, F., Faucher, P., Steenman-Clark, L., Dubau, J., Loulergue, M., Gabriel, A.H., Antonucci, E., Volonte, S., Rapley, C.G.: 1982, Dielectronic satellite spectra for highly-charged helium-like ions. VII - Calcium spectra: Theory and comparison with SMM observations. MNRAS 201, 1155. ADS.
- Culhane et al. (1991) Culhane, J.L., Hiei, E., Doschek, G.A., Cruise, A.M., Ogawara, Y., Uchida, Y., Bentley, R.D., Brown, C.M., Lang, J., Watanabe, T., Bowles, J.A., Deslattes, R.D., Feldman, U., Fludra, A., Guttridge, P., Henins, A., Lapington, J., Magraw, J., Mariska, J.T., Payne, J., Phillips, K.J.H., Sheather, P., Slater, K., Tanaka, K., Towndrow, E., Trow, M.W., Yamaguchi, A.: 1991, The Bragg Crystal Spectrometer for SOLAR-A. Sol. Phys. 136, 89. DOI. ADS.
- Doschek, Feldman, and Seely (1985) Doschek, G.A., Feldman, U., Seely, J.F.: 1985, Element abundances from solar flare spectra. MNRAS 217, 317. ADS.
- Doschek, Kreplin, and Feldman (1979) Doschek, G.A., Kreplin, R.W., Feldman, U.: 1979, High-resolution solar flare X-ray spectra. ApJ 233, L157. DOI. ADS.
- Doschek et al. (1980) Doschek, G.A., Feldman, U., Kreplin, R.W., Cohen, L.: 1980, High-resolution X-ray spectra of solar flares. III - General spectral properties of X1-X5 type flares. ApJ 239, 725. DOI. ADS.
- Gabriel (1972) Gabriel, A.H.: 1972, Dielectronic satellite spectra for highly-charged helium-like ionlines. MNRAS 160, 99. ADS.
- Oraevsky and Sobelman (2002) Oraevsky, V.N., Sobelman, I.I.: 2002, Comprehensive Studies of Solar Activity on the CORONAS-F Satellite. Astronomy Letters 28, 401. DOI. ADS.
- Parkinson et al. (1978) Parkinson, J.H., Wolff, R.S., Kestenbaum, H.L., Ku, W.H.-M., Lemen, J.R., Long, K.S., Novick, R., Suozzo, R.J., Weisskopf, M.C.: 1978, Silicon X-ray line emission from solar flares and active regions. Sol. Phys. 60, 123. DOI. ADS.
- Phillips et al. (1983) Phillips, K.J.H., Lemen, J.R., Cowan, R.D., Doschek, G.A., Leibacher, J.W.: 1983, Inner-shell transitions in Fe XIX-XXII in the X-ray spectra of solar flares and Tokamaks. ApJ 265, 1120. DOI. ADS.
- Płocieniak et al. (2002) Płocieniak, S., Sylwester, J., Kordylewski, Z., Sylwester, B.: 2002, Determination of wavelengths and line shifts based on X-ray spectra from Diogeness. In: Wilson, A. (ed.) Solar Variability: From Core to Outer Frontiers, ESA Special Publication 506, 963. ADS.
- Rice et al. (2014) Rice, J.E., Reinke, M.L., Ashbourn, J.M.A., Gao, C., Victora, M.M., Chilenski, M.A., Delgado-Aparicio, L., Howard, N.T., Hubbard, A.E., Hughes, J.W., Irby, J.H.: 2014, X-ray observations of Ca19+, Ca18+ and satellites from Alcator C-Mod tokamak plasmas. Journal of Physics B Atomic Molecular Physics 47(7), 075701. DOI. ADS.
- Seely and Doschek (1989) Seely, J.F., Doschek, G.A.: 1989, Measurement of wavelengths for inner-shell transitions in CA XVII-XIX. ApJ 338, 567. DOI. ADS.
- Seely and Feldman (1985) Seely, J.F., Feldman, U.: 1985, Precision measurement of transition energies and Lamb shifts in two-electron argon and potassium in solar-flare spectra. Physical Review Letters 54, 1016. DOI. ADS.
- Siarkowski et al. (2002) Siarkowski, M., Sylwester, J., Plocieniak, S., Kordylewski, Z.: 2002, Flare X-ray spectra observed by Diogenes scanning bragg spectrometer. In: Wilson, A. (ed.) Solar Variability: From Core to Outer Frontiers, ESA Special Publication 506, 753. ADS.
- Sylwester et al. (2014) Sylwester, B., Sylwester, J., Phillips, K.J.H., Kȩpa, A., Mrozek, T.: 2014, Solar Flare Composition and Thermodynamics from RESIK X-Ray Spectra. ApJ 787, 122. DOI. ADS.
- Sylwester et al. (2005) Sylwester, J., Gaicki, I., Kordylewski, Z., Kowaliński, M., Nowak, S., Płocieniak, S., Siarkowski, M., Sylwester, B., Trzebiński, W., Bakała, J., Culhane, J.L., Whyndham, M., Bentley, R.D., Guttridge, P.R., Phillips, K.J.H., Lang, J., Brown, C.M., Doschek, G.A., Kuznetsov, V.D., Oraevsky, V.N., Stepanov, A.I., Lisin, D.V.: 2005, RESIK: A Bent Crystal X-ray Spectrometer for Studies of Solar Coronal Plasma Composition. Sol. Phys. 226, 45. DOI. ADS.
- Tanaka et al. (1982) Tanaka, K., Watanabe, T., Nishi, K., Akita, K.: 1982, High-resolution solar flare X-ray spectra obtained with rotating spectrometers on the HINOTORI satellite. ApJ 254, L59. DOI. ADS.