Evaporation of grain-surface species by shock waves in protoplanetary disk
Abstract
Recent ALMA (Atacama Large Millimeter/submillimeter Array) observations of young protostellar objects detected warm SO emission, which could be associated with a forming protostellar disk. In order to investigate if such warm gas can be produced by accretion shock onto the forming disk, we calculate the sputtering and thermal desorption of various grain surface species in one dimensional shock waves. We find that thermal desorption is much more efficient than the sputtering in the post-shock region. While H2O can be thermally desorbed, if the accretion velocity is larger than 8 km s-1 with the pre-shock gas number density of 109 cm-3, SO is desorbed, if the accretion velocity 2 km s-1 and 4km s-1, with the pre-shock density of 109 cm-3 and 108 cm-3, respectively. We also find that the column density of hydrogen nuclei in warm post-shock gas is cm-2.
1 INTRODUCTION
Volatile elements, such as carbon, nitrogen, oxygen, sulfur, and phosphorus, are important ingredients in the atmosphere and biosphere of planets. Since molecules carrying these elements are readily found in the gas phase and/or ice mantles on dust grains in molecular clouds, the question is if and how they are delivered to protoplanetary disks and then to planets. In our solar system, the relative abundances of volatiles to water in comets are observed to be similar to those in interstellar ice, which suggests that interstellar ice could have been the raw material of the Solar system, at least in comet forming regions (Mumma & Charnley 2011).
In recent years, theoretical models of the chemistry in protostellar cores and in forming disks have been constructed by several groups. As the infall material enters the central regions of protostellar cores, complex organic molecules can be formed via grain-surface reactions on warm grains (Garrod & Herbst 2006; Herbst & van Dishoeck 2009). In spherical symmetric models of a protostellar core, molecules are sublimated at their sublimation temperatures, forming an onion-like distribution of molecular abundances in the envelope (e.g. Rodgers & Charnley 2003; Aikawa et al. 2008, 2012; Visser et al. 2009, 2011). In axisymmetric core models, which can form disks, the temperature distribution is not spherically symmetric, and the chemical composition of an infalling fluid parcel depends on its trajectory; if the fluid parcel experiences only low temperatures, a significant amount of interstellar ice can survive to reach the disk (Visser et al. 2009, 2011; Furuya et al. 2013; Hincelin et al. 2013).
Since the infalling flow is usually supersonic, accretion onto protoplanetary disks is accompanied by a shock wave. The kinetic energy of the bulk flow is converted to thermal energy. While the gas is decelerated by the enhanced pressure at the shock front, the dust grains are not, and they fall into the disk. The dust grains are heated by gas drag and energy transfer from shock heated gas. The ice mantles are thermally sublimated (e.g. Hood & Horanyi 1991; Lunine et al. 1991; Neufeld & Hollenbach 1994) and/or sputtered by collisions with gas particles (e.g. Barlow 1978; Draine & Salpeter 1979; Jiménez-Serra et al. 2008). Lunine et al. (1991) investigated sublimation of volatiles by the drag heating in the primitive solar nebula. They showed that 90 of water ice is sublimated by the drag heating at the radius of 30 AU. The water vapor then re-condenses onto the grain surfaces, because the solar nebula is cold. Neufeld & Hollenbach (1994), on the other hand, performed more general calculations of dense molecular shocks with pre-shock density cm-3 and velocity km s-1. They obtained grain vaporization criteria for various grain materials such as water ice, organic refractory materials, silicate, and iron.
Observational studies on chemistry in these protostellar cores and disk forming stages have made significant progress in the last decades. Various complex organic molecules (COMs) are detected in hot corino sources, such as IRAS16293-2422 (Caselli & Ceccarelli 2012 and references therein), while unsaturated carbon chains such as C4H and c-C3H2 are found in L1527 and IRAS15398-3359 (Sakai et al. 2008, 2009; Sakai & Yamamoto 2013). These emission lines are generally considered to originate in the warm envelope heated by the protostar(s), rather than accretion shock. Sakai et al. (2010) found that c-C3H2 abundance is enhanced in the protostellar envelope at the radius of AU, where the dust temperature reaches the sublimation temperature of CH4. Abundances of COMs in hot corinos are derived by assuming a spherical envelope with radial gradients of density and temperature, although high-resolution observations have found more complex physical structures, such as infall, outflow and binarity (Jørgensen et al. 2007, e.g.; Takakuwa et al. 2007, e.g.; Pineda et al. 2012, e.g.; Zapata et al. 2013, e.g.).
Recently, Sakai et al. (2014) detected SO gas towards L1527. The position velocity diagram (P-V diagram) indicates that SO is located and rotating in a ring region at the centrifugal barrier of radius AU. The temperature ( K) derived from the LVG analysis of SO lines is higher than the estimated sublimation temperature of SO ( K), which indicates that SO is desorbed to the gas phase at this radius. According to the theoretical models of protostellar cores (Aikawa et al. 2012), SO ice could indeed be abundant in infalling material. Sakai et al. (2014) considered three possible desorption mechanisms: accretion shock in front of the centrifugal barrier, outflow shock, and protostellar heating. The compactness of the SO emission and the P-V diagram indicate that the outflow shock could not be the major cause of the enhancement of SO. With regards to the protostellar heating, Tobin et al. (2013) constructed a detailed model of L1527 by solving radiation transfer and considering existing observational data in the infrared and radio wavelengths. The derived temperature at the radius of 100 AU is about 30 K, which is in agreement with the excitation temperature of c-C3H2 ( K) in the infalling gas at AU (Sakai et al., 2014). Although contributions of the outflow shock and protostellar heating are not completely ruled out, the coincidence of the SO emitting region with the centrifugal barrier is most naturally explained by SO desorption via accretion shock. It should also be noted that the SO emission detected towards L1489 IRS shows a similar P-V diagram to that of L1527 (Yen et al., 2014).
If the SO emission is really tracing the accretion shock onto the forming disk, it will have a significant impact on the studies of the physics and chemistry of disk formation. Since the accretion flux is largest around the temporal centrifugal radius (Hartmann 1998), SO emission could be a useful probe of disk formation. Chemical composition of the infall material might be altered at the accretion shock. Although Lunine et al. (1991) predicted that the vapor simply re-condenses in the disk, they did not include chemical reactions in their model. It is thus important to confirm if the warm SO really originates in the accretion shock. On the observational side, high resolution observations of the emission lines are desirable to distinguish which desorption mechanism, accretion shock, outflow shock, or protostellar heating, is responsible for the SO emission around L1527. On the theoretical side, it is useful to investigate the critical condition for SO and other volatiles to be desorbed to the gas phase in the accretion shock.
In this work, we investigate the desorption of volatile species in the accretion shock onto protoplanetary disks. Our goals are twofold: to investigate (1) if the SO emission detected toward L1527 is consistent with an accretion shock model and (2) what other molecules can be detected in the accretion shock. We calculate the physical structure of a one-dimensional J-shock with pre-shock gas density and velocity relevant to disk formation. Then we evaluate the drag heating of grains and a fraction of volatile molecules desorbed to the gas phase via thermal desorption and sputtering. While Neufeld & Hollenbach (1994) investigated a wide range of pre-shock velocity, we concentrate on low pre-shock velocities km s-1 and investigate desorption of various volatile molecules which were not included in Neufeld & Hollenbach (1994), in addition to water. This paper is organized as follows. In §2, we describe our physical and chemical models. In §3, we show the resultant shock structure and the fraction of volatiles sublimated as a function of pre-shock density and velocity. We also evaluate the column density of warm gas in the post-shock region. In §4, we compare our model results with the observation of L1527. Finally, we summarize our results in §5.
2 MODEL
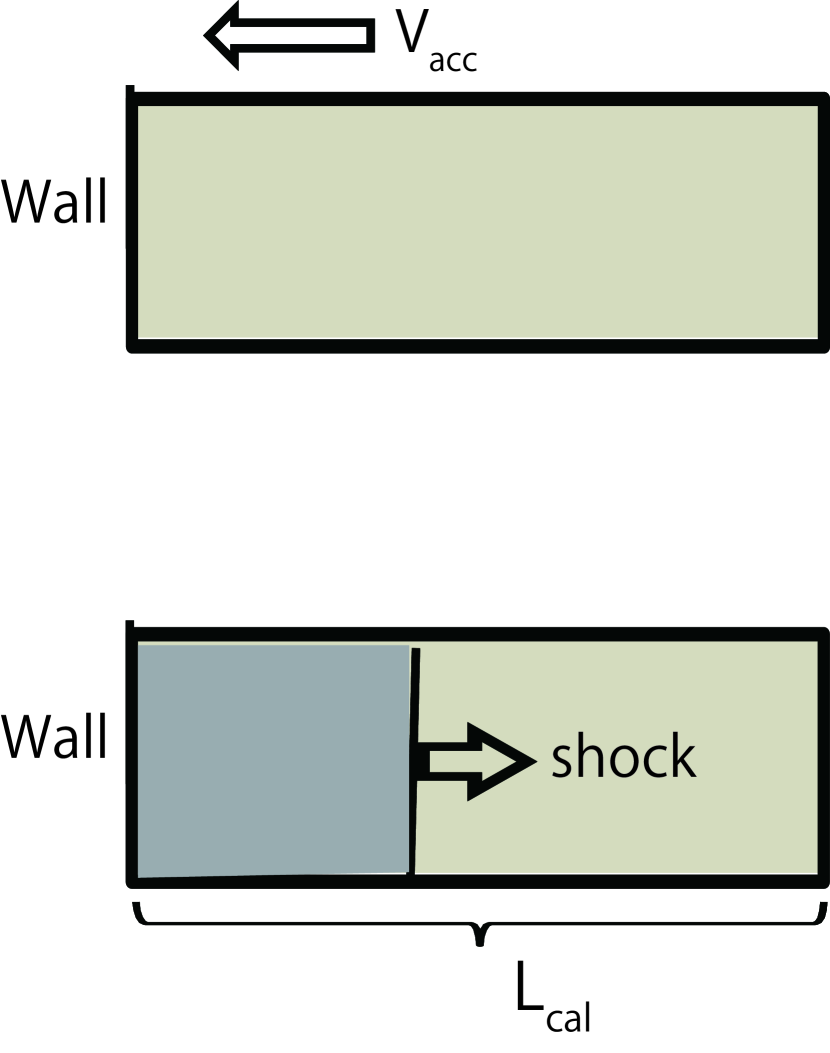
We investigate the accretion shock onto protoplanetary disk using 1D plane-parallel model. Figure 1 schematically shows the configuration of our model. We consider a collision of gas flow with a rigid wall. This configuration also corresponds to the head-on collision between two gas flows with the same density. Our calculations consist of two steps. Firstly, we calculate the physical structure of the shock, i.e. density, temperature, and velocity of the gas. Secondly, we calculate the dust velocity, temperature, and the desorption of ice mantles in the post shock region. We explain the basic equations in the following subsections.
2.1 Structure of 1D Shock
We perform one dimensional hydrodynamic simulations. We solve the conservation of mass, momentum, and energy:
where , , and are the gas mass density, velocity, thermal pressure, ratio of specific heats, and cooling rate per unit mass, respectively. External heating, i.e. the protostellar heating, is not explicitly included in our model. It is, however, implicitly taken into account by setting the initial and minimum gas temperature (see below).
We use an operator-splitting technique to solve these equations, which are split into two parts: (1) ideal hydrodynamics, and (2) cooling (e.g., Inoue & Inutsuka 2008). The former is calculated by the second-order Godunov method with Lagrangian coordinates (Van Leer, 1979). We solve the exact Riemann problem iteratively at each grid cell interface to calculate numerical fluxes, and determine the position of grid cell interface in the next time step. After solving ideal hydrodynamics, the energy equation
is solved by the second-order explicit method.
In this work, we consider high density gas ( cm-3) accreting onto protoplanetary disk. At such high densities, gas is cooled by gas-dust collisional cooling. Referring to Hood & Horanyi (1991), the cooling rate per unit volume is
| (1) |
where , , , and are grain radius, number density of dust grain, Boltzmann constant, and mean mass of gas particle, respectively. In this work, we set = 0.1 m, which is a typical grain radius in interstellar clouds (Tielens 2005), and the mean mass of gas is set to be g. is determined by the balance between heating and cooling: gas-grain energy transfer and cooling by thermal emission of dust (see section 2.2). At this stage, we neglect the relative velocity between gas and dust; the heating rate of dust grains is given by equation (1). The dust temperature derived here is slightly different from the value obtained in section 2.2., where we take into account the gas-dust drag. But the difference is so small that it does not affect the gas temperature. We neglect other cooling mechanisms such as CO rotational cooling, which are less efficient than gas-dust cooling at 107 cm-3.
The time step of the integration is set to be small enough to satisfy the Courant-Friedrichs-Lewy (CFL) condition: , where is the cooling time. In this work, we set the minimum and initial gas temperature to be 20 K. We explore the parameter space of pre-shock number density of hydrogen nuclei and cm-3. We adopt this temperature and these densities for pre-shock gas referring to the recent three dimensional SPH simulation of disk formation and evolution with radiation transfer (Tsukamoto et al. 2013). The assumed initial temperature is slightly lower than the envelope temperature of L1527 derived from the observation of c-C3H2 lines ( K) (Sakai et al. 2014) and from radiation transfer modeling ( K) (Tobin et al. 2013). Our results do not significantly depend on the initial temperature, as long as we are focused on molecules with sublimation temperatures higher than the initial temperature. The accretion velocity ranges from 1 km s-1 to 10 km s-1, which corresponds to the free fall velocity at AU around a Solar mass protostar. These velocities are chosen considering the spatial resolution of ALMA observation. The highest spatial resolution of line observation by ALMA is of order 0.1 arc second. If we consider the nearest star forming regions such as Taurus, the spatial resolution is about 15 AU. Our numerical domain varies from 1.0 pc to 2.0 pc depending on the model parameters (see Table 1). The numerical domain is divided into 450 grid cells with equal intervals. Although our hydrodynamics code is time-dependent, we use it to obtain the steady state structure of 1D shock; we run our code until the flow around the shock front reaches the steady state.
2.2 Dust Velocity and Temperature
While the gas is decelerated by shock, dust particle flows through the gas, and heated by the gas-dust collision. In the 1D steady state shock obtained in §2.1., we calculate dust velocity relative to gas. The equation of motion of dust is
(Hood & Horanyi 1991). We solve the equation of motion by the 4th order Runge-Kutta method. The time step of the integration is set to be . The dust stopping time is
where , , are grain material density, grain velocity relative to the gas flow, and the drag coefficient, respectively. In this work, is set to be 3.0 g cm-3. The drag coefficient () is given by (Hood & Horanyi 1991)
where is the ratio of the relative grain velocity () to the gas thermal velocity ().
The dust temperature is determined by the balance between gas-grain energy transfer rate per dust grain () and cooling rate by thermal emission of dust ():
| (2) |
where and are emission coefficient and Stefan Boltzmann constant, respectively. We adopt the emission coefficient () of silicate model in Draine & Lee (1984) . The adiabatic recovery temperature, , and the heat transfer function, , are
(Hood & Horanyi 1991). In the limit of , the equation (2) is equal to equation (1) (see section 2 of Hood & Horanyi 1991).
2.3 Sputtering and Thermal Desorption
We calculate the desorption rate of grain surface species along the flow of dust particles, using the gas and dust temperatures, gas number density, and the relative velocity of dust to gas obtained in the previous subsections. We calculate the rates of sputtering and thermal desorption separately to investigate which is more effective to desorb grain surface species. When a dust particle of radius is moving with the velocity relative to gas, the sputtering rate of grain surface species per unit volume is
| (3) |
where
(Draine & Salpeter 1979, see also Jiménez-Serra et al. 2008). In Eq. (3), , , and are the number densities of dust surface species , projectile species, and dust grain, respectively. The parameters and represent the projectile kinetic energy of the random motion and the bulk motion relative to a dust grain, normalized by the thermal energy, respectively. The denominator in the right-hand side of Eq. (3) is the summation of number density of dust surface species. The integral term is the average gas velocity relative to dust (see appendix A). The parameter is the angle-averaged sputtering yield
where and are the binding energy and mass of the target species (Draine & Salpeter 1979). Binding energies of molecules onto grain surfaces are adopted from Garrod & Herbst (2006). is 0.8 for ice and 1.0 for atoms on grain surfaces. In this work, we restrict ourselves to desorption of ice, and thus set to be 0.8. Basically, when the kinetic energy of a projectile is larger than , the projectile can sputter dust surface species (see e.g. Barlow 1978; Draine & Salpeter 1979; Draine 1995). The projectiles are gas particles of H2, He and CO.
The thermal desorption rate is given by
(e.g. Tielens 2005). The characteristic vibrational frequency of the dust surface species i is
where cm-2 is the surface density of binding sites.
We adopt the initial abundances of dust surface species from Nomura & Millar (2004) (see Table 2). In this work, we assume that gas-dust mass ratio is 100:1. We also investigate desorption of molecules which are not in Table 2, such as SO. In cases like this, we set their initial abundances to be relative to hydrogen (i.e. 1.8 relative to water ice). The fraction of the sputtered amount over its initial abundance however, does not depend on the initial abundance, as long as the abundance of the dominant ice, H2O, is fixed (see equation (3)). In the following, we show this fraction rather than the absolute abundance of the desorbed species.
3 RESULTS
3.1 Sputtering
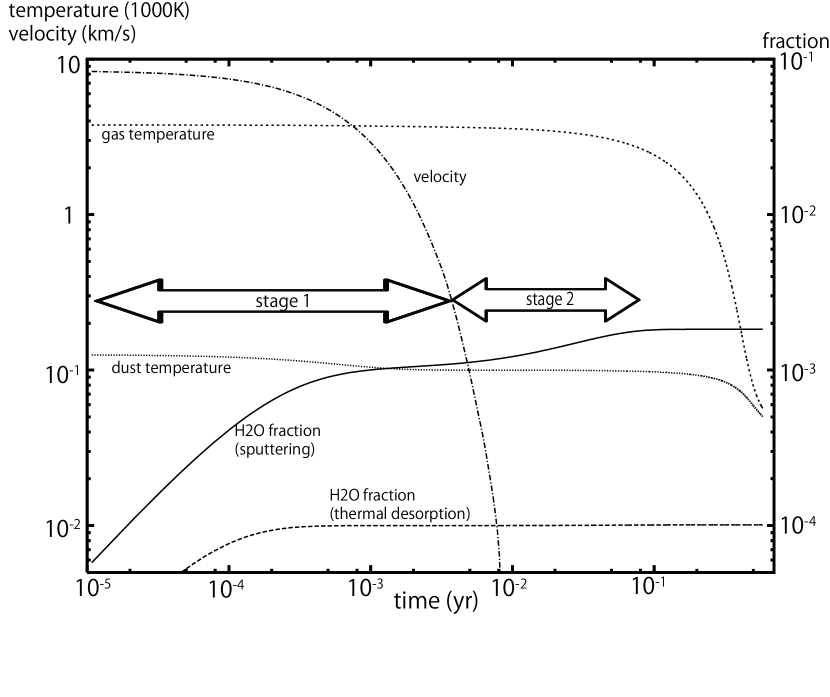
We calculated the amount of molecules desorbed via sputtering by following a dust particle in the 1D shock model. Figure 2 shows the results with pre-shock velocity km s-1 and density cm-3. The gas temperature, dust temperature, and the relative velocity of dust to gas are plotted as a function of time in the coordinate of the dust particle. The moment when the dust particle passes through the shock front is set to in the figure. The solid line depicts the cumulative fraction of sputtered H2O along the flow over the initial H2O ice abundance. Although we do not plot gas density in this figure, it is about cm-3 in the post-shock gas (cf. Landau & Lifshitz 1987) until it increases sharply at yr to keep the pressure constant as the gas cools. We can see that the dust particle is sputtered by the friction between gas and dust until the dust particle is stopped by the gas drag at yr. We call this phase stage 1. After stage 1, the dust particle is sputtered gradually by collisions with hot gas until the gas is cooled in yr (stage 2). When the gas temperature is high, the sputtering in stage 2 is effective in comparison with that in stage 1.
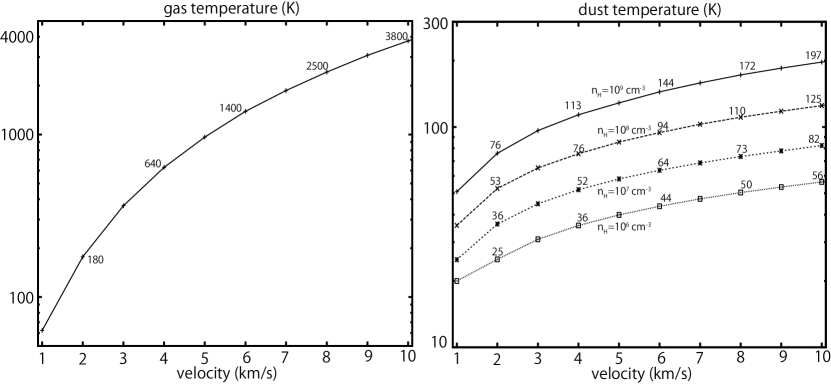
Figure 3 shows the peak temperatures of gas and dust as a function of pre-shock velocity for assorted pre-shock gas densities. The peak gas temperature is determined by the Rankine-Hugoniot relations (Landau & Lifshitz 1987), and does not depend on the pre-shock density. On the other hand, the peak dust temperature is determined by the balance between heating by collisions with gas particles and cooling by thermal radiation (see Appendix B). The dust temperature is higher, when the gas density is higher, because more frequent collisions with gas particles enhance the heating rate.
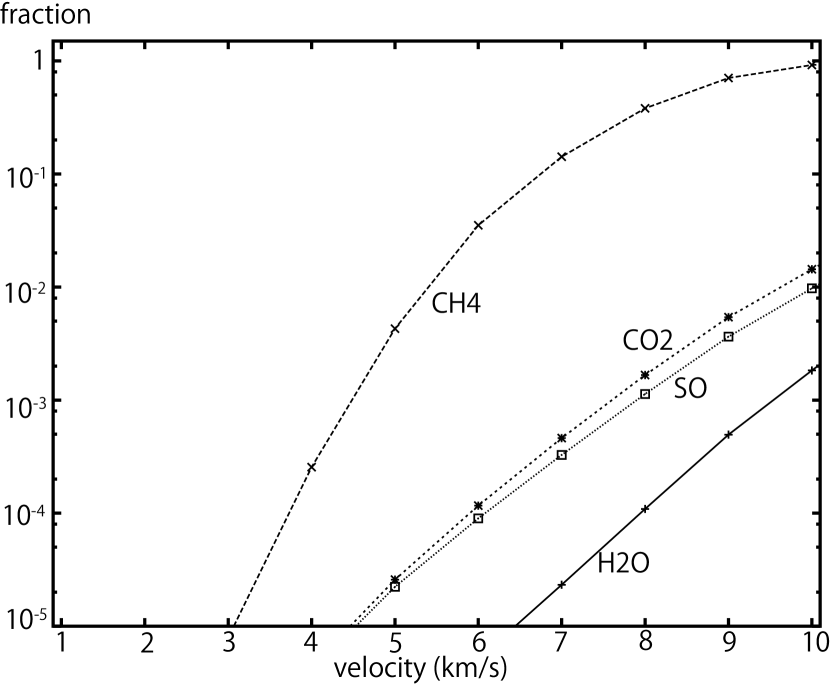
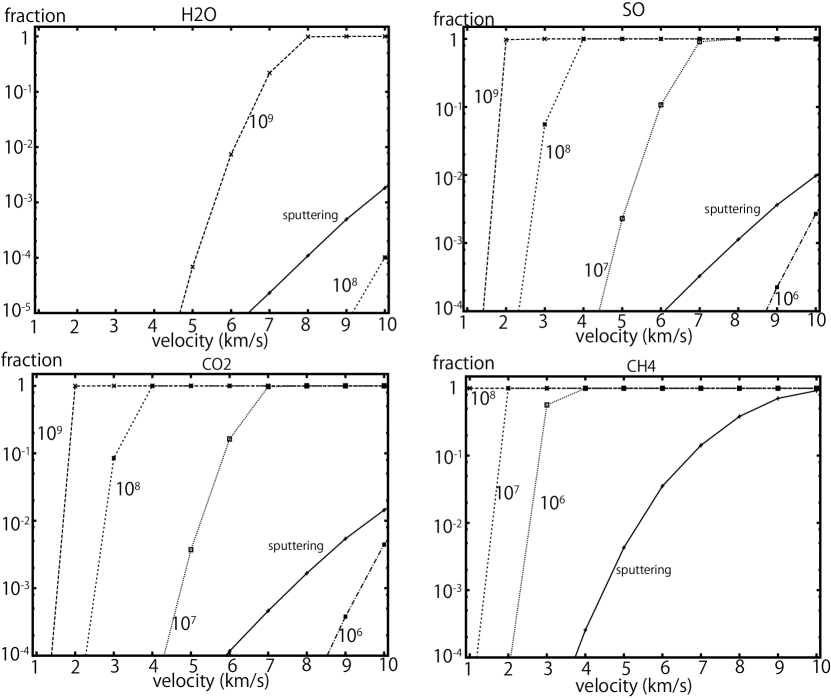
We calculated the fraction of sputtered volatile molecules in various shock models. Figure 4 shows the fraction of sputtered H2O, SO, CO2, and CH4 to their initial ice abundances as a function of the pre-shock velocity with a fixed pre-shock density of cm-3. The binding energies () of the molecules onto grain surfaces are set to be 5700 K for H2O, 2600 K for SO, 2575 K for CO2, and 1300 K for CH4. For example, the fraction of sputtered H2O is only 0.2 when the pre-shock velocity is 10 km s-1. The fraction is similar between SO and CO2, because the binding energy of SO is close to that of CO2. We can see that a highly volatile species like CH4 can be sputtered completely at 10 km s-1. We performed additional calculations covering higher pre-shock velocities to find that H2O can be completely desorbed by the sputtering with km s-1; 10 of H2O is sputtered in stage 1, and the rest is sputtered in stage 2. We speculate however, that our calculation overestimates the amount of sputtered water in such high velocity shocks; the cooling by Ly- and H2 emission, which are not included in our model, could be efficient. A higher pre-shock velocity km s-1 is needed to completely desorb H2O ice by sputtering.
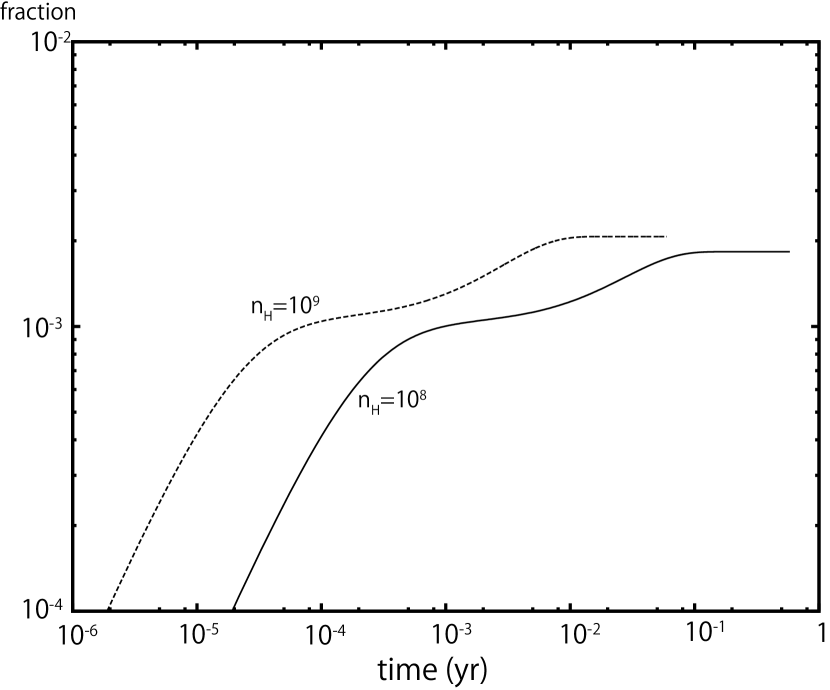
Figure 5 shows the temporal variation of the cumulative fraction of sputtered H2O in models with the pre-shock densities and 109 cm-3. The pre-shock velocity is fixed at km s-1. We can see that the total fraction of sputtered H2O does not depend on pre-shock density, although the sputtering completes earlier in the higher density model. In stage 1, the amount of desorbed species () is proportional to the product of stopping time of dust () and number density (), i.e. . Since the stopping time is proportional to , is independent of . In stage 2, the amount of desorbed species () is proportional to the product of cooling time of shocked gas () and number density (), i.e. . Since the cooling time is proportional to , is again independent of .
3.2 Thermal Desorption
The dashed line in Figure 2 shows the temporal variation of the cumulative fraction of thermally desorbed H2O in the model with cm-3 and =10 km s-1. We can see that the thermal desorption occurs right after the dust particle passes the shock front. The fraction of thermally desorbed H2O is determined by the maximum dust temperature, which is achieved immediately behind the shock front.
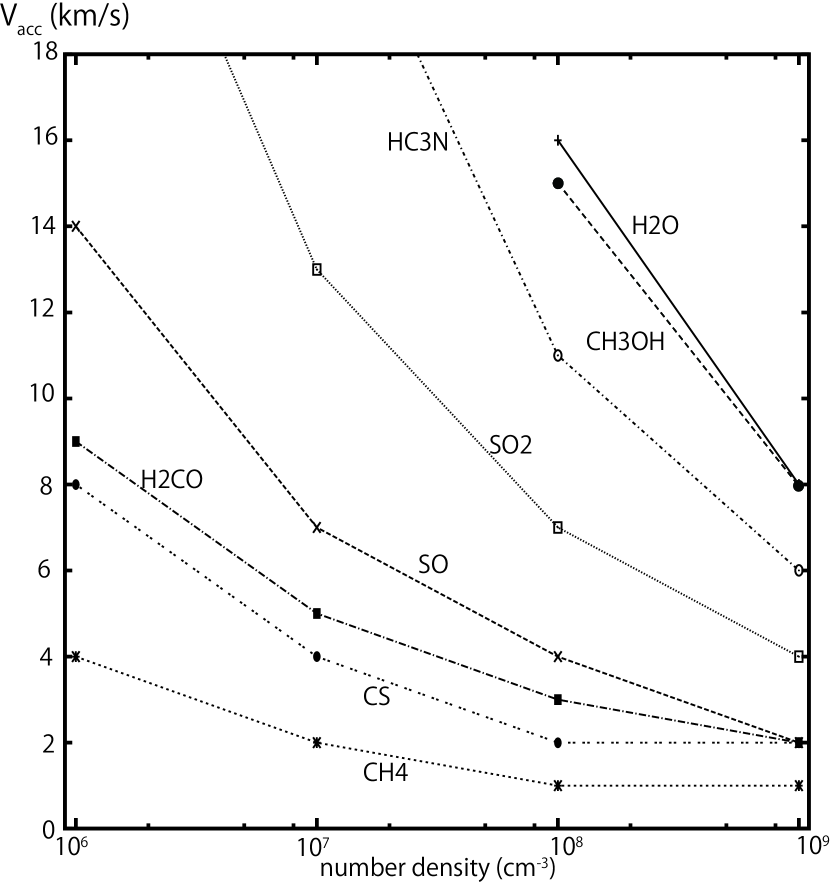
Figure 6 shows the fraction of thermally desorbed H2O, SO, CO2, and CH4 as functions of the pre-shock velocity for assorted pre-shock gas densities. The fraction of sputtered molecules is shown with solid lines for comparison. In most cases, thermal desorption is more effective than sputtering, because the gas number density in our models is high enough to raise the dust temperature in the shock wave (see Appendix B). Figure 7 shows the critical velocity above which the species is completely desorbed. We can see that H2O can be completely desorbed at 8 km s-1, if the pre-shock density is cm-3. This threshold velocity is slightly lower than that obtained by Neufeld & Hollenbach (1994) (10 km s-1), because our binding energy of H2O onto grain surfaces is lower than their value. Except for this small shift in the critical velocity, our result is basically consistent with Neufeld & Hollenbach (1994). We can also see that SO and CO2 can be desorbed at several km s-1 when the preshock gas density is cm-3. The most volatile species in our calculations, CH4, can be desorbed at a lower gas density, i.e. cm-3. In addition to the species discussed above, Figure 7 shows the critical velocities for CH3OH (5534K) HC3N (4580K), SO2 (3405K), H2CO (2050K), and CS (1900K).
3.3 Column Density of Warm Gas
The recent ALMA observation by Sakai et al. (2014) detected warm SO emission towards L1527. The P-V diagram indicates that the warm SO exists in the ring region of radius AU, which may be heated by the accretion shock from the protostellar envelope to the forming protoplanetary disk. In this subsection, we calculate the column density of warm gas produced by the 1D shock. Firstly, it is useful to analytically evaluate the column density of warm gas behind the shock front. When the gas temperature is much higher than the dust temperature, can roughly be estimated to be , where , , and are the number density of pre-shock gas, accretion velocity, and cooling time scale, respectively. The cooling time is
| (4) |
where , , , , and are the post-shock gas pressure, temperature, number density, cooling rate by gas-dust collision per unit volume, and gas-dust mass ratio, which is typically 100 in the interstellar gas (see Tielens 2005). Using the relation between the kinetic energy of the bulk motion in the pre-shock gas and thermal energy in the post-shock gas, we obtain
where is the mass of a gas particle. It is straightforward to derive
We can see that does not depend on the pre-shock gas density.
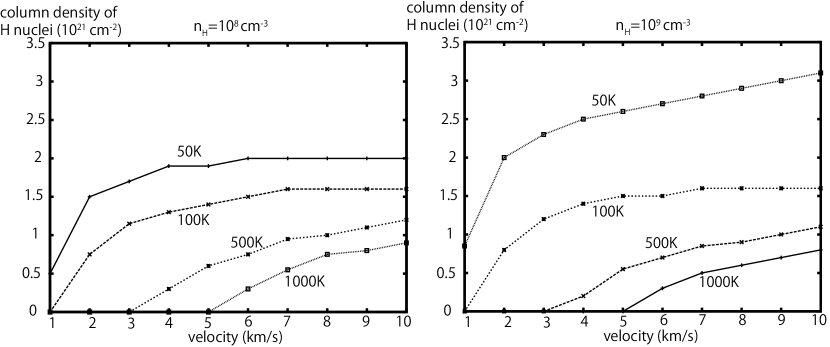
Figure 8 shows the column density of warm gas with a temperature higher than 50, 100, 500, and 1000 K, as a function of pre-shock velocity for pre-shock gas densities of and 109 cm-3. As expected from the analytical estimate, is of the order cm-2. The thickness of the gas, warmer than 100 K is
| (5) |
for a pre-shock velocity 2 km s-1. Dependence of on the pre-shock velocity is weaker than that of , because the post-shock gas density is lower in a lower-velocity shock. The thickness depends on the pre-shock gas density, because the cooling time is shorter at higher densities.
4 Discussion
The radial size of the SO ring around L1527 is about 100 AU. Tobin et al. (2012) estimated the mass of the central protostar to be M⊙ by fitting the gas velocity at AU with the Keplerian rotation. Ohashi et al. (2014), on the other hand, found that the power-law index of the rotation profile () is (i.e. indicative of the infall with rotation) at AU, while it is shallower () at inner radius. If the rotation profile at AU is due to the Kepler motion, the mass of the central star is M⊙. The star is more massive, if the Keplerian disk is smaller. Observations with higher angular resolution are desirable to confirm the size of the Keplerian disk and the mass of the central star. Here, let us assuming that the mass of the central star is M⊙. Then the free-fall velocity at 100 AU is about 2 km s-1. The gas density in the envelope is not well constrained in the observations, but the density of cm-3 is consistent with the model of L1527 by Tobin et al. (2013). Our 1D shock model shows that the desorption of SO is possible with km s-1, when the pre-shock gas density is cm-3.
So far we have assumed that the binding energy of SO is 2600 K, which is for water-dominated ice (Garrod & Herbst, 2006). The binding energy however, varies with composition and structure (e.g. crystal or amorphous) of the ice mantle. In Hasegawa & Herbst (1993), the binding energy of SO is estimated to be 2000 K by the summation of van der Waals interaction of the molecule with the grain surface. If we adopt this lower value, the gas density required to desorb SO is slightly lower than cm-3. The high gas density needed for desorption of SO via the accretion shock is actually consistent with the model by Sakai et al. (2014); the P-V diagram of c-C3H2 is reproduced by the accretion of the rotating envelope in the equatorial plane.
The molecules with higher binding energies such as H2O and CH3OH are difficult to desorb with V km s-1. In our model, CO2, C2H2, CCS, CH2PH, CH3CHO, H2CN, H2CS, H2S, NO2, and OCN have similar binding energies to SO. They can be detected in the SO ring, if they are abundant in the ice in the protostellar envelope.
With km s-1 and cm-3, the column density of warm gas several tens of K is cm-2. According to the chemical models of protostellar cores (e.g. Wakelam et al. 2011; Aikawa et al. 2012), SO ice is one of the major carriers of sulfur. If the SO ice abundance in the envelope is , which is possible, the column density of warm SO is cm-2. Sakai et al. (2014) derived SO temperature 60 K and a column density cm-2. We can conclude that the SO emission around L1527 is consistent with the 1D J-shock.
Although the geometry of the accretion shock might be more complicated than the 1D shock, the model predicts that the warm SO layer would be geometrically thin (equation (5)). When the post-shock gas is cooled, SO will again be absorbed onto grain surfaces in yr, if the protostellar heating is not high enough to desorb SO. Since the absorption timescale is longer than the cooling timescale (equation (4)), we also expect a layer of cold SO gas inside the warm SO ring. The geometrical thickness of the cold SO layer however, depends on the density and velocity structures inside the ring.
5 SUMMARY
In this work, we calculate the efficiency of sputtering and thermal desorption of grain surface species in 1D shock with pre-shock gas densities cm-3 and velocities km s-1. We compare our results with the recent observation of warm SO emission around the young protostellar core L1527 to investigate if such emission could originate in the shock as the gas accretes on the forming protoplanetary disk. Our findings are as follows
-
•
The thermal desorption is more effective than the sputtering in the accretion shock onto a protoplanetary disk, because of the high gas density.
-
•
We derived the parameter range of gas density and velocity with which volatiles, such as H2O and SO, are desorbed to the gas phase. For example, SO is thermally desorbed in the shock with km s-1, if the gas density is higher than cm-3, while the sputtering is negligible at cm-3 .
-
•
We show that the column density of warm gas K in the post-shock region is cm-2. It only weakly depends on the pre-shock density and velocity, as long as the gas-dust collision is the main cooling mechanism in the post-shock gas.
-
•
The temperature and column density of SO estimated from the observation are consistent with the accretion shock from the envelope onto the forming protoplanetary disk.
Appendix A The Mean Velocity of Gas Particles Colliding on a Grain
We consider a spherical dust grain with radius moving in the direction with velocity relative to gas. Using the Maxwellian velocity distribution function in the coordinate system of a grain, mean gas velocity can be expressed as
where and are the polar and azimuthal angle in the velocity space (). Using the equations of and , we integrate the above equation over (0 ) and ( ). It is straightforward to derive the mean velocity
where and are defined as and .
Appendix B Dust Temperature
We consider a spherical dust grain with radius moving with velocity relative to the gas of mass and number density . When the dust collides with a gas particle, the kinetic energy of the gas particle is given to the dust grain. The collision frequency of a dust particle with gas particles is . The dust cooling rate by thermal radiation per unit surface area is . We assume that the dust is in thermal equilibrium; the heating rate is equal to the cooling rate
We adopt for a grain with m (Draine & Lee 1984; Tielens 2005). For simplicity, we assume that all the gas particles are hydrogen molecules (H2), which means g and . It is straightforward to derive
We can see that it is difficult to raise the dust temperature in the shock wave when the number density of gas is low; i.e. cm-3.
References
- Aikawa et al. (2008) Aikawa, Y., Wakelam, V., Garrod, R. T., & Herbst, E. 2008, ApJ, 674, 984
- Aikawa et al. (2012) Aikawa, Y., Wakelam, V., Hersant, F., Garrod, R. T., & Herbst, E. 2012, ApJ, 760, 40
- Boley et al. (2006) Boley, A. C., Mejia, A. C. Durisen, R. H., et al. 2006, ApJ, 651, 517
- Boley & Durisen (2008) Boley, A. C., Durisen, R. H. 2008, ApJ, 685, 1193
- Boss (2008) Boss, A. P. 2008, ApJ, 677, 607
- Barlow (1978) Barlow, M. J. 1978, MNRAS, 183, 367
- Caselli & Ceccarelli (2012) Caselli, P. & Ceccarelli, C. 2012, A&ARv, 20, 56
- Draine (1995) Draine, B. T. 1995, Ap&SS, 233, 111
- Draine & Lee (1984) Draine, B. T., & Lee, H. M. 1984, ApJ, 285, 89
- Draine & Salpeter (1979) Draine, B. T. & Salpeter, E. E. 1979, ApJ, 231, 77
- Draine, Roberge & Dalgarno (1983) Draine, B. T., Roberge, W. G., & Dalgarno, A. 1983, ApJ, 264, 485
- Flower & Pineau des Foréts (2010) Flower, D. R., & Pineau des Foréts, G. 2010, MNRAS, 406, 1745
- Furuya et al. (2013) Furuya, K., Aikawa, Y., Nomura, H., Hersant, F., & Wakelam, V. 2013, ApJ, 779, 11
- Furuya & Aikawa (2014) Furuya, K. & Aikawa, Y. 2014, ApJ, 790, 97
- Garrod & Herbst (2006) Garrod, R.T., & Herbst, E., 2006, A&A, 457, 927
- Hartmann (1998) Hartmann L., Accretion Processes in Star Formation, 1998, Cambridge University Press
- Hasegawa & Herbst (1993) Hasegawa, T. I., & Herbst, E. 1993, MNRAS, 263, 589
- Heinzeller et al. (2011) Heinzeller, D.; Nomura, H.; Walsh, C., & Millar, T. J. 2011, ApJ, 731, 115
- Herbst & van Dishoeck (2009) Herbst, E., & Van Dishoeck, E. F. 2009, ARA&A, 47, 427
- Herczeg et al. (2012) Herczeg, G.J., Karska, A., Kristensen, L.E., van Dishoeck, E.F., Jørgensen, J.K., Visser, R., Wampfler, S. F., Bergin, E.A., Yıldiz, U.A., Pontoppidan, K.M. & Gracia-Carpio, J. 2012, A&A 540, 84
- Hincelin et al. (2013) Hincelin, U., Wakelam, V., Commercon, B., Hersant, F., & Guilloteau, S. 2013, ApJ, 775, 44
- Hollenbach & McKee (1989) Hollenbach, D., & McKee, C. F. 1989, ApJ, 342, 306
- Hood & Horanyi (1991) Hood, L. L., & Horanyi, M. 1991, Icarus, 93, 259
- Ilee et al. (2011) Ilee, J. D., Boley, A. C., Caselli, P., et al. 2011, MNRAS, 417, 2950
- Inoue & Inutsuka (2008) Inoue, T. & Inutsuka, S. 2008, ApJ, 687, 303
- Jiménez-Serra et al. (2008) Jiménez-Serra, I., Caselli, P., Martín-Pintado, J., & Hartquist, T. W. 2008, A&A, 482, 549
- Jørgensen et al. (2007) Jørgensen, J.K., Tyler, B.L., Myers, P.C., Di Francesco, J., van Dishoeck, E.F., Lee, C.-F., Ohashi, N., Schöier, F.L., Takakuwa, S., Wilner, D.J. & Zhang, Q. 2007, ApJ, 659, 479
- Landau & Lifshitz (1987) Landau, L. D. & Lifshitz, E.M. 1987, Fluid Mechanics, (Oxford; Butterworth-Heinemann)
- Lunine et al. (1991) Lunine, J. I., Engel, S., Rizk, B., & Horanyi, M. 1991, Icarus, 94, 333
- Mumma & Charnley (2011) Mumma, M. J. & Charnley, S. B. 2011, ARA&A, 49, 471
- Neufeld & Dalgarno (1989) Neufeld, D. A., & Dalgarno, A. 1989, ApJ, 340, 869
- Neufeld & Hollenbach (1994) Neufeld, D.A., & Hollenbach, D. J. 1994, ApJ, 428, 170
- Ohashi et al. (2014) Ohashi, N., Saigo, K., Aso, Y., Aikawa, Y., Koyamatsu, S., Machida, M.N., Saito, M., Takahashi, S.Z., Takakuwa, S., Tomida, K., Tomisaka, K., & Yen, H.-W. 2014, ApJL, in press
- Pineda et al. (2012) Pineda, J. E., Maury, A. J., Fuller, G. A., et al. 2012, A&A, 544, 7
- Rodgers & Charnley (2003) Rodgers, S. D., & Charnley, S. B. 2003, ApJ, 585, 355
- Sakai et al. (2008) Sakai, N., Sakai, T., Hirota, T. & Yamamoto, S. 2008, ApJ, 672, 371
- Sakai et al. (2009) Sakai, N., Sakai, T., Hirota, T., Burton, M. & Yamamoto, S. 2009, ApJ, 697, 769
- Sakai et al. (2010) Sakai, N., Sakai, T., Hirota, T. & Yamamoto, S. 2010, ApJ, 722, 1633
- Sakai & Yamamoto (2013) Sakai, N. & Yamamoto, S. 2013, Chemical Reviews, 113, 8981
- Sakai et al. (2014) Sakai, N., Sakai, T., Hirota, T. et al. 2014, Nature, 507, 78
- Takakuwa et al. (2007) Takakuwa, S., Ohashi, N., Bourke, T. L., Hirano, N., Ho, P. T. P., Jørgensen, J. K., Kuan, Y.-J., Wilner, D. J., Yeh, S. C. C. 2007, ApJ, 662, 431
- Tielens (2005) Tielens, A.G.G.M. 2005, The Physics and Chemistry of the Interstellar Medium (Cambridge University Press)
- Tobin et al. (2013) Tobin, J. J., Hartmann, L., Chiang, H-F. et al. 2013, ApJ, 771, 48
- Tobin et al. (2012) Tobin, J. J., Hartmann, L., Chiang, H.-F., Wilner, D. J., Looney, L. W., Loinard, L., Calvet, N., D’Alessio, P. 2012, Nature, 492, 83
- Tsukamoto et al. (2013) Tsukamoto, Y., Machida, M. N. & Inutsuka, S. 2013, MNRAS.436, 1667
- Van Leer (1979) Van Leer, B. 1979, J. Comput. Phys., 32, 101
- Visser et al. (2009) Visser, R., van Dishoeck, E. F., Doty, S. D., & Dullemond, C. P. 2009, A&A, 495, 881
- Visser et al. (2011) Visser, R., Doty, S. D., & van Dishoeck, E. F. 2011, A&A, 534,132
- Wakelam et al. (2011) Wakelam, V., Hersant, F., & Herpin, F. 2011, A&A, 529, 112
- Walsh et al. (2010) Walsh, C., Millar, T. J., & Nomura, H. 2010, ApJ, 722, 1607
- Walsh et al. (2012) Walsh, C., Nomura, H., Millar, T. J., & Aikawa, Y. 2012, ApJ, 747, 114
- Walsh et al. (2013) Walsh, C., Millar, T. J., & Nomura, H. 2013, ApJ, 766, 23
- Watson et al. (2007) Watson, D.M., Bohac, C.J., Forrest, W.J., Najita, J., Calvet, N., d’Alessio, P., Hartmann, L., Sargent, B., Green, J.D., Kim, K.H. & Houck, J.R. 2007, Nature 448, 1026
- Willacy (2007) Willacy, K. 2007, ApJ, 660, 441
- Yen et al. (2014) Yen, H.-W., Takakuwa, S., Ohashi, N., Aikawa, Y., Aso, Y., Koyamatsu, S., Machida, M. N., Saigo, K., Saito, M., Tomida, K., Tomisaka, K. 2014, ApJin press
- Zapata et al. (2013) Zapata, L. A., Loinard, L., Rodriguez, L. F. et al. 2013, ApJ, 764, 14
| (cm-3) | (pc) |
|---|---|
| 1.0 | |
| 1.5 | |
| 2.5 | |
| 2.0 |
| Species | Abundance | Species | Abundance |
|---|---|---|---|
| H2 | 0.5 | H2S | 1.0 10-7 |
| He | 0.1 | OCS | 5.0 10-8 |
| H2O | 2.8 10-4 | Si | 3.6 10-8 |
| CO | 1.3 10-4 | PH3 | 1.2 10-8 |
| H | 5.0 10-5 | S | 5.0 10-9 |
| N2 | 3.7 10-5 | C2H4 | 5.0 10-9 |
| CO2 | 3.0 10-6 | C2H5OH | 5.0 10-9 |
| H2CO | 2.0 10-6 | C2H6 | 5.0 10-9 |
| O2 | 1.0 10-6 | Fe+ | 2.4 10-8 |
| NH3 | 6.0 10-7 | H | 1.0 10-9 |
| C2H2 | 5.0 10-7 | H+ | 1.0 10-11 |
| CH4 | 2.0 10-7 | He+ | 2.5 10-12 |
| CH3OH | 2.0 10-7 |