ASTRO-H Space X-ray Observatory
White Paper
Chemical Evolution in High- Universe
M. S. Tashiro (Saitama University), D. Yonetoku (Kanazawa University),
M. Ohno (Hiroshima University), H. Sameshima (JAXA),
H. Seta (Saitama University), H. Ueno (Saitama University),
T. Nakagawa (JAXA), T. Tamura (JAXA),
F. Paerels (Columbia University), N. Kawai (Tokyo Institute of Technology),
on behalf of the ASTRO-H Science Working Group
Complete list of the ASTRO-H Science Working Group
Abstract
In this paper, we demonstrate ASTRO-H’s capability to measure the chemical evolution in the high- universe by observing X-ray afterglows of gamma-ray bursts (GRBs) and distant Blazars. Utilizing these sources as background light sources, the excellent energy resolution of ASTRO-H/SXS allows us to detect emission and absorption features from heavy elements in the circumstellar material in the host galaxies, from the intergalactic medium (IGM) and in the ejecta of GRB explosions. In particular, we can constrain the existence of the warm-hot intergalactic material (WHIM), thought to contain most of the baryons at redshift of , with a typical exposure of one day for a follow-up observation of a GRB afterglow or 300 ks exposure for several distant Blazars. In addition to the chemical evolution study, the combination of the SGD, HXI, SXI and SXS will measure, for the first time, the temporal behavior of the spectral continuum of GRB afterglows and Blazars over a broad energy range and short time scales allowing detailed modeling of jets. The ability to obtain these data from GRB afterglows will depend critically on the availability of GRB triggers and the capability of ASTRO-H to respond rapidly to targets of opportunity. At the present time it seems as if Swift will still be functioning normally during the first two years of ASTRO-H operations providing the needed triggering capability.
1 Background and Previous Studies
In the optical and near IR, deep Hubble and ground based observations has revealed the formation and evolution of galaxies up to (Bouwens et al., 2010) allowing constraints on the star formation rate over the last 13 Gyrs of cosmic time. While the star formation rate is directly connected to the chemical evolution of the universe, one must make assumptions about the initial mass function, the types of supernova that have exploded and the yields of the SN to directly relate star formation to chemical production. Direct measurement of the abundance of the elements at high redshifts is thus critical but has proven to be difficult, except for a few high signal to noise optical observations of the host galaxies of gamma-ray bursts. Somewhat surprisingly present day observations of the high redshift IGM has shown little evidence for chemical evolution.
Based on models of galaxy formation, the relative population of massive stars is thought to increase in the high- universe and the rate of type Ia supernova is thought to be lower than those of type II. These assumptions can be checked via measurement of the FeII / MgII ratio. However, no clear evidence of chemical evolution in FeII / MgII ratio has been detected and there is a fairly large scatter in this ratio seen in the high redshift universe (De Rosa, 2011).
X-ray observations, in contrast to optical and IR observations, can determine the abundances in massive systems such as clusters and groups of galaxies and, potentially, in the dominant baryonic reservoir at , the hot ionized intergalactic medium. In the last two decades, there has been extensive analysis of the abundances in the hot intra-cluster medium (ICM) at , showing little if any evolution; but the data at higher redshifts are rather poor. However, despite of ASTRO-H’s high sensitivity compared with the previous X-ray mission, it will require very long observations to measure cluster chemical abundances at high redshifts.
In this white paper we show the possibility of measuring the chemical evolution of the universe beyond utilizing bright background light sources such as Blazars and X-ray afterglows of gamma-ray bursts (GRBs). Since the X-rays are absorbed by primarily K shell electrons, we can measure not only cold neutral gas but also the expected warm-hot intergalactic medium (WHIM) and the hotter ICM with X-ray absorption features. Thus the X-ray spectra will measure not only the local intra-galactic medium around these sources but also the global chemical environments in the high- universe.
A significant detection of the WHIM has been one of critical observational issues in high energy astrophysics, since it should provide a solution to the “missing baryon problem”. At , the local baryon density calculated from summing up well- observed baryons (viz. stars, neutral atomic gas, molecular gas and X-ray emitting hot gas) is for (Fukugita et al., 1998), which is much less than the value expected from Big Bang nucleosynthesis, according to the WMAP and Planck observations of the cosmic microwave background and what is seen in the high- universe. Thus there must be a large amount of, so far, undetected baryons in the local universe consistent with theoretical studies such as that of Cen & Ostriker (2006) whose cosmological hydrodynamic simulations, find that % of all baryons are in the WHIM at . This implies that the majority of the missing baryons are hidden in the warm-hot material. Therefore it is critical to detect it and determine its physical properties. The WHIM is expected to be filamentary, shock-heated IGM created during the formation of large-scale structure. Cen & Ostriker (2006) showed that the mass fraction of WHIM increases from % at to % at .
For recent decades, several detections of WHIM in the X-ray spectra of blazars have been reported using Chandra/LETG or XMM-Newton/RGS (Fujimoto et al., 2004; Williams et al., 2006; Takei et al., 2007; Rasmussen et al., 2007, e.g.). Most of these detections either low statistical significance or cannot confirmed with independent observations, except for some exceptions focusing IGM associated with known signpots of superclusters (Buote et al., 2009; Ren et al., 2014). The difficulty in evaluating possible line absorption structures is mainly because one has to search the entire sightline to rule out statistical fluctuations (Kaastra et al., 2006).
By observing the IGM over a wide range of redshifts, ASTRO-H might play a crucial role in solving the missing baryon problem. It is believed that the WHIM has so far escaped significant detection because of the lack of a high throughput, high resolution X-ray spectrometers and thus is match to ASTRO-H’s capabilities, since it is very difficult for it to be detected at other wavelengths or by low resolution X-ray spectrometers. In addition, the ASTRO-H’s high resolution spectroscopy over a wide energy range covering iron features, would be powerful to identify the WHIM distinguishing from hotter intra-group or intra-cluster medium in the line of sight. Should this search be successful or if sensitive upper limits are obtained, it will be a strong observational constraint on the mass fraction and chemical evolution of WHIM and thus provide strong impacts on cosmological models and star formation histories.
2 Prospects & Strategy
GRB afterglows and Blazars are ideal sources to search for absorption due to distant material thanks to their bright structureless continuum, with no intrinsic spectral features and their high redshift. To determine the chemical composition of the absorbing material in the line of sight, it is crucial to resolve the fine spectral structures of the edges, resonant lines, and emission lines to determine the redshift and their ionization state. It is reasonable to lay a cornerstone in the performance verification phase to evaluate following systematic study of chemical evolution in the high- universe.
The prospects of scientific results and the strategy for the ASTRO-H early phase observations in this field are:
Investigate the WHIM along the line of sight to well chosen z 1 – 3 objects :
We propose to employ GRB afterglows and distant Blazars, in order to survey the WHIM in the distant universe, By measuring the redshifts and ionization state of the intervening gas, we may reveal the missing baryons and their properties. The expected range of the redshift of the spectral features will be as discussed in following subsections.
Investigate ISM and eject of Hypernovae with emission features in GRB afterglows:
In addition to the expected absorption features of the IGM, we can also search for emission features from local dense ISM associated with the GRB and from ejecta in GRBs afterglow emission.
2.1 GRB afterglows
The progenitor of the “long” duration GRB is thought to be due to the core collapse of a massive star (Woosley, 1993). Although the redshift distribution of GRBs ranges up to (Jakobsson et al., 2006), the peaking of the distribution is observed around . Since their radiation energy (of the order of erg s-1) is times larger than those of normal core-collapse supernovae, it is widely accepted that the radiation from GRB emissions is produced in highly relativistic jets pointing at the observer. The extreme Lorentz factor of requires a rare type of supernovae as the GRB progenitor.
The tightly beamed high intensity intrinsically featureless emission makes the GRB an ideal background light for irradiating intervening matter in the high- universe. However, somewhat surprisingly, the X-ray spectra of high redshift GRBs show evidence for significant absorption in excess of the Galactic foreground. the origin of this absorption is not well understood. This absorption is often attributed to the gas in the host galaxy, since the majority of long GRBs are associated with the deaths of massive stars and often lie in active star forming regions which are associated with dense gas. If the nature of these star forming regions are similar, the apparent column density of the X-ray absorbing material should (corrected for the redshift of the source) be roughly constant with redshift. However, detailed analysis Campana et al. (2010), Behar et al. (2011), Watson & Jacobsson (2012), and Starling et al. (2013),shows that many high redshift bursts exhibiting high intrinsic absorption beyond that seen in lower redshift objects. Behar et al. (2011) proposed that the X-ray flux from distant objects such as GRB afterglows and distant Blazars inevitably suffers absorption from the IGM in addition to possible absorption in the host galaxies. Following Behar et al. (2011), Starling et al. (2013) recently showed that moderately metal enriched and warm gas with an estimated ionization parameter with is a viable expalnation for the observations of the high redshift high column density X-ray absorption, where the , , and are the luminosity, electron number density, and distance of the ionized plasma from the light source. This WHIM like absorber exhibits a relatively flat optical depth with redshift in the soft X-ray band which seems to compensate for the expected decrease of optical depth at the observer rest frame. These papers clearly showed that X-ray spectoscopic studies of GRB afterglows are quite promising method to investigate the IGM at high redshift. However, in the absence of sensitive high resolution spectroscopy, it is impossible to conclusively determine the nature of absorbers and their locations especially for the redshift distributions. The spectral resolution of absorption features is the key to determining their chemical abundance, ionization state and physical origin. This is undoubtedly one of the frontiers for ASTRO-H to pioneer.
In addition to the diffuse IGM, the expected dense circumstellar medium (CSM) associated with the GRB progenitor may produce heavy elements atomic lines and/or edges in the afterglow spectrum. So far, the best evidence for such features as been in the Fe-K band. Marginal evidence for iron features has been claimed in several X-ray afterglows (Piro et al., 1999; Yoshida et al., 1999; Piro et al., 2000). They, however, are still controversial, not only due to the limited statistics but also for the rather tight upper limits in other afterglows (Yonetoku et al., 2000).
Almost 100 % of GRBs are followed by the bright X-ray afterglows while only % show the detectable optical counter parts. One of the reason for the lack of optical emission is caused by the absorption in the host galaxies of GRBs. Thus these optically dim bursts should show strong X-ray absorption signatures making X-ray observations of GRB X-ray afterglows a serious contender for detailed ASTRO-H observations.
2.2 Distant Blazars
Blazars are active galactic nuclei in which the photon emission is dominated by a relativistic jet pointing toward observers, and their energy spectra has less intrinsic spectral features. While Blazars are the most luminous AGN, they are not as instantaneously bright as X-ray afterglow of GRBs. But their activities last much longer than GRBs, and we must enable to perform continuous observations with longer exposures. Deep ASTRO-H observations of Blazars are promising prospects to search for intergalactic absorption features in their spectra.
Although the intrinsic Blazar spectrum is thought to be a featureless continuum, there were some reports of the detection of absorption spectral features in the X-ray of several Blazars. Using the Einstein Observatory, Krolik et al. (1985) first reported line-like absorption features in the soft X-ray spectra of the Blazar PKS 2155304. Following this discovery, a number of authors have searched for absorption features in Blazar X-ray spectra, and there are several claims of narrow absorption lines originating in the IGM, utilizing the Chandra and XMM-Newton grating spectrometer observations of low redshift () Blazars(e.g. Nicastro et al., 2005). However the existence of these features are still controversial (Kaastra et al., 2006).
Besides the narrow absorption features, Behar et al. (2011) utilizing CCD data carried out a systematic estimation of the excess absorption in Blazar spectra. With their direct measurement of optical depth toward a large sample of Blazars, they showed that foreground diffuse IGM dominates the absorption in high redshift Blazar spectra as well as in GRB afterglows. This result, together with the claimed line absorption features, hints at the existence of the long sought spectral features from the WHIM. Although the redshift and temperature of the absorber have not been accurately determined, due to the limited energy resolution of the CCD spectrometers, the detection of such features with the high energy resolution and high throughput instruments onboard ASTRO-H, will allow the redshift, temperature and chemical abundance of the suggested intrinsic absorption to be accurately measured.
3 Targets & Feasibility
3.1 Origin of Excess of Soft X-ray Absorption
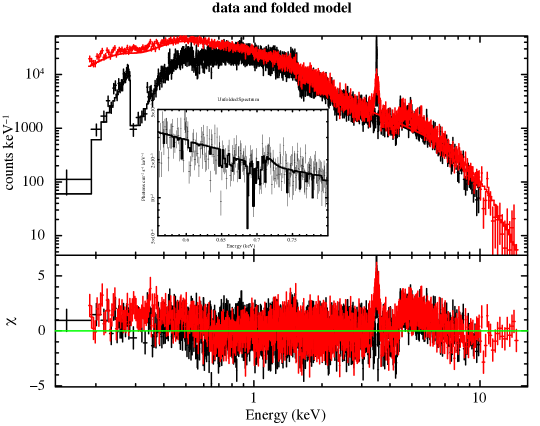
As in § 2.1, an excess of absorption in soft X-ray band against to the local Galactic value was reported in several papers e.g. Behar et al. (2011) and Starling et al. (2013). Interestingly, the observed absorption column density continuously increases with the redshift of GRBs, which is inconsistent with the simple scenario that the absorption is mainly due to the host galaxy of GRBs. Therefore, those authors suggest that this excess absorption is due to intergalactic material (IGM). Starling et al. (2013) showed that the absorption is consistent with it being due to an ionized absorber (the WHIM) with a temperature of 105-6 K and ionization parameter of . The estimated excess absorption column density has a mean value of 1022 cm-2 per unit redshift. Following Starling et al. (2013), we simulated absorption this material using XSTAR with parameters of (gas temperature of 105 K, column density of 1022cm-2, and the heavy elemental abundance of 0.2), and placed at a redshift of 0.1 and with the background continuum due to a near and bright GRB afterglow.
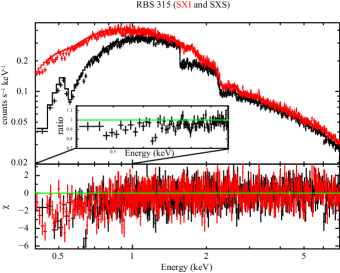
A 100ks exposure of a GRB in which we used as inputs the results of 1 for GRB 991216 (as summarized in Table 1) clearly exhibits detections of absorption lines, associated with Fe and oxygen ions around 0.686 and 0.695 keV in observer frame with significance level. In order to show the sensitivity of the SXI and the SXS to the ionization state of the intervening gas we also show the residuals from an alternative model — single power-law with absorption by a cold-neutral material — in the bottom panel of the figure. In addition to these absorption features, we also simulated emission features reported in Piro et al. (2000) but assumed relatively narrow line case ( eV). Detailed discussion on the emission features are described in section 3.2. Such emission line features are clearly detected even for flux level of erg cm-2 s-1. Figure 1 right shows the 100 ks observation of the same afterglow. . The possibility of ASTRO-H observing such a bright GRB afterglow is discussed in detail in § 3.4.
3.2 Constrain Progenitor Model and Environment of GRBs by Fe-K Line and Recombination Edge
Spectral emission features in GRB afterglows are a powerful tool to investigate the circumstellar environment of GRBs. As described in § 2.1, GRB progenitors could be rare type of supernovae. Piro et al. (2000) reported the detection of an Fe-K line feature and a radiative recombination edge in the afterglow spectrum of GRB 991216 at 4 confidence level. They showed that, utilizing the central energy of Fe-K line and radiative recombination edge, we can determine the redshift of the GRB as well as provide an estimation of the ejecta mass from the supernova.
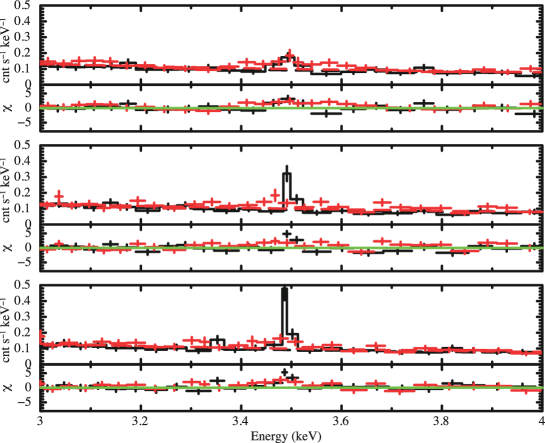
In order to examine the feasibility, of detecting a similar set of spectral features, we simulated the Piro et al. (2000) et al data, assuming a power-law with Fe-K line and recombination edge and parameters. Yonetoku et al. (2000) estimated an upper limit of Fe-K line equivalent width (EW) using ASCA data of GRB 990123 and set it to be 100 eV. Accordingly, here we assumed the EW of 50 eV.
Measurement of the line width provides crucial information for understanding the physics of the ejecta of the GRB progenitor. Piro et al. (2000) claimed a line width eV, but the observational evidence for the width of Fe-K line is not strong due to the energy resolution of the CCD data. The high resolving power of Fe-K line of SXS is much more sensitive than previous instruments for detecting weak narrow Fe-K lines. In Figure 2, we show the results of simulating Fe-K line emission with the SXS based on the spectra of GRB 991216. A weak Fe-K line is detectable by SXS at 5.3 for 5 eV width and 4.8 for 10 eV width for a nominal GRB spectrum. Such a feature is not detectable with CCD spectral resolution.
3.3 Soft X-ray Lines from GRB Afterglow
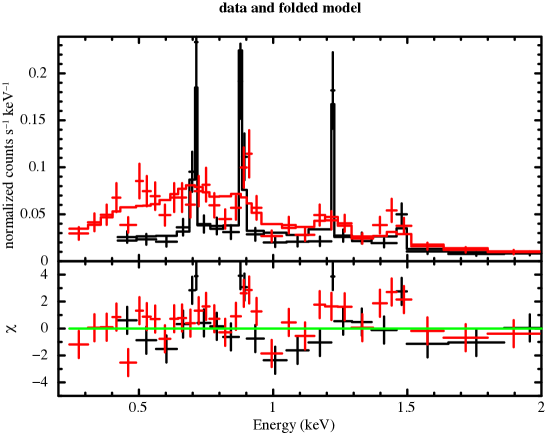
In addition to the iron features, emission lines from other light elements are important in probing the environment of the progenitor of GRBs. There have been a few claimed detections of emission lines due to Mg, Si, S, Ar, and Ca in some GRB spectra (Reeves et al., 2002; Watson et al., 2003). However these results have not been confirmed in recent Swift data (Hurkett et al., 2008). Accurate and significant detection and measurement of the soft X-ray lines with ASTRO-H SXS/SXI, is needed to confirm the existence of such features and their use as indicators of chemical evolution in the high- universe.
We examine the feasibility of detecting the soft X-ray lines with ASTRO-H. In these simulations, we calculated the SXS/SXI spectra assuming the reported spectral parameters but doubled the X-ray flux. Since these ISM origin features might be illuminated for a short time, we assumed the exposure time of 10 ks in this simulation. As we can see in the figure, the soft X-ray line features are clearly visible by ASTRO-H observation with significance. In this spectral simulation, we assume a line width of 5 eV, since no significant line broadening was reported in the previous observation.
3.4 Expected Number of Events of GRB Afterglow by Astro- H
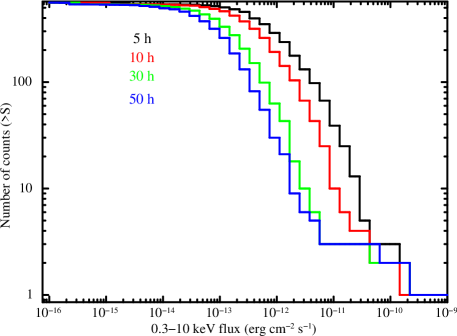
As we showed in previous sections, ASTRO-H has a capability of detecting any spectral features such as Fe-K lines, recombination edge, other lines from light metals, and of course absorption by warm intervening materials. In this section, we estimate the expected number of GRBs in which ASTRO-H can detect these spectral features. For this estimation, we calculate the luminosity function of X-ray afterglow based on Swift/XRT data base which is publicly available in the web site111http://www.swift.ac.uk/xrt_curves.
First, we fit every XRT light curve in the 6-year data base with a simple power-law function of time from the GRB trigger time. We then summarized each afterglow flux of time in “the cumulative luminosity function” as we showed in Figure 4. Finally, we compared the flux level of simulated spectra in the § 3.1 and 3.2 with the estimated luminosity function (Figure 4). According to the simulations as previously shown, in the case of Fe-K line emission and recombination edge, the flux level of erg cm-2 s-1 are required to constrain the iron spectral features (in case of GRB 991216, 37 hours after the GRB trigger. The expected event rate is about 3.3events per year. On the other hand, in the case of our simulation for detection capability of weak Fe-K line, we assumed very bright afterglow with the flux level of 10-11 erg cm-2 s-1. Such flux level at late times is rare with 1 event per year 10 hours after the trigger and 0.3 event per year for 30 hours after the trigger.
In the case to observe the soft X-ray lines, the simulated flux is roughly about erg cm-2 s-1 level at 11 hours after the GRB trigger the expected event rate is about 16 events per year. In conclusion, we reasonably expect ASTRO-H to able to observe soft X-ray emission lines from GRB afterglows with an event rate of a few per year, even if it takes one day to slew the spacecraft. But we need to slew within 10 hours after GRB trigger, to detect Fe-K line and edge features with event rate of at least one event per year. A follow-up within 10 hours is possible indeed, since ASTRO-H has a slew speed of over minutes. However, a dedicated operation team for the quick follow-up operation is required as the Suzaku GRB follow-up team which succeeded carried out four times of quick follow-up observations within a few hours. At this moment, ASTRO-H team has not decided to organize the quick follow-up observation team.
Table 2 summarizes feasibility of GRB observation by ASTRO-H.
| Flux level | event rate per year |
|---|---|
| 50 hours / 30 hours ( 1 day) / 10 hours ( half day) | |
| 10-11 erg cm-2 s-1 | 0.5 / 0.5 / 1 |
| 10-12 erg cm-2 s-1 | 3 / 10 / 33 |
3.5 Distant Blazar spectral simulation of absorption features by IGM
Based on their redshift and flux, we have selected four Blazars among the object exhibiting significant excess absorption listed in Table 1 of Behar et al. (2011). Each of four has a 2 – 10 keV flux brighter than erg cm-2 s-1 and redshift higher than 2 as summarized in Table 3. In this section, we show the simulated spectrum and the results of evolution, utilizing the same XSTAR based WHIM model as employed for GRB afterglows in § 3.1 for the representative Blazar RBS 315, at a redshift of .
| target name | redshift | fluxc | reference | ||
|---|---|---|---|---|---|
| PKS | 3.366 | 4.92 | 1.80 | 1.10 | Fiore et al. (2003) |
| RBS 315 | 2.690 | 9.26 | 2.90 | 1.08 | Tavecchio et al. (2007) |
| PKS | 2.345 | 1.61 | 0.08 | 1.00 | Bianchin et al. (2009) |
| 4C 71.07 | 2.172 | 2.85 | 0.09 | 1.40 | Malizia et al. (2000) |
a: Galactic column density in the unit of H cm-2
b: Intrinsic column density in the unit of H cm-2
c: Observed 2–10 keV flux in the unit of erg cm-2s-1
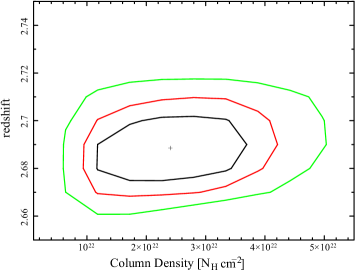
We show the ASTRO-H capability in determining the redshift of the possible absorber in Figure 5. All the simulated spectra shown here assumes the exposure time of 300 ks. Thanks to the excellent energy resolution of the SXS crucial for determining the absorption edge energy together with the large effective area for the SXI to determine the optical depth, we see that ASTRO-H will be able to resolve the absorption line structure to determine the redshift with X-ray spectrum.
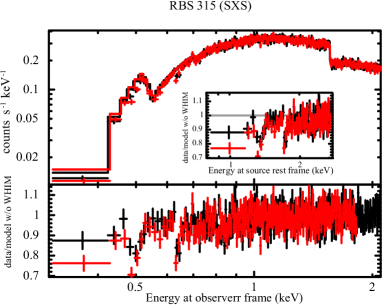
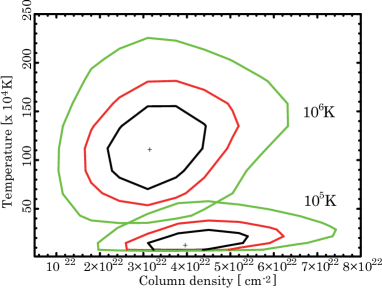
In Figure 6, we show that the SXS has a capability to measure the temperature of the warm-hot plasmas. The signature of the excess absorption is clearly seen in the data to model ratios, where we removed the intrinsic WHIM absorption model from the model denoted with histogram in Figure 6. In the ratios, we see clear absorption lines due to: SiVII-XI at 0.48 keV (1.8 keV at rest frame), SVIII-XIII at 0.64 keV (2.4 keV at rest frame), and ArX-XII at 0.81 keV (3.0 keV at rest frame), as well as we see in the inset indicated with energy at the source (WHIM) rest frame. In addition, the difference of temperature of WHIM is seen in the lowest energy bin in the ratios. We also show the confidence contours for the two different temperature WHIM. In the right panel of Figure 6, we clearly see that ASTRO-H/SXS determines the WHIM temperature with reasonable accuracy.
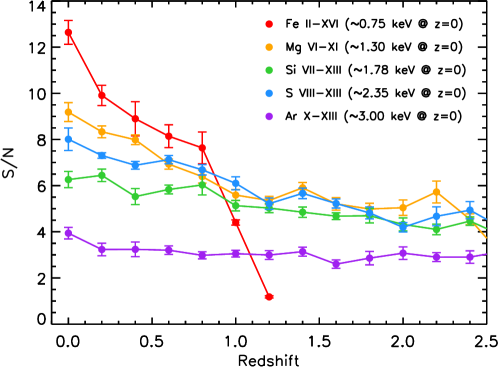
We assumed the WHIM at the same redshift frame with the source and demonstrate that SXS with SXI are able to determine the column density and the temperature. Then we simulated the WHIM at various redshift frame from to to investigate expected significance of each spectral features of elements. Figure 7 shows the signal to noise ratios of absorption lines of Fe, Mg, Si, S, or Ar of the WHIM at each redshifts. The assumed WHIM temperature is K and other parameters were the same as described above. All elements but Ar are to be detected with the significance of at any redshift between 0 and 2.5. Moreover WHIM in the range of , in which large portion of the WHIM are expected (section 1), the expected significance fairly exceeds 5 or more.
Since the intrinsic Blazar exhibits featureless spectrum, every bright distant Blazar is a potential target to search for the intervening WHIM and/or other absorption materials. Many of these sources have strong flaring episodes and are monitored by MAXI and Swift and thus are candidates for ToO observations. In addition to those Blazars listed in table 3, a number of Blazars in the redshift range from have a high X-ray flux erg cm-2 s-1 in hard X-ray band (Tüller et al., 2010; Ghisellini et al., 2011). For example, we could add Blazars Swift J1656.33302, [HB89] 0212+735, or [HB89] 0836+710 for their expected high flux in the SXS band. However, neither Swift J1656.33302 sitting behind the Galactic center region nor 0836+710 exhibiting rather low intrinsic absorption are suitable for the early phase target to explore the WHIM. The rest 0212+735 could be added the target list to be monitored, although the uncertainty of the reported intrinsic absorption are fairly large in comparison with RBS 315 discussed above.
4 Additonal Science — hard X-ray observations of Blazar and GRB Continua
As intensive follow up observations with Swift have revealed, most of GRB afterglows experience a series of decay phases, such as a steep decay, a shallow decay, a normal decay and a jet decay phase after the jet break (Nousek et al., 2006). Assuming that follow-up observation start – 60 hours after the burst, as discussed in § 3.4, it should be possible to observe the jet decay phase in hard X-rays. Since the jet break is thought to be caused by deceleration of a shocked shell in the GRB jet, such measurements will scan the shock shell from small to large radius as the beaming factor decreases after the jet break via measuring the curvature of the continuum using a wide band spectrum as a function of time. In other words, observing the jet break is a scanning observation of the shock front, since the beaming factor of the emission region decreases dramatically during the jet break decays. This will provide an excellent chance to resolve the GRB jet internal structure by utilizing the wide band ASTRO-H X-ray data.
While the Suzaku/HXD has observed four GRB afterglows a few hours after the GRB prompt emissions, it did not accurately measure the hard X-ray spectra because of its limited sensitivity. The HXI, however, with a two orders of magnitude higher sensitivity, will be able to observe the hard X-ray spectrum as well as the soft X-ray instruments (SXI/SXS), as far as the follow up observation by ASTRO-H is carried out.
The HXI and SGD data will precisely determine the continuum shape of the afterglow, which increases the accuracy of column density measurement discussed above.
References
- Behar et al. (2011) Behar, E., Dado, S., Dar, D., Laor, A. 2011, ApJ, 734, 26
- Bianchin et al. (2009) Bianchin,V. et al. 2009, A&A, 496, 423
- Boettcher et al. (1999) Boettcher, M., Dermer, C.D.D., Crider A.W., Liang, E.D. 1999, A&A, 343, 111
- Bouwens et al. (2010) Bouwens, R. J. et al. 2010, ApJ, 709, L133
- Buote et al. (2009) Buote, E., Zappacosta, L., Fang, T. et al. 2009, ApJ, 695, 1351
- Campana et al. (2010) Campana, S., Thöne, C.C., de Ugarte Postigo, A., et al. 2010, MNRAS, 402, 2429
- Campana et al. (2012) Campana, S., et al., 2012, MNRAS, 410, 1611
- Cen & Ostriker (2006) Cen, R.& Ostriker, J. P., 2006, ApJ, 650, 560
- Cucchiara et al. (2013) Cucchiara, A., Prochaska, J. X., Zhu, G., et al. 2013, ApJ, 773, 82
- Chugai et al. (2004) Chugai, N.N., et al. 2004, MNRAS, 352, 1213
- Fujimoto et al. (2004) Fujimoto, R., Takei, R., Tamura, T. et al. 2004, PASJ, 56, L29
- Fiore et al. (2003) Fiore, F., et al., 2003, A&A, 409, 57
- Fukugita et al. (1998) Fukugita, M., et al. 1998, ApJ, 503, 518
- De Rosa (2011) De Rossa et al. 2011, ApJ, 739, 56
- Ghisellini et al. (2011) Ghisellini et al. 2011, MNRAS, 411, 901
- Hurkett et al. (2008) Hurkett et al. 2008, ApJ 679, 587
- Jakobsson et al. (2006) Jakobsson, P. et al. 2006, A&A, 447, 897
- Kaastra et al. (2006) Kaastra, J. S., Werner, N., den Herder, J. W. A., et al. 2006, ApJ, 652, 189
- Krolik et al. (1985) Krolik, J.H., Kallman, T.R., Fabian, A.C., Rees, M.J., 1985, ApJ, 295, 104
- Malizia et al. (2000) Malizia, A., et al. 2000, ApJ, 531, 641
- Mészáros et al. (1998) Mészáros, P., Rees, M.J. 1998, MNRAS, 299, L10
- Nicastro et al. (2005) Nicastro, F., Mathur, S., Elvis, M. et al. 2005, ApJ 629, 700
- Nousek et al. (2006) Nousek, J. A., Kouveliotou, C., Grupe, D., et al. 2006, ApJ, 642, 388
- Perna & Loeb (1998) Perna, R.& Loeb, A. 1998, ApJ, 501, 467
- Piro et al. (2000) Piro, L. et al. 2000, Science, 290, 955
- Piro et al. (1999) Piro, L., et al. 1999, ApJ, 514, L73
- Rafelski et al. (2012) Rafelski, M., Wolfe, A. M., Prochaska, J. X. et al. 2012, ApJ, 755, 89
- Rasmussen et al. (2007) Rasmussen, A. P., Kahn, S. M., Paerels, F. et al. 2007, ApJ, 656, 129
- Reeves et al. (2002) Reeves, J. N. et al. 2002, Nature, 416, 512
- Reeves et al. (2003) Reeves, J. N. et al. 2003, A&A, 403, 463
- Ren et al. (2014) Ren, B., Fang, T., & Buote, D. A. 2014, ApJ, 782, L6
- Savaglio (2012) Savaglio, S. 2012, Astron. Nachr., 333, 480
- Savaglio (2009) Savaglio, S. 2009, Proc. IAU Symp., 265, 119
- Schlegel (1990) Schlegel, E.M. 1990, MNRAS, 244, 269
- Shimizu et al. (2012) Shimizu, T., Masai, K., Koyama, K. 2012, PASJ, 64, 24
- Starling et al. (2013) Starling, R.L.C., Willingale, R., Tanvir, N.R., et al. 2013, MNRAS, 431, 3159
- Takei et al. (2007) Takei, Y., Henry, J. P., Finaguenov, A., et al. 2007, ApJ 655, 831
- Tavecchio et al. (2007) Tavecchio, F., et al. 2007, ApJ, 665, 980
- Tüller et al. (2010) Tüller, J. et al. 2010, ApJS, 186, 378
- Tominaga et al. (2007) Tominaga, N. et al. 2007, ApJ, 660, 516
- Watson et al. (2003) Watson, D., et al. 2003, ApJ, 595, L29
- Watson & Jacobsson (2012) Watson, D., & Jacobsson, P., 2012, ApJ, 754, 89
- Williams et al. (2006) Williams, R. J., Mathur, S., Nicastro, F., & Elvis, M., 2006, ApJ, 642, L95
- Woosley (1993) Woosley, S.E. 1993, ApJ, 403, 273
- Yoshida et al. (1999) Yoshida, A., et al. 1999, Proc. of “Gamma-ray bursts in the afterglow era” (eds. Frontera & Piro), (A&AS, 138), 433
- Yonetoku et al. (2000) Yonetoku, D., et a. 2000, PASJ, 52, 509 625