k=0 magnetic structure and absence of ferroelectricity in SmFeO3
Abstract
SmFeO3 has attracted considerable attention very recently due to the reported multiferroic properties above room-temperature. We have performed powder and single crystal neutron diffraction as well as complementary polarization dependent soft X-ray absorption spectroscopy measurements on floating-zone grown SmFeO3 single crystals in order to determine its magnetic structure. We found a k=0 G-type collinear antiferromagnetic structure that is not compatible with inverse Dzyaloshinskii-Moriya interaction driven ferroelectricity. While the structural data reveals a clear sign for magneto-elastic coupling at the Néel-temperature of 675 K, the dielectric measurements remain silent as far as ferroelectricity is concerned.
The discovery of magnetism induced ferroelectricity has renewed the interest on multiferroic materials due to the enhanced magnetoelectric interaction in these materials that makes them very interesting for technical applications allg ; allgB . Recently, it has been found, that ferroelectricity can arise from some special types of magnetic structures inducing sizeable magnetoelectric effects and the ability to switch the electric polarization by an applied magnetic field (and vice versa). In these recently studied materials magnetic frustration induces a complex magnetic structure with cycloids or spirals allg . However, also the ordering temperatures need to be above room-temperature in order to make these materials interesting for technical applications. Very recently, the discovery of ferroelectric polarization in SmFeO3 has been reported below 670 K. The origin of this ferroelectric polarization is highly debated smoA ; smoB ; smoC . A further spin-reorientation transition occurs at 480 K in this material without having any noticeable effect on the ferroelectric polarization. In the initial publication an inverse Dzyaloshinskii-Moriya interaction based mechanism has been reported to be the driving force of the ferroelectric properties of SmFeO3 smoA . The underlying k=0 magnetic structure was not directly measured but calculated by ab initio calculations smoA . However, it has been demonstrated that this calculated k=0 magnetic structure with magnetic ions located at inversion centers can not be responsible for a spin-orbit-coupling driven ferroelectric polarization by Si Sj in this material since inversion symmetry will not be broken smoB . Within this context, an alternative mechanism based on Si Sj exchange-striction has been proposed to be responsible for the ferroelectric polarization in SmFeO3 smoC .
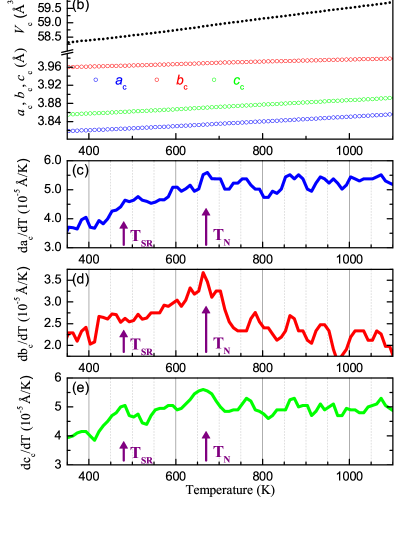
Here, we report the experimentally observed magnetic structure of SmFeO3 and re-analyze the ferroelectric properties of SmFeO3. A large reddish SmFeO3 single crystal with 675 K has been grown at a Crystal systems Corp. 4-mirror optical floating zone furnace. The high sample quality of this insulating reddish orange single crystal has been confirmed by EDX, Laue and X-ray diffraction techniques as well as by magnetization and Mössbauer spectroscopy measurements, see the Supplementary Materials suppl . In the inset of Fig. 1 (a) a polarization microscope image is shown that indicates - together with our Laue diffraction analysis - that our SmFeO3 crystals are single domain single crystals. No impurity phases are visible in highly accurate synchrotron radiation powder X-ray diffraction measurements that have been performed at beamline B2 of DORIS-III at DESY. The lattice parameters, unit cell volume and relative expansion of the lattice parameters of SmFeO3 (Pbnm setting with ) are shown in Figs. 1 (a,b). The -lattice parameter exhibits a small anomalous kink around that is indicative for magneto-elastic coupling at the magnetic ordering temperature . The other lattice parameters exhibit much less pronounced anomalies at that are even only barely visible in the derivatives of the lattice parameters, see Figs. 1 (c-d).
The highly neutron absorbing properties of the element Sm (5900 barn for 2200 m/s neutrons) hampered the experimental determination of the magnetic structure of SmFeO3. Here, we present two complementary neutron measurements where we were able to overcome these obstacles and measure the magnetic structure of SmFeO3 directly. First, we have performed powder neutron diffraction measurements at comparably low neutron energies (=1.8857Å) with a special sample geometry at the HRPT diffractometer (SINQ). We were able to overcome the highly neutron absorbing properties of Sm by filling the outer volume of a hollow vanadium cylinder with a special mixture of fine SmFeO3 powder that we ”diluted” with fine aluminum powder in order to suppress the Sm absorption effects. As can be seen in Fig. 2 we obtained qualitatively good powder neutron diffraction patterns at 300 K, 515 K and 720 K that could be easily refined with two additional phases of Al and V which do not interfere at all with the SmFeO3 magnetic signal and even barely with structural contributions. Therefore, a reliable Rietveld refinement of the magnetic structure of SmFeO3 could be performed.
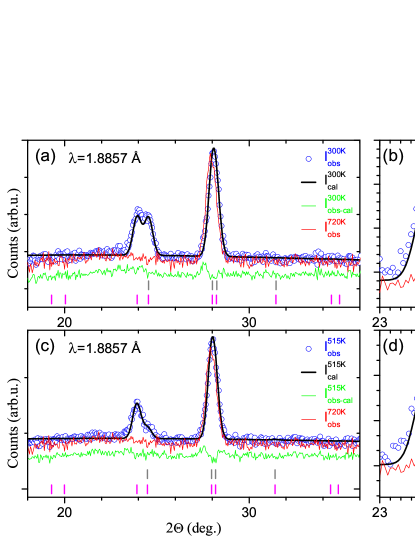
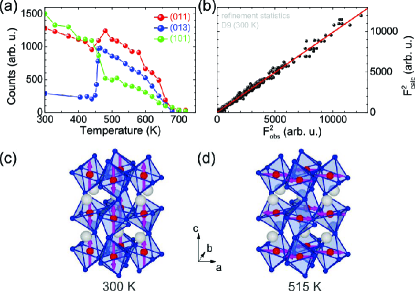
Since we measured only at temperatures above room-temperature, we neglected any Sm ordering SmOrdering . As pointed out in great detail in Ref. smoB there are four different irreducible representations , , and corresponding to the following four spin configurations for the Fe ordering: AxGyCz, GxAyFz, FxCyGz and CxFyAz which correspond to the magnetic space groups Pbnm, Pb’n’m, Pbn’m’ and Pb’nm’ respectively Bertaut . Our neutron measurements at 300 K, 515 K and 720 K clearly show that there appears FxCyGz-type and GxAyFz-type antiferromagnetic ordering in SmFeO3 at 300 K and 515 K respectively. The Rietveld fits of the magnetic intensities are shown in Fig. 2 and the corresponding magnetic moments are listed in Table I within the Supplementary Materials suppl . Other spin configurations or incommensurate magnetic structures can be excluded for SmFeO3. We have also performed complementary single crystal neutron diffraction measurements. By choosing an optimized small sample geometry and high incident neutron energies we were able to perform single crystal neutron diffraction measurements at the D9 diffractometer (ILL). The temperature dependence of some prominent magnetic intensities are shown in Fig 3 (a) visualizing the spin-reorientation transition. The atomic positions derived from this measurement are very close to the atomic positions derived from a complementary single crystal X-ray diffraction measurement that has been performed on a Bruker D8 VENTURE X-ray diffractometer as well as with values given in literature elec , thus, proving the high reliability of our neutron measurements, see Table I within the Supplementary Materials suppl . The comparably good refinement statistics and R-values of the structure refinement of this single crystal neutron measurement are shown in Fig. 3 (b) and Table I within the Supplementary Materials suppl . Finally, we were able to determine the magnetic structure of SmFeO3 and observe a collinear k=0 antiferromagnetic structure, see Fig. 3 (c,d). The detection of very tiny canted magnetic moments is beyond the scope of these measurements. As pointed out in Ref. smoB for SmFeO3 (with magnetic ions located at inversion centers), k=0 magnetic structures are not compatible with an inverse Dzyaloshinskii-Moriya interaction induced electric polarization.
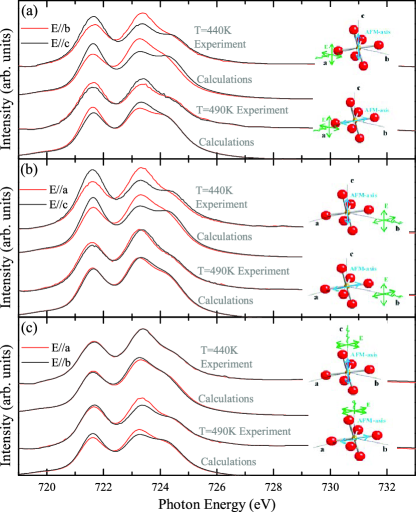
The antiferromagnetic properties of SmFeO3 were also studied by linear polarization dependent Fe-L edge X-ray absorption spectra (XAS), conducted at 08B beam line of the National Synchrotron Radiation Research Center (NSRRC) in Taiwan. The spectra were recorded with the total electron yield mode using Fe2O3 for calibration. X-ray magnetic linear dichroism (XMLD) is the difference in cross section for light polarized perpendicular or parallel to the magnetic moment and is well known to be sensitive to the spin direction of AFM systems xmcdA ; xmcdB ; xmcdC . We have measured the polarization dependent Fe-L2 XAS spectra at 440 K and 490 K with the Poynting vector of the light being parallel to the -, - and -axis shown in Fig. 4 (a-c). We observe a considerable size of the XMLD signals between the electric field and in Fig. 4 (a), between and in Fig. 4 (b), but nearly no difference between and in Fig. 4 (c). The sign of the XMLD signals is reversed when going from 440 K to 490 K, see Fig. 4(a-b). This is similar to the previous study of the Morin transition of Hematite xmcdA revealing a rotation of the spin orientation across . To extract the orientations of the AFM axes we have simulated the experimental spectra using configuration interaction cluster calculations tanaka . The calculated spectra are shown in Fig. 4 (a-c) and the parameters used in our calculation are listed in Ref. CY . The corresponding FeO6 cluster considered in our calculations is also shown in the right part of each figure. One can see that the experimental spectra are nicely reproduced by the calculated spectra with spins parallel to - and -axis at 440 K and 490 K respectively, thus, corroborating the collinear magnetic structure obtained in our neutron measurements.
Also our Fe-L2,3 X-ray magnetic circular dichroism (XMCD) spectra as well as our Mössbauer spectroscopy measurements are fully consistent with the fact that there is only one Fe3+ species in SmFeO3, see Supplementary Materials suppl .
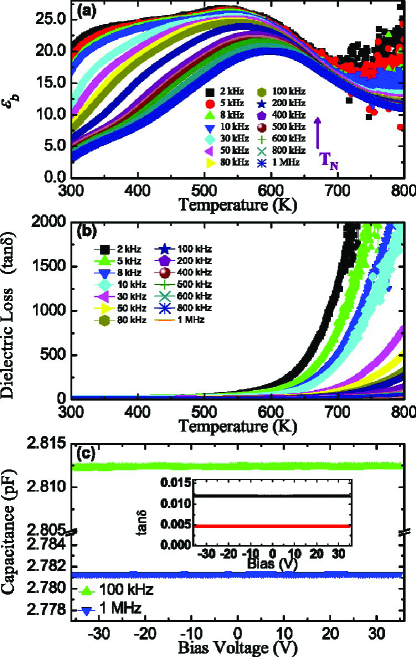
Finally, we measured the anisotropic dielectric properties of single crystalline thin plates of SmFeO3. The capacitance was measured over a range of frequencies with an excitation level of 1 V, while the temperature was swept at a slow warming or cooling rate (1-2 K/min). As shown in Fig. 5 (a,b) the temperature-dependent dielectric constant with electric field along -axis, , shows only a broad hump with strong frequency-dependence below 600 K. The dielectric loss, tan, rises strongly as the temperature increases. All samples are insulators at room temperature and become slightly conductive at high temperatures (several k at 800 K). No apparent anomalies could be observed in around . If an intrinsic ferroelectric transition occurs at , the corresponding anomalies should be observable in both and tan, irrespective of testing frequencies. Also and exhibit no anomalies at . Complementary capacitance-voltage (-) measurements were carried out for all our samples at room temperature. Fig. 5 (c) shows a typical - curve with the electric field applied along the -axis. No hysteresis could be observed for SmFeO3 within the experimental resolution () .
Hence, we can exclude the existence of ferroelectricity in SmFeO3. We interpret the observations in Ref. smoA differently and suggest that strain could be induced by magnetoeleastic coupling at which then would be responsible for an artificial observation of a pyrocurrent in -direction at . Indeed, our synchrotron radiation powder X-ray diffraction measurements reveal anomalies predominantly of the -lattice parameter of SmFeO3 at , see Fig. 1 (d). The hysteresis loop reported to occur at 300 K in Ref. smoA may then be attributed to leakage currents scott which is absent in our experiment. Perhaps this is related to the different lossy character of flux-grown smoA and floating zone grown single crystals.
The absence of ferroelectric properties in SmFeO3 is also consistent with the k=0 magnetic structure that we observed. This has to be contrasted with the case of other isostructural multiferroic materials, like TbMnO3, where non-collinear chiral magnetic structures have been observed tb . We note that for a G-type antiferromagnetic rare-earth orthoferrite FeO3, the electric polarization induced by exchange striction is known to occur only below the rare earth magnetic ordering temperature which is two orders of magnitude lower than gdfeo . If exchange striction would be an important mechanism in SmFeO3 one would expect to see also a pyrocurrent signal when the magnetic structure exhibits distinct changes at which is not experimentally observed smoA . Finally, we would like to remark that magneto-elastic effects are not only present in prototypical multiferroic materials like BiFeO3 bifeoA ; bifeoB but (across the doping series Bi1-xLaxFeO3 bifeoC ) also in non-ferroelectric centrosymmetric materials like LaFeO3 lafeoA ; lafeoB . Our findings suggest that magneto-elastic effects may also lead to an artificial observation of pyrocurrents and, hence, magnetoelastic coupling can easily be misinterpreted as a ferroelectric response.
.1 Acknowledgements
We thank D. I. Khomskii, M. W. Haverkort and A. Tsirlin for helpful discussions. We thank H. Borrmann and his team for X-ray diffraction measurements. We thank U. Burkhardt and his team for EDX measurements. This work is partially based on experiments performed at the Swiss spallation neutron source SINQ, Paul Scherrer Institute, Villigen, Switzerland. XMCD experiments were performed at the BL29 Boreas beamline at the ALBA Synchrotron Light Facility with the collaboration of ALBA staff.
References
- (1) T. Kimura et al., Nature 426, 55 (2003)
- (2) S.-W. Cheong and M. Mostovoy, Nat. Mater. 6, 13 (2007)
- (3) J.-H. Lee et al., Phys. Rev. Lett. 107, 117201 (2011)
- (4) R. D. Johnson et al., Phys. Rev. Lett. 108, 219701 (2012)
- (5) J.-H. Lee et al., Phys. Rev. Lett. 108, 219702 (2012)
- (6) See Supplemental Material [url], which includes Refs. [3,7,10].
- (7) M. Eibschutz, S. Shtrikman and D. Treves, Phys. Rev. 156, 562 (1967)
- (8) Y. K. Jeong et al., Solid State Commun. 152, 1112 (2012)
- (9) E. F. Bertaut, Acta. Cryst. A 24, 217 (1968)
- (10) E. N. Maslen et al., Acta Cryst. B52, 406 (1996)
- (11) P. Kuiper et al., Phys. Rev. Lett. 70, 1549 (1993)
- (12) J. X. Zhang et al., Phys. Rev. Lett. 107, 147602 (2011)
- (13) J. C. Yang et al., Phys. Rev. Lett. 109, 247606 (2012)
- (14) A. Tanaka and T. Jo, J. Phys. Soc. Jpn. 63, 2788 (1994)
- (15) FeO6 cluster parameters [eV]: Udd=5.0, Upd=6.0, =3.0, 10Dq=1.2, eg=0.04, t2g=0.02, Du=-0.015, EgMix=0.02, pd=-1.4 and pd=0.64, Slater integrals 75% of Hartree Fock values
- (16) J. F. Scott, J. Phys.: Condens. Matter 20 021001 (2008)
- (17) R. Kajimoto et. al., Phys. Rev. B 70, 012401 (2004)
- (18) Y. Tokunaga et. al., Nat. Mat. 8 558 (2009)
- (19) S. Lee et. al., Phys. Rev. B 88,060103 (2013)
- (20) S. Lee et. al., J. Phys. Soc. Jpn. 80, 114714 (2011)
- (21) C. M. Kavanagh et. al., Chem. Mater., 24, 4563 (2012)
- (22) G. L. Beausoleil et. al., Journal of the American Ceramic Society 97, 228 (2014)
- (23) S. M. Selbach et. al., J. Solid State Chem. 196, 249 (2012)
| Supplemental Materials for |
| k=0 magnetic structure and absence of ferroelectricity in SmFeO3 |
The results of our single crystal and powder neutron diffraction as well of our single crystal X-ray diffraction measurements are listed in Table 1. The crystal structure of SmFeO3 which been determined by single crystal X-ray diffraction using Mo-Kα radiation is close to literature values elec . The magnetic structure of SmFeO3 could be obtained from powder neutron diffraction measurements that have been performed at the HRPT diffractometer at SINQ ( = 1.8857 Å). Complementary single crystal neutron diffraction measurements have been performed at the D9 diffractometer at the ILL ( = 0.511 Å). Crystal and magnetic structure of SmFeO3 could be obtained at the same time in this single crystal neutron measurement. The structural parameters (including ADP) are extremely close to the ones obtained by single crystal X-ray diffraction proving the high reliability of our room-temperature single crystal neutron data and that we were able to cope with the highly neutron absorbing properties of the Sm-ions. The high temperature single crystal neutron data was measured using a furnace and much less reflections have been collected leading to less accurate results. The detection of extremely tiny ferrolectric distortions of the Fe-ions or any small cantings of magnetic moments is beyond the scope of all these measurements.
| single crystal diffraction | |||
| method | X-ray | neutron | neutron |
| Temp. | 300 K | 300 K | 500 K |
| reflections | 64479 | 983 | 246 |
| redundancy | 26.3 | 2.28 | 1.58 |
| Rint(%) | 2.20 | 2.85 | 5.53 |
| GoF | 1.39 | - | - |
| R/Rw(%) | 1.70/4.73 | 6.23/6.65 | 27.3/6.64 |
| x(Sm1) | 0.986950(2) | 0.98662(2) | 0.99547(8) |
| y(Sm1) | 0.056695(2) | 0.05675(1) | 0.05657(0) |
| U(Sm1) | 0.005118(2) | 0.00604(4) | 0.017(4) |
| U(Fe1) | 0.004207(5) | 0.00348(1) | 0.017(4) |
| x(O1) | 0.09424(3) | 0.09476(2) | 0.04999(11) |
| y(O1) | 0.47096(3) | 0.47109(1) | 0.48585(18) |
| U(O1) | 0.00619(2) | 0.00626(1) | 0.017(4) |
| x(O2) | 0.69981(2) | 0.69947(1) | 0.72279(7) |
| y(O2) | 0.29896(2) | 0.29913(1) | 0.28984(4) |
| z(O2) | 0.04933(2) | 0.04971(0) | 0.02830(10) |
| U(O2) | 0.00642(2) | 0.00609(1) | 0.017(4) |
| AFM config. | FxCyGz | GxAyFz | |
| Mx () | - | 2.836(112) | |
| My () | - | - | |
| Mz () | 3.692(53) | - | |
| powder diffraction | |||
| method | neutron | neutron | |
| Temp. | 300 K | 515 K | |
| Rmag.(%) | 23.3 | 22.0 | |
| AFM config. | FxCyGz | GxAyFz | |
| Mx () | - | 3.020(110) | |
| My () | - | - | |
| Mz () | 3.759(71) | - | |
| lattice parameters | |||
| Temp. | (Å) | (Å) | (Å) |
| 301 K | 5.39827(9) | 5.59872(9) | 7.7071(1) |
| 493 K | 5.4089(1) | 5.6054(1) | 7.7236(2) |
| 503 K | 5.4095(1) | 5.6057(1) | 7.7251(2) |
| 513 K | 5.4102(1) | 5.6063(1) | 7.7256(2) |
| 523 K | 5.4109(1) | 5.6064(1) | 7.7264(2) |
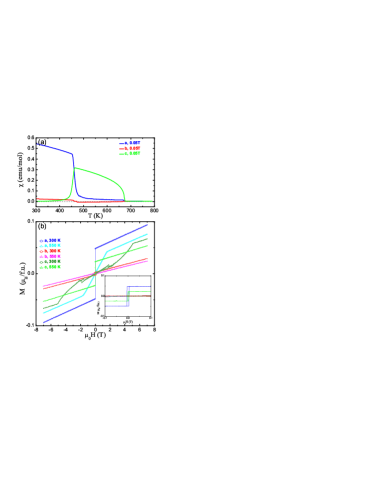
We measured the magnetic susceptibility of our SmFeO3 single crystals using a SQUID-VSM magnetometer. As can be seen in Fig. 6, the findings in Ref. smoA can be reproduced by our SmFeO3 single crystals. However, our single crystals have roughly 5 K higher magnetic ordering temperature 675 K than that in Ref. smoA . The - curve in -direction that was not shown in Ref. smoA also exhibits a step-like jump at little higher coercive fields, i.e. at about 0.14 T instead of at about 0.0035 T like for the -direction. This also proves that we did not simply measure the -direction effect in a slightly misaligned sample.
| isomer shift: | 0.3672(6) mm/s | hyperfine field: | 50.88(1) T |
|---|---|---|---|
| q. splitting: | -0.104(1) mm/s | line width: | 0.237(2) mm/s |
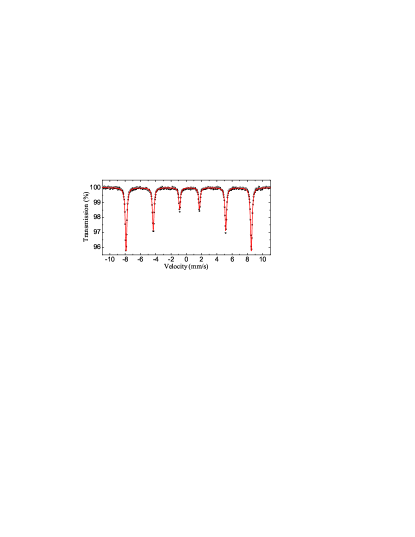
Complementary Mössbauer spectroscopy measurements indicate with high accuracy solely one Fe3+ species within our orange SmFeO3 powder samples that were obtained by crushing parts of our single crystals. The spectrum, which was obtained at room temperature with a standard spectrometer operating in the constant acceleration mode, can be well fitted with only one sextet consistent with the fact that there is only one crystallographic Fe site, see Fig. 7. The deduced hyperfine parameters are listed in Table 2 and are consistent with published data in literature smoMoess . The very narrow line width of 0.237 mm/s corroborates the high quality of our SmFeO3 crystals and is in agreement with the collinear antiferromagnetic spin structure derived from the neutron diffraction study. In this case a well defined magnetic hyperfine field and orientation between hyperfine field and electric field gradient results in a sharp pattern. On the other hand, incommensurate spin structures could lead to line broadening due to variations in the orientation between the electric field gradient and the hyperfine field and/or in the size of the hyperfine field. The spin reorientation transition at in SmFeO3 is reflected as a change of the quadrupole coupling smoMoess .
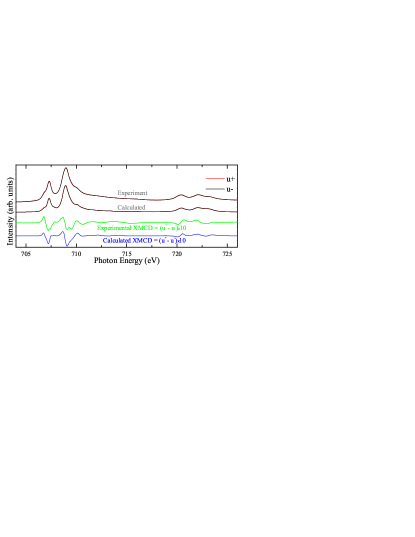
We have also measured the Fe-L2,3 X-ray magnetic circular dichroism (XMCD) spectra at the BL29 Boreas beamline at the CELLS-ALBA synchrotron radiation facility (Barcelona, Spain). The XMCD spectrum shown in Fig. 8 is the difference between the signals with photon spin parallel (u+) and antiparallel (u-) to the magnetic field. Its shape is similar to the previous study smoA but the size of the our XMCD is enhanced by more than factor two due to high magnetic field in this work. We can well reproduce the XMCD shape at both, the L3 and L2 edges. Although there are four Fe atoms in the unit cell of SmFeO3, our calculations show that each of these four sites gives the same XMCD spectrum. Therefore, the four major dichroism peaks do not arise from four sets of the spin subsystem as concluded in Ref. smoA , but from the local symmetry of each single Fe ion.
References
- (1) J.-H. Lee et al., Phys. Rev. Lett. 107, 117201 (2011)
- (2) M. Eibschutz, S. Shtrikman and D. Treves, Phys. Rev. 156, 562 (1967)
- (3) E. N. Maslen et al., Acta Cryst. B52, 406 (1996)