Nonequilibrium transport in density-modulated phases of the second Landau level
Abstract
We investigate non-equilibrium transport in the reentrant integer quantum Hall phases of the second Landau level. At high currents, we observe a transition from the reentrant integer quantum Hall phases to classical Hall-conduction. Surprisingly, this transition is markedly different for the hole- and electron sides of each spin-branch. While the hole bubble phases exhibit a sharp transition to an isotropic compressible phase, the transition for the electron side occurs via an intermediate phase. This might indicate a more complex structure of the bubble phases than currently anticipated, or a breaking of the particle-hole symmetry. Such a symmetry breaking in the second Landau level might also have consequences for the physics at filling factor =5/2.
pacs:
73.23.-b, 73.63.-b, 73.43.-f, 73.43.Jn, 73.43.LpI Introduction
The properties of the lowest Landau level (=0) are strongly influenced by fractional quantum Hall (FQH) physics, giving rise to a large number of incompressible ground states with a vanishing longitudinal resistance and a quantized Hall resistance at the corresponding filling factors . In contrast, the physics of higher Landau levels (LLs), , is dominated by density-modulated quantum Hall phases. Close to half-filling, highly anisotropic and nonlinear transport properties were found Lilly et al. (1999); Du et al. (1999); Cooper et al. (1999). At and , was found to vanish, while was restored to the value of the neighboring integer quantum Hall (IQH) plateau Lilly et al. (1999); Du et al. (1999); Cooper et al. (1999). This effect was referred to as reentrant integer quantum Hall (RIQH) effect. Theoretical Fogler et al. (1996); Moessner and Chalker (1996); Shibata and Yoshioka (2001); Koulakov et al. (1996); Fogler (2001); Côté et al. (2003) and experimental Lilly et al. (1999); Du et al. (1999); Cooper et al. (1999); Lewis et al. (2002, 2004, 2005); Cooper et al. (2003) evidence points towards density modulated stripe or bubble phases which are responsible for the resistance anisotropy or the RIQH effect. In the second LL (=1), a competition between FQH states and RIQH states is observed Eisenstein et al. (2002); Xia et al. (2004); Kumar et al. (2010); Deng et al. (2012a, 2014); Csáthy et al. (2005); Pan et al. (2008); Nuebler et al. (2010). At certain filling factors, theory suggests the existence of two one- or two-electron-bubble and two one- or two-hole-bubble phases, which provide a lower ground-state energy than the FQH states or an isotropic liquid Goerbig et al. (2003, 2004). The underlying physics of the FQH states in the second LL, like the =5/2 and =12/5 states is an open issue under intensive theoretical and experimental investigation Willett (2013) and of great interest, due to potential applications in topological quantum computation. Experiments which investigate the RIQH phases of the second LL require very low temperatures and two-dimensional electron gases (2DEGs) of very high mobility. Recently temperature-dependent measurements have revealed the importance of Coulomb interactions for the formation of RIQH states and indicated that a particle-hole asymmetry in the energy scales for the formation of electron and hole bubble phases occurs Deng et al. (2012a, 2014). A particle-hole symmetry breaking might have far-reaching consequences for the physics of the second LL, for example, for the ground-state wave function at =5/2. A deeper understanding of the bubble phases which compete with these FQH states might be necessary to understand the physics of the second LL as a whole.
We report on magneto-transport measurements of high mobility 2DEGs. We investigate the RIQH states of the second LL in non-equilibrium transport, by driving a finite DC current bias through the system. For large DC currents, RIQH states disappear and the Hall resistance approaches its high-temperature limit, where no density modulated phases are formed. We denote this phase as the isotropic compressible phase (ICP). Surprisingly, the qualitative form of the transition from RIQH phases to the ICP is different for electron and hole bubble states. While hole bubble states exhibit a sharp transition to the ICP, a gradual transition involving a different intermediate phase is found for the electron bubble states. Qualitatively similar findings were obtained with three different samples, made from different high mobility heterostructures which employ different growth techniques Reichl et al. (2014). From these measurements, we extract and compare energy scales for the different RIQH states of the second LL. The local formation of RIQH states has been investigated by measuring transport through a quantum point contact (QPC). Here, signatures of the hole bubble states are completely absent, whereas signatures corresponding to the electron bubble states are most likely a pure bulk effect, while no RIQH phases are formed in the QPC channel. The direction dependence of the breakdown of the RIQH phases with respect to the current orientation has also been investigated. We observe that qualitative features of the transition to the isotropic compressible phase do not depend on the current orientation.
II Experimental details
Measurements have been performed on photolithographically defined 500 m wide Hall-bars, contacted with Au/Ge/Ni Ohmic contacts in a standard four-terminal measurement scheme. An AC current of typically 0.5 nA is passed from source to drain and and are measured using lock-in techniques. In non-equilibrium situations, an additional DC current is added to the AC current. Three different high mobility structures have been used for the experiments (wafer A: without illumination, wafer B: without illumination, wafer C: after illumination). Experiments have been conducted in two cryogen-free dilution refrigerators, the first with a bath temperature of approx. 10 mK and an electronic base temperature (12.5 0.5) mK, the second with a bath temperature of approx. 3.5 mK. The electronic temperatures have been achieved by low-pass filtering and thermally anchoring the cabling at every temperature stage (for details see Ref. Baer, 2014). The filling factors of the RIQH states have been calculated from their magnetic field position relative to the center of the plateau in . We estimate an uncertainty in the filling factors of for this procedure.
III Results and discussion
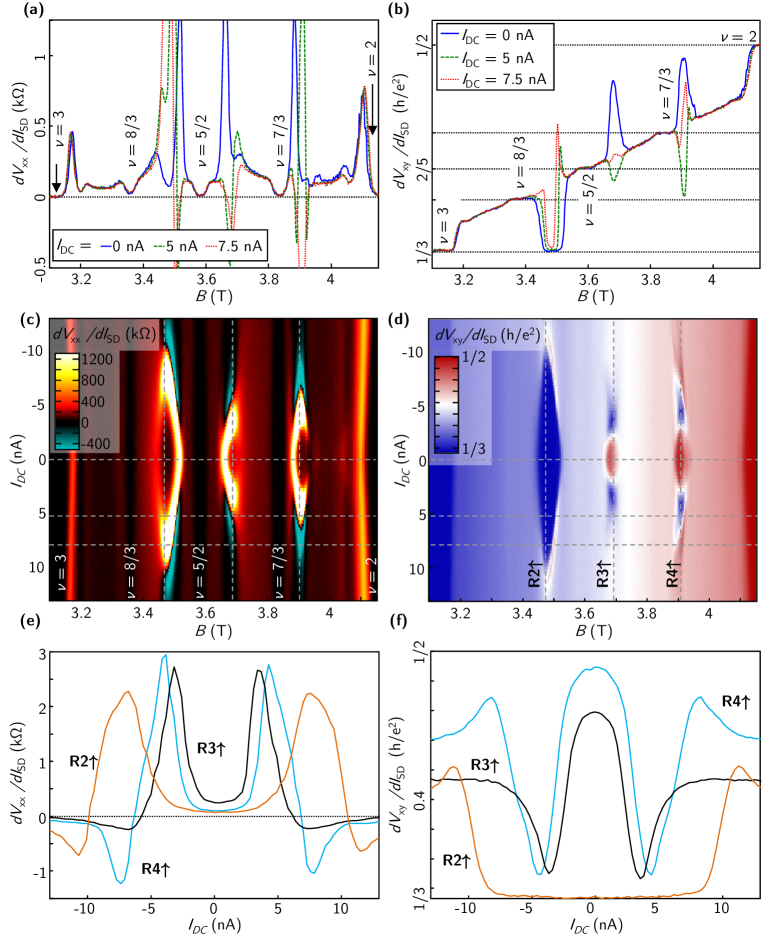
In linear transport, only the AC current ( nA) is passed along the long axis of the Hall-bar, between source and drain and we measure the longitudinal voltage and the Hall voltage . Fig. 1.a and 1.b (blue curves) show the differential longitudinal and Hall resistances, and , for filling factors . The longitudinal resistance vanishes for the FQH states at =8/3, 7/3 and 5/2, while the Hall resistance exhibits plateaus at the same magnetic fields.
Turning to non-linear transport, a DC current from source to drain is added on top of the AC current: . Traces of the differential longitudinal and Hall resistance for finite DC currents are also shown in Fig. 1.a and Fig. 1.b. While the FQH states or the isotropic compressible phase show a weak dependence on DC current, the differential resistance depends strongly on DC current close to the RIQH states. Fig. 1.c shows in colorscale the differential longitudinal resistance as a function of the magnetic field and the DC current . The FQH states at =8/3, 7/3 and 5/2 show up as black stripes at a constant magnetic field. When the differential Hall resistance is plotted as a function of the magnetic field and the DC current (1.d), RIQH states with a quantized differential resistance of or show up as red or blue diamond-shaped regions. We denote the RIQH states in the upper spin branch () by R1-R4 and in the lower spin branch () by R1-R4 (see Fig. 1.d). The RIQH state R1 is not observed in the measurement of Fig. 1.d, which is a first indication for the different relevant energy scales for the RIQH states. We find R1 to be the most fragile state, only being observed in some of our measurements. On the high magnetic field side of =5/2, the RIQH diamonds are neighbored in -direction by strong side-peaks of smaller differential Hall resistance. We denote this regime as intermediate current bias phase. The regions of a differential Hall resistance of (states R3 and R4) or (state R2) are defined by the inner or outer boundaries of resistance peaks in (Fig. 1.d).
The DC current dependence of and is shown in Fig. 1.e and Fig. 1.f. Here, the quantity shows a different behavior for the RIQH phases on both sides of the state. For the RIQH state R2 (indicated in Fig. 1.d), increases sharply close to the classical background value, with only slight overshoots when the RIQH state is destroyed. In contrast, for the RIQH state R3, shows very pronounced undershoots, before it reaches the classical background value. The RIQH state R4 even shows a more complicated current dependence, where first undershoots and then overshoots, before it reaches the classical background value. Similar results have been obtained from measurements with other 2DEGs and subsequent cooldowns (see Fig. 2.a and S.I.). In contrast to transport in higher LLs Göres et al. (2007), the qualitative breakdown signatures of the different RIQH states in the second LL are independent of the crystal orientation of the sample and of the magnetic field direction.
III.1 Phase diagram of reentrant integer quantum Hall phases
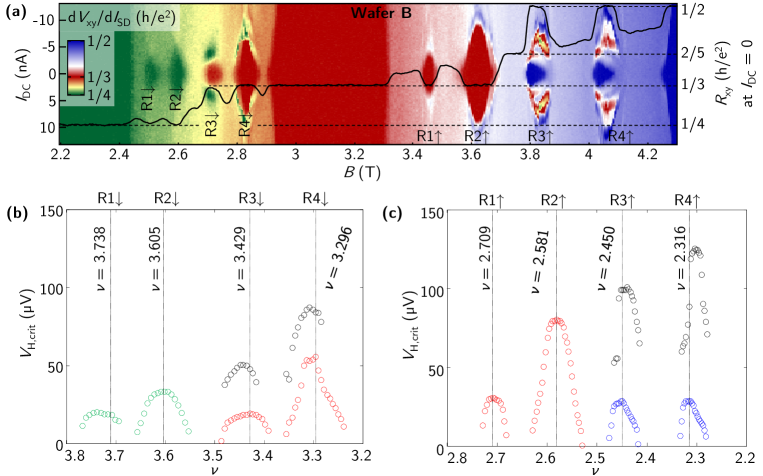
The critical current for which a RIQH state disappears is defined by the condition that the amplitude of the RIQH peak or dip in the differential Hall resistance has reached 30% of its maximum amplitude (i.e. 30 % of the difference between the classical Hall background resistance and the quantized resistance of the neighboring IQH plateau). The same threshold, but with different sign is used for the intermediate current bias phase of the RIQH states R3, R4, R3 and R4. Following these considerations, we define a critical Hall voltage via . Here, is the quantized Hall resistance, corresponding to the RIQH state. The resulting critical Hall voltage is plotted as a function of the filling factor in Fig. 2 for measurement with wafer B.
The critical Hall voltage of the RIQH states R2/ and R4/ is larger than for R1/ and R3/. In contrast to the critical current, the critical Hall voltage does increase monotonically with decreasing filling factor over =7/2 and =5/2. The critical current exhibits a non-monotonic behavior. A similar non-monotonic behavior has previously been observed for the critical temperatures at which the RIQH states start to form Deng et al. (2012a, b) and gives evidence for a particle-hole asymmetry in the corresponding energy scales.
III.2 Transition from RIQH phase to isotropic compressible phase
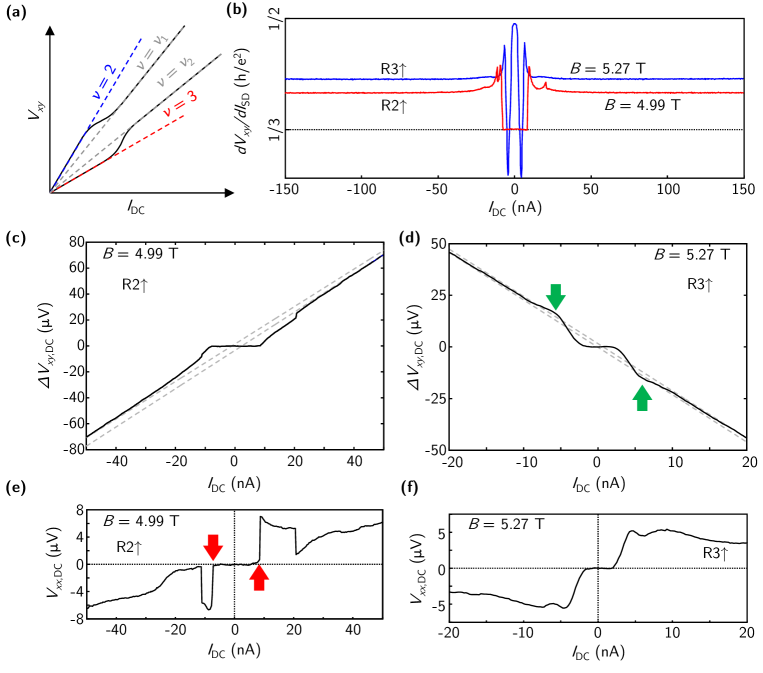
The transition from a RIQH phase to the ICP occurs in a qualitatively different way for the RIQH states at both sides of and . The behavior of the differential Hall resistance can be better understood from a plot of the Hall voltage versus the DC current , . We schematically show the expected dependence of on in Fig. 3.a for a continuous transition between a RIQH phase and an isotropic compressible phase. For a constant filling factor, a linear slope is expected. Hence at a small DC current, where the RIQH state exists, the RIQH states R3 and R4 (with a plateau value of ) exhibit a slope of in the - diagram (green dashed line in Fig. 3.a). Similarly, a slope of is expected for the RIQH states R1 and R2 (red dashed line in Fig. 3.a). In the limit of large currents, the RIQH phase does no longer exist, and a background Hall resistance, which is determined by the corresponding filling factor, is found (grey dashed lines in Fig. 3.a). Thus, the curve is expected to possess a slope of for large DC currents, where 2.43 or 2.30 for the RIQH states R3 and R4 and 2.71 or 2.58 for R1 and R2. In-between the low- and high-current regime, a continuous transition occurs, while all the linear slopes discussed before are expected to interpolate to the origin of the diagram. In order to satisfy these conditions, an intermediate regime with a smaller slope of (hence smaller differential Hall resistance) is expected for the transition from to the isotropic liquid. In contrast, for the transition from =3, we expect an intermediate regime with a larger slope in versus . In the differential resistance, this would be visible as pronounced undershoots of the differential resistance for the RIQH states R3 and R4, while strong overshoots should be visible for R1 and R2. The expected for such a continuous transition are shown schematically as black lines in Fig. 3.a, where and denote the non-quantized “background” filling factors.
The measured transition from RIQH phases to the ICP can be compared to this expectation. A measured differential Hall resistance is plotted versus the DC current in Fig. 3.b. As the DC current is increased at the magnetic field values corresponding to the RIQH states R2 and R3, a transition to an isotropic compressible background occurs for DC currents smaller than nA and the differential Hall resistance is constant at higher currents (Fig. 3.b). The measured DC Hall and longitudinal voltages, and are shown in Fig. 3.c-f. For better visibility, a linear slope corresponding to or has been subtracted from the DC Hall voltage. After this subtraction, the RIQH phases are seen as plateaus at . Dashed lines are fitted to the linear parts of the Hall voltage (for 75 nA 150 nA). For the RIQH state R2, the DC Hall voltage abruptly deviates from the quantized slope, when increasing the DC current above a critical value of 10 nA (Fig. 3.c). At the same time, sharp jumps are observed in the longitudinal DC voltage (marked by red arrow in Fig. 3.e). Above the critical current, in Fig. 3.c increases monotonically until it reaches the slope corresponding to the ICP, similar to the current-voltage characteristics of a gapped superconductor. In contrast, changes smoothly for the RIQH state R3 and jumps in are absent. As the DC current is increased, overshoots below or above the linear regime of (marked by green arrows in Fig. 3.d) are observed. Similar observations have been made in several samples. While our observations for the RIQH states R3 and R4 (and R3, R4) resemble the scenario for a continuous transition to the ICP as depicted in Fig. 3.a, the sharp transition for the RIQH states R1 and R2 (and R1, R2) might be interpreted as a depinning of the hole bubbles, or a mechanism involving a jump of the Fermi energy across an energy gap. These two different observations might also be explained by different routes for a two-dimensional melting transition, either by a first-order phase transition or by two continuous transitions via an intermediate phase Kosterlitz and Thouless (1973); Kosterlitz (1974); Halperin and Nelson (1978); Young (1979); Fradkin and Kivelson (1999). Measurements of wafer A in a van der Pauw geometry at a bath temperature of approx. 3.5 mK indicate the formation of an intermediate current bias phase, for both electron and hole bubbles (see section III.4). However, also here the intermediate current bias phase is more pronounced for the RIQH states R3 and R4. This might indicate that the different behavior of electron and hole bubble phases is governed by different energy scales.
III.3 Reentrant integer quantum Hall phases in a QPC
More information about the local formation of RIQH states can be obtained from investigating a constriction defined by a QPC. Fig. 4.a,b shows the differential Hall resistance, measured in the bulk of a high mobility Hall-bar. As before, R1 and R2 show a sharp threshold to an isotropic compressible phase, while a transition via an intermediate phase is observed for R3 and R4. Now we turn to a situation, where a 1.1 m wide QPC, fabricated on top of the 2DEG is defined by applying negative voltages to the top-gates ( V). We measure the voltage diagonally across the QPC, from which an effective filling factor of the QPC, , is obtained via Beenakker and van Houten (2004). The system is tuned to a weak backscattering situation, where bulk and QPC densities are identical, which can be seen from the overlap of the IQH plateaus in and (see Ref. Baer et al., 2014). Figs. 4.c,d show the differential diagonal resistance for this situation. While the IQH plateaus are still clearly visible (Fig. 4.d), FQH states can no longer be clearly identified. The reason for this is weak quasiparticle tunneling which destroys the FQH plateaus and gives rise to a power-law tunneling conductance between counterpropagating edge states (see Ref. Baer et al., 2014). In this situation, the RIQH states R1 and R2 have vanished and are no longer seen in the diagonal resistance. In contrast, R3 and R4 are even more pronounced than in the bulk. The regions corresponding to a quantization at have a larger extent in the direction than in the bulk.
The observation of the RIQH states R3 and R4 in the diagonal resistance however does not imply that they are formed in the QPC constriction. The relation is only valid, if , which is not necessarily the case for the density modulated bubble phases. In this case, the following relation holds: . A schematic picture of this situation is shown in Fig. 4.e. For the RIQH states R1 and R2, the innermost edge state (corresponding to =3) is partially backscattered at the QPC and hence the quantization is lost, even if the RIQH states persist in the bulk. For the RIQH states R3 and R4 however, the innermost edge state of the bulk corresponds to . If a compressible region is formed in the QPC, it has a larger filling factor than two, and hence the =2 edge state is protected from backscattering. Hence, the quantized value of can be interpreted as a bulk signature, where describes the bulk transport properties and where a compressible phase is formed in the QPC, leading to .
We conclude that most likely no density modulated phases persist in the QPC channel. The different characteristics of the RIQH states R3 and R4 when measured in the bulk and across a QPC might result from a density gradient close to the QPC or from a variation in the current distribution and hence a partial local Hall voltage drop in the center of the QPC channel.
III.4 Orientation dependence of transport in the RIQH regime
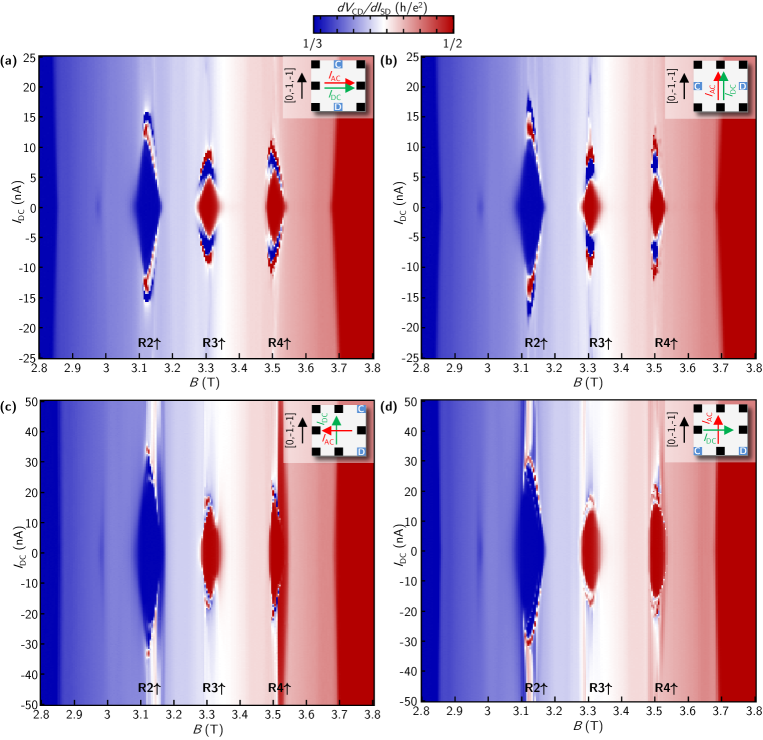
To investigate the orientation dependence of the transport in the RIQH regime, we have measured a square van der Pauw geometry of wafer A with eight Au/Ge/Ni Ohmic contacts (see schematic inset Figs. 5 and 6). The 750 m 750 m square van der Pauw mesas and contacts have been defined by optical lithography, to ensure a perfect square geometry and alignment with the crystal directions.
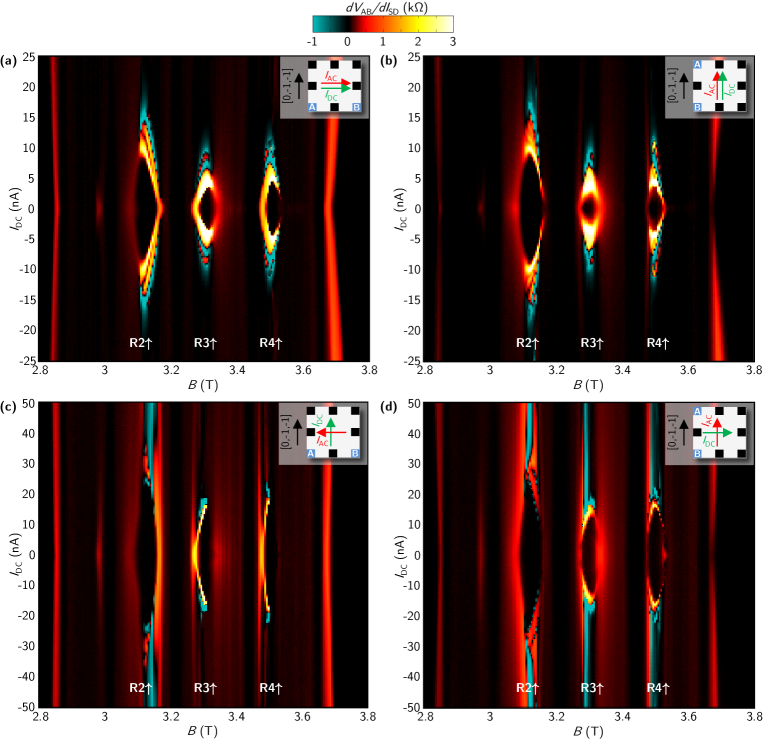
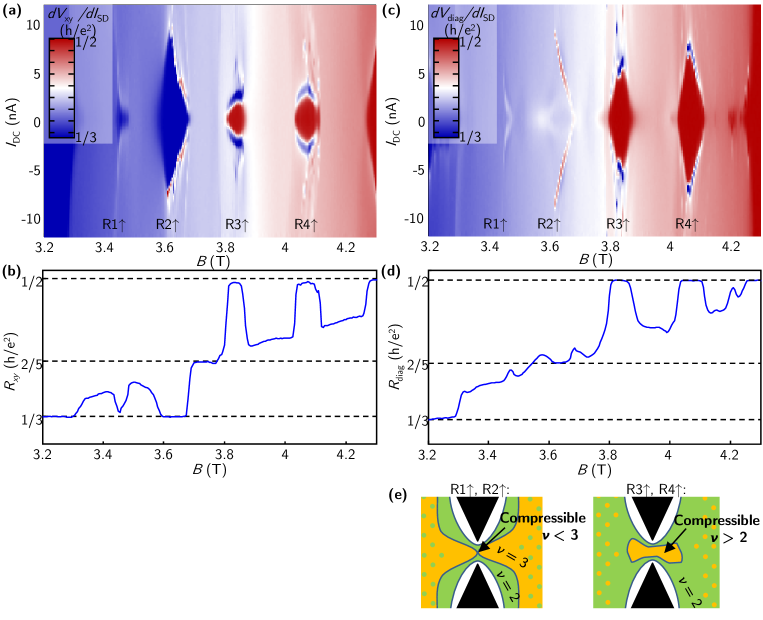
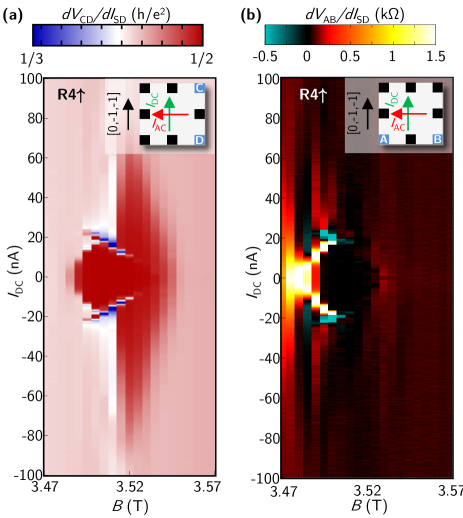
In contrast to stripe phases in higher LLs, we expect the bubble phases of the second LL to be isotropic. However, it was shown that a large DC current can induce anisotropies in density modulated phases which are isotropic at small currents Göres et al. (2007). Figs. 5 and 6 show the differential longitudinal and Hall resistances for different orientations of the AC and DC current as a function of magnetic field and DC current. Insets show schematically the current configurations and the contact configuration used for each measurement. For parallel AC and DC currents, breakdown signatures of the RIQH states of the second LL are qualitatively similar (Fig. 6.a,b) and critical currents are of comparable magnitude. However, driving the DC current perpendicular to the AC current changes the shape of the RIQH phases. The most distinct change is observed for the RIQH state R4 (see Figs. 5 and 6 and a close-up in Fig. 7). Here, the original diamond-shaped RIQH phase extends at the high magnetic field side into a larger diamond-shaped region, with a differential Hall resistance close to (see Fig. 7.a), which prevails up to large currents of approximately 90 nA. This region is not observed for transport in perpendicular direction (Fig. 5.d and 6.d) and thus might arise due to current-induced anisotropies.
IV Conclusion
Our observations suggest that either the particle-hole symmetry is broken for the density modulated phases in the second Landau level, or that the bubble phases are of a more complex structure than currently anticipated. A symmetry breaking has a strong influence on the properties of the density modulated phases and might also have an important impact on the physics of the FQH states in the second LL, like the =5/2 FQH state.
We gratefully acknowledge discussions with Bernd Rosenow, Jurgen Smet, Rudolf H. Morf, Lars Tiemann and Werner Dietsche. We acknowledge the support of the ETH FIRST laboratory and financial support of the Swiss National Science Foundation (Schweizerischer Nationalfonds, NCCR “Quantum Science and Technology”). H.C. O. acknowledges financial support of the ICFP, Département de Physique, Ecole Normale Supérieure, 75005 Paris, France.
Note added: during the preparation of the manuscript, a preprint by Rossokhaty et al. appeared, which discusses the high-current breakdown of the RIQH phases Rossokhaty et al. (2014).
V References
References
- Lilly et al. (1999) M. P. Lilly, K. B. Cooper, J. P. Eisenstein, L. N. Pfeiffer, and K. W. West, Physical Review Letters 83, 824 (1999).
- Du et al. (1999) R. R. Du, D. C. Tsui, H. L. Stormer, L. N. Pfeiffer, K. W. Baldwin, and K. W. West, Solid State Communications 109, 389 (1999).
- Cooper et al. (1999) K. B. Cooper, M. P. Lilly, J. P. Eisenstein, L. N. Pfeiffer, and K. W. West, Physical Review B 60, R11285 (1999).
- Fogler et al. (1996) M. M. Fogler, A. A. Koulakov, and B. I. Shklovskii, Physical Review B 54, 1853 (1996).
- Moessner and Chalker (1996) R. Moessner and J. T. Chalker, Physical Review B 54, 5006 (1996).
- Shibata and Yoshioka (2001) N. Shibata and D. Yoshioka, Physical Review Letters 86, 5755 (2001).
- Koulakov et al. (1996) A. A. Koulakov, M. M. Fogler, and B. I. Shklovskii, Physical Review Letters 76, 499 (1996).
- Fogler (2001) M. M. Fogler, arXiv:cond-mat/0111001 (2001), pp. 98-138, in High Magnetic Fields: Applications in Condensed Matter Physics and Spectroscopy, ed. by C. Berthier, L.-P. Levy, G. Martinez (Springer-Verlag, Berlin, 2002).
- Côté et al. (2003) R. Côté, C. B. Doiron, J. Bourassa, and H. A. Fertig, Physical Review B 68, 155327 (2003).
- Lewis et al. (2002) R. M. Lewis, P. D. Ye, L. W. Engel, D. C. Tsui, L. N. Pfeiffer, and K. W. West, Physical Review Letters 89, 136804 (2002).
- Lewis et al. (2004) R. M. Lewis, Y. Chen, L. W. Engel, D. C. Tsui, P. D. Ye, L. N. Pfeiffer, and K. W. West, Physical Review Letters 93, 176808 (2004).
- Lewis et al. (2005) R. M. Lewis, Y. P. Chen, L. W. Engel, D. C. Tsui, L. N. Pfeiffer, and K. W. West, Physical Review B 71, 081301 (2005).
- Cooper et al. (2003) K. B. Cooper, J. P. Eisenstein, L. N. Pfeiffer, and K. W. West, Physical Review Letters 90, 226803 (2003).
- Eisenstein et al. (2002) J. P. Eisenstein, K. B. Cooper, L. N. Pfeiffer, and K. W. West, Physical Review Letters 88, 076801 (2002).
- Xia et al. (2004) J. S. Xia, W. Pan, C. L. Vicente, E. D. Adams, N. S. Sullivan, H. L. Stormer, D. C. Tsui, L. N. Pfeiffer, K. W. Baldwin, and K. W. West, Physical Review Letters 93, 176809 (2004).
- Kumar et al. (2010) A. Kumar, G. A. Csáthy, M. J. Manfra, L. N. Pfeiffer, and K. W. West, Physical Review Letters 105, 246808 (2010).
- Deng et al. (2012a) N. Deng, A. Kumar, M. J. Manfra, L. N. Pfeiffer, K. W. West, and G. A. Csáthy, Physical Review Letters 108, 086803 (2012a).
- Deng et al. (2014) N. Deng, G. C. Gardner, S. Mondal, E. Kleinbaum, M. J. Manfra, and G. A. Csáthy, Physical Review Letters 112, 116804 (2014).
- Csáthy et al. (2005) G. A. Csáthy, J. S. Xia, C. L. Vicente, E. D. Adams, N. S. Sullivan, H. L. Stormer, D. C. Tsui, L. N. Pfeiffer, and K. W. West, Physical Review Letters 94, 146801 (2005).
- Pan et al. (2008) W. Pan, J. S. Xia, H. L. Stormer, D. C. Tsui, C. Vicente, E. D. Adams, N. S. Sullivan, L. N. Pfeiffer, K. W. Baldwin, and K. W. West, Physical Review B 77, 075307 (2008).
- Nuebler et al. (2010) J. Nuebler, V. Umansky, R. Morf, M. Heiblum, K. von Klitzing, and J. Smet, Physical Review B 81, 035316 (2010).
- Goerbig et al. (2003) M. O. Goerbig, P. Lederer, and C. Morais Smith, Physical Review B 68, 241302 (2003).
- Goerbig et al. (2004) M. O. Goerbig, P. Lederer, and C. M. Smith, Physical Review B 69, 115327 (2004).
- Willett (2013) R. L. Willett, Reports on Progress in Physics 76, 076501 (2013).
- Reichl et al. (2014) C. Reichl, J. Chen, S. Baer, C. Rössler, T. Ihn, K. Ensslin, W. Dietsche, and W. Wegscheider, New Journal of Physics 16, 023014 (2014).
- Baer (2014) S. Baer, Transport spectroscopy of confined fractional quantum Hall systems, Ph.D. thesis, ETH Zürich, Zürich (2014).
- Göres et al. (2007) J. Göres, G. Gamez, J. H. Smet, L. Pfeiffer, K. West, A. Yacoby, V. Umansky, and K. von Klitzing, Physical Review Letters 99, 246402 (2007).
- Deng et al. (2012b) N. Deng, J. D. Watson, L. P. Rokhinson, M. J. Manfra, and G. A. Csáthy, Physical Review B 86, 201301 (2012b).
- Kosterlitz and Thouless (1973) J. M. Kosterlitz and D. J. Thouless, Journal of Physics C: Solid State Physics 6, 1181 (1973).
- Kosterlitz (1974) J. M. Kosterlitz, Journal of Physics C: Solid State Physics 7, 1046 (1974).
- Halperin and Nelson (1978) B. I. Halperin and D. R. Nelson, Physical Review Letters 41, 121 (1978).
- Young (1979) A. P. Young, Physical Review B 19, 1855 (1979).
- Fradkin and Kivelson (1999) E. Fradkin and S. A. Kivelson, Physical Review B 59, 8065 (1999).
- Beenakker and van Houten (2004) C. W. J. Beenakker and H. van Houten, cond-mat/0412664 (2004), Solid State Physics 44, 1 (1991).
- Baer et al. (2014) S. Baer, C. Rössler, T. Ihn, K. Ensslin, C. Reichl, and W. Wegscheider, Physical Review B 90, 075403 (2014).
- Rossokhaty et al. (2014) A. V. Rossokhaty, S. Lüscher, J. A. Folk, J. D. Watson, G. C. Gardner, and M. J. Manfra, arXiv:1412.1921 [cond-mat] (2014), arXiv: 1412.1921.