Novel model for wine fermentation including the yeast dying phase
Abstract
This paper presents a novel model for wine fermentation including a death phase for yeast and the influence of oxygen on the process. A model for the inclusion of the yeast dying phase is derived and compared to a model taken from the literature. The modeling ability of the several models is analyzed by comparing their simulation results.
1 Introduction
In food industry there is always a need to reduce production costs as, for example, the energy needed for cooling or heating to improve and
maintain the quality of the product. For this purpose, mathematical simulation and optimization methods are investigated and applied
to the production chain. This is the main objective of the project RŒNOBIO, that focuses on the modeling and optimization of the
wine fermentation process . Fundamental for this task is a model that is able to accurately describe the dynamics of the wine fermentation.
Wine fermentation is a very complex bio-chemical process that can be influenced in many ways by the environment and by the
addition and subtraction of bio-chemical components. For example, oxygen can be added to the must as it plays a crucial role for yeast activity. This takes place in the phase where the yeast is unable to cope with the high concentrations of sugar and nutrients. But the yeast has to take up the added oxygen before it can react with the must as this leads to oxidation of the wine. More information on the effects of oxygen on fermentation can be found in Shea A.J. Comfort [2].
During fermentation yeast grows by metabolizing sugar in presence of nutrients such as assimilable nitrogen. The consumed sugar is converted into ethanol. However, ethanol inhibits yeast growth and a high amount of it causes cell death.
In the literature, many different mathematical systems that model the process of wine making based on different kinetics can be found. Usually the development of yeast, sugar, alcohol, and assimilable nitrogen concentration are taken into account. However, these models do not represent the behavior of yeast cells that is observed in real experiments. The growth phases of yeast can be found in Dittrich et al. [4]. Moreover, oxygen has not been considered yet which is really important for yeast activity especially in the case of using Saccharomyces cerevisiae.
In this paper, the aspects of an effective model representing the process of wine fermentation are studied.
In the next section, based on a model taken from the literature, a new model with a yeast death term is derived.
It follows a comparison of simulation results for both models in Section 3. Conclusions are presented in Section 4.
2 Model derivation
In this section, a model taken from the literature is further developed to take into account the yeast dynamics. As a starting point, we consider the model proposed by David et al. [3], that is described by the following differential equations:
| (1) |
with
| (2) | ||||
This model is formulated with Michaëlis-Menten kinetics. Here, and are the maximum specific growth rates which depend on temperature ; and are saturation constants, and shows the ethanol inhibition dependent on the temperature.
The parameters and are the yield coefficients associated to nitrogen and sugar, respectively.
In this model, the growth of yeast concentration is only dependent on the nitrogen concentration. Sugar is converted into ethanol and inhibited by it as well.
As this model does not represent all the phases of yeast cell population dynamics, we add a nonlinear term to the yeast concentration equation,
thus ensuring that the lag and death phase of yeast cells take place. This behavior depends on the concentration of ethanol which inhibits the yeast such that if the ethanol concentration is below a tolerance the number of yeast cells stays stationary, and if it is greater than , the yeast cells die.
Furthermore, in the novel model, the sugar concentration is split up into the amount of sugar considered for the conversion into ethanol and the amount of sugar needed as a nutrient for the yeast.
Besides this, the presence of oxygen is added in the model because it is of paramount importance for yeast activity.
| (3) |
with
| (4) | ||||
In addition to the parameters already introduced for the starting model, the following parameters are needed. Instead of in this model two saturation constants associated to sugar, namely and , are needed. Thereby represents the saturation constant associated to the part of sugar used as a nutrient for the yeast and is the saturation constant associated to the part of sugar needed for the metabolization into alcohol. Moreover, stands for the yield coefficient related to the part of sugar which is used as a nutrient for the yeast. is the Michaëlis-Menten half-saturation constant associated to oxygen and represents the yield coefficient associated to oxygen.
For the following term is considered:
| (5) | ||||
where is the tolerance of the ethanol concentration, and and are parameters associated to the death of yeast cells due to ethanol exceeding the tolerance .
3 Results
In the following, simulation results for the model by David et al. and our new model are compared.
The simulation was performed using ACADO toolkit - a toolkit for Automatic Control and Dynamic Optimization developed by Moritz Diehl et al. [1, 5]. In this context a BDF (Backward Differentiation Formula) integrator was used to solve the system of differential equations representing the process.
For the numerical results obtained, the parameters were chosen according to the following table.
In this series of simulation, the fermentation temperature is equal to for the first half-time of the process and for the second half-time of the process. Thereby , and are assumed to be linear dependent on temperature such that
| (6) | ||||
| and | ||||
For the differential states the following initial values were chosen.
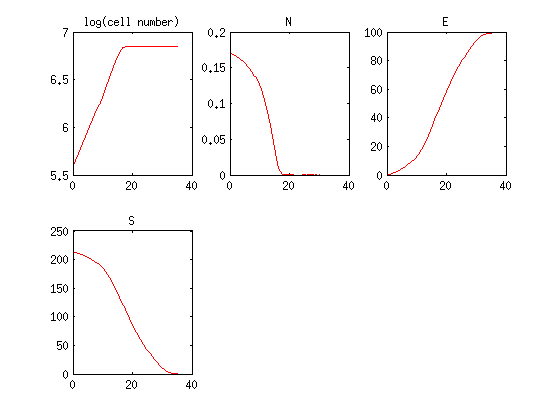
The model by David et al. [3] represents the growth and lag phase observed in real processes for yeast behavior. Moreover, it is apparent that yeast growth just depends on the current concentration of assimilable nitrogen. This yields a stationary number of yeast cells at the point where the whole nitrogen is consumed. Alcohol and sugar stand in a certain relationship to each other, which is defined by the yield coefficient parameter .
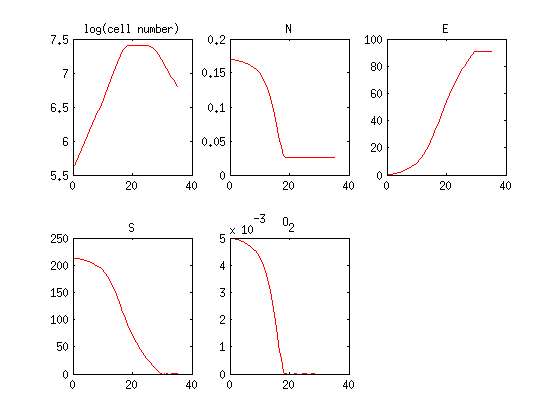
In addition to the latter model, the novel model with the death term (5) includes the death of yeast cells where the concentration of alcohol is greater than the tolerance . This leads to results that represent the yeast behavior as it is observed in real experiments. The only phase missing is the first one which is not covered by this model.
Moreover, here, alcohol and sugar, except of what is needed as a nutrient for yeast, stand in a certain relationship to each other, which is defined by the yield coefficient parameter .
4 Conclusions
In this paper, a new dynamical model for wine fermentation was derived. It was shown that the new model is able to predict the behavior of yeast growth as it is observed in real processes. Besides this, it also takes oxygen into account.
5 Acknowledgements
This research work was supported by the BMBF (German Federal Ministry of Education and Research) within the collaborative project RŒNOBIO.
We would like to thank Peter Fürst, Peter Petter, Ivo Muha and Rainer Keicher for many useful comments.
References
- [1] D. Ariens, B. Houska, H. Ferreau, and F. Logist. ACADO for Matlab User’s Manual. Optimization in Engineering Center (OPTEC), 1.0beta edition, May 2010. http://www.acadotoolkit.org.
- [2] Shea A.J. Comfort. Oxygen and fermentation. More Wine - Absolutely Everything! for Wine-Making, 2009.
- [3] R. David, D. Dochain, J.-R. Mouret, A. Vande Wouwer, and J.-M. Sablayrolles. Dynamical modeling of alcoholic fermentation and its link with nitrogen consumption. In Proceedings of the 11th International Symposium on Computer Applications in Biotechnology (CAB 2010), pages 496–501, 2010.
- [4] H.H. Dittrich and M. Großmann. Mikrobiologie des Weines. Ulmer, fourth edition, 2011.
- [5] B. Houska, H.J. Ferreau, M. Vukov, and R. Quirynen. ACADO Toolkit User’s Manual, 2009–2013. http://www.acadotoolkit.org.