Abundance Differences Between Exoplanet Binary Host Stars XO-2N and XO-2S – Dependence on Stellar Parameters∗
Abstract
The chemical composition of exoplanet host stars is an important factor in understanding the formation and characteristics of their orbiting planets. The best example of this to date is the planet-metallicity correlation. Other proposed correlations are thus far less robust, in part due to uncertainty in the chemical history of stars pre- and post-planet formation. Binary host stars of similar type present an opportunity to isolate the effects of planets on host star abundances. Here we present a differential elemental abundance analysis of the XO-2 stellar binary, in which both G9 stars host giant planets, one of which is transiting. Building on our previous work, we report 16 elemental abundances and compare the (XO-2N–XO-S) values to elemental condensation temperatures. The (N-S) values and slopes with condensation temperature resulting from four different pairs of stellar parameters are compared to explore the effects of changing the relative temperature and gravity of the stars. We find that most of the abundance differences between the stars depend on the chosen stellar parameters, but that Fe, Si, and potentially Ni are consistently enhanced in XO-2N regardless of the chosen stellar parameters. This study emphasizes the power of binary host star abundance analysis for probing the effects of giant planet formation, but also illustrates the potentially large uncertainties in abundance differences and slopes induced by changes in stellar temperature and gravity.
1 Introduction
The first indication that stellar composition plays a role in, and may be affected by, the formation of planets was the enhanced metallicity (parameterized as [Fe/H]111 [X/H]=log(NX/NH) - log (NX/NH)solar) of solar-type exoplanet host stars (Gonzalez 1997). While initially suggested as a sign of accretion of hydrogen-depleted material onto the star, the planet-metallicity correlation is now established as a mostly primordial effect (e.g., Santos et al. 2004; Fischer & Valenti 2005). Recently, the correlation was shown to be dependent on planet mass (e.g., Sousa et al. 2008; Ghezzi et al. 2010), being the weakest for terrestrial-sized planets (e.g., Buchhave et al. 2014). If host star metallicity is considered a proxy for heavy element concentration in the protoplanetary disk, this planet mass dependence seems to support the core accretion process of planet formation, as a larger concentration of heavy elements is needed to form giant planet cores (10 ME; Ida & Lin 2004) rapidly enough to allow time for gaseous envelope accretion (100 ME; Pollack et al. 1996) prior to gas disk dissipation after a few million years (e.g., Wyatt et al. 2008).
Is it still possible that planet formation may alter host star composition? Meléndez et al. (2009; M09) suggest the Sun is deficient by 20% in refractory elements, with condensation temperatures 900 K, relative to volatile elements when compared to “solar twins” without detected planets. M09, as well as studies finding similar results (e.g., Ramírez et al. 2010; Gonzalez et al. 2010), interpret the negative [X/H] or [X/Fe] vs Tc slopes of refractory elements as a star “missing” rock-forming material that has been sequestered in terrestrial planets (Chambers 2010). However, this interpretation has been questioned. Other studies have found no increase of negative slopes in hotter or more metal-rich stars (Ramírez et al. 2014); no difference in slopes between hosts/non-hosts after correcting for Galactic chemical evolution (Schuler et al. 2011b), correlations between the slope and stellar age and log (Adibekyan et al. 2014); and even the opposite of expected trends – positive/negative slopes in small/giant planet hosts (González Hernández et al. 2011). To complicate the picture, stars hosting close-in giant planets may instead accrete refractory-rich material that would have formed small planets (e.g., Raymond et al. 2011; Schuler et al 2011b).
Thus, if/how planet formation influences stellar composition remains uncertain, and is challenging to disentangle from the local or global composition of the disk and the star’s position in/motion through the Galaxy (e.g., Önehag et al. 2014; Schuler et al. 2011b). Binary host stars provide an opportunity for constraining how planet formation affects host stars, as they likely experience similar environments throughout their evolution (e.g., Kratter 2011). Desidera et al. (2004; 2006) found that the majority of 50 wide binaries (not known to host planets) had [Fe/H]0.03, suggesting larger metallicity differences are exceptional. Gratton et al. (2001) examined six wide binaries across a larger range of elements, finding that four had identical abundances. However, two stars were significantly different, with [Fe/H]=0.0530.014 and 0.0910.006 and similar differences for other refractory elements; the authors suggested these differences were due to pollution by dusty protoplanetary disk or rocky planetary material. Radial velocity (RV) monitoring of both “polluted” systems to search for planets has been inconclusive due to changing stellar activity cycles. Within binary systems known to host planets, the results are also ambiguous: There is not yet consensus on the significance of differences between 16 Cyg A and B (the latter hosts a 2.4 MJ planet; Schuler et al. 2011a; Ramírez et al. 2011; Tucci Maia et al. 2014), and similar studies indicate no abundance differences between stars in a single-host (HAT-P-1, Liu et al. 2014) and dual-host (HD 20782/1, Mack et al. 2014) systems.
Recently, RV monitoring of the southern component (XO-2S; 0.980.05 M⊙; Desidera et al. 2014) of the 4600 AU binary XO-2 revealed two giant (0.26 MJ, 1.37 MJ), slightly eccentric (0.18, 0.15) exoplanets at 0.13 and 0.48 AU (Desidera et al. 2014). XO-2N (0.980.02 M⊙; Burke et al. 2007) was already known to host a transiting hot Jupiter (0.62 MJ, =0, = 0.04 AU). This system is one of only four known dual-planet-hosting binaries (XO-2, HD 20782/1, Kepler-132, and WASP-94). Here we expand the analysis of Teske et al. (2013) to investigate whether there are abundance differences between the stars, how such differences depend on derived stellar parameters, and how they may relate to the formation of different types of planets.
2 Observations and Data Analysis
The observations and data reduction for XO-2N and -2S are detailed in Teske et al. (2013). The 60,000, S/N170-230 data were acquired in February 2012 with the High Dispersion Spectrograph at the 8.2 m Subaru Telescope, and reduced using standard techniques with the IRAF222IRAF is distributed by the National Optical Astronomy Observatory, which is operated by the Association of Universities for Research in Astronomy, Inc., under cooperative agreement with the National Science Foundation. software package.
2.1 Original Stellar Parameters
The stellar parameter analysis and uncertainty calculations are also explained in Teske et al. (2013) and listed in Table 1. The abundances were determined using the local thermodynamic equilibrium (LTE) spectral analysis code MOOG (Sneden 1973), with model atmospheres interpolated from the Kurucz ATLAS9 NOVER grids333See http://kurucz.harvard.edu/grids.html.. Equivalent widths were measured with ‘splot’ in IRAF, and abundances were normalized to solar, derived from a reflected-moonlight spectrum taken with the same configuration during the same run, on a line-by-line basis. In XO-2N, 49 Fe I and 8 Fe II lines were measured; in XO-2S, 49 Fe I and 10 Fe II lines were measured; the line properties and equivalent widths are provided in Table 2.
2.2 Alternative Stellar Parameters
As shown in recent studies of GAIA benchmark stars (Jofre et al. 2014) and transiting exoplanet host stars (e.g., Torres et al. 2012), different analysis methods lead to different stellar parameters and thus different abundances. To investigate this effect thoroughly, particularly the different Teffs, we explored several alternative methods, used widely in other exoplanet host star studies, for deriving stellar parameters for XO-2N and -2S.
Alternative Parameter Set 1 First, we repeated our analysis relative to solar, using by-hand IRAF measurements of the lines in Ghezzi et al. (2010). This list includes a smaller number of Fe I and II lines (in our case 23 Fe I for N/S, and 9/10 Fe II for N/S), but all have lab-measured and thus more reliable gf-values. Kurucz ATLAS9 ODFNEW grids were used as input models, though the difference between NOVER and ODFNEW are insignificant. The resulting parameters are listed as “Alt Param 1” in Table 1.
Alternative Parameter Set 2 Second, we adopted the full analysis approach of Ghezzi et al. (2010) and derived parameters based on absolute abundances, not relative to solar. The Ghezzi et al. (2010) line list, with lab-measured gf-values, was compiled specifically for an absolute analysis. Again, the measurements were done by-hand in IRAF and the stellar models were ODFNEW, using the same EWs as “Alt Param 1”. The resulting parameters, are listed as “Alt Param 2” in Table 1.
Alternative Parameter Set 3 Third, we used ODFNEW models with a different and longer line list of 72/67 Fe I and 9/8 Fe II lines for N/S, compiled from Sousa et al. (2008). The equivalent widths were measured with ARES (Sousa et al. 2007); lines 0.30 dex from the average in the Sun were removed and an interative 2 clipping was applied to the stars during the parameter determination. The resulting parameters are listed as “Alt Param 3” in Table 1.
2.3 Parameter Comparison
In almost every case, within 1 total errors all derived parameter pairs for XO-2N and -2S overlap, indicating the stars are similar, potentially identical, but could also differ by as much as 200 K in Teff, 0.25 dex in log , 0.10 in [Fe/H], and 0.07 km/s in . In the first three parameter sets, Teff of XO-2N XO-2S, which agrees with the original XO-2Nb discovery paper (Burke et al. 2007), Teffs calculated from the IRFM photometric calibration of Casagrande et al. (2010) using colors from Burke et al. (2007), and the recent analysis of HARPS-N spectra by Damasso et al. (2015). The original and alternative parameter set 3 both find log log , while alternative parameters 1 and 2 find the opposite; however, given the log errors, the magnitude of log between the two stars is uncertain (and could be zero). Interestingly, a higher [Fe/H] in XO-2N is consistent across all derived parameters; this also concurs with Damasso et al. (2015). Despite the possibility of the stars having the same [Fe/H] within errors, the fact that all four parameter sets – found using different lines measurements and analyses techniques – find [Fe/H][Fe/H]S points towards a real metallicity difference. We return to this point in §3.
2.4 Other Elemental Abundances
All abundances were derived directly from equivalent width (EW) measurements performed with the ‘splot’ task in IRAF, except [O/H], which was derived through spectral synthesis in MOOG. Abundance determinations of Fe, Ni, C, and O are detailed in Teske et al. (2013). For elements new to this work, line lists (Table 2) were compiled from Meléndez et al. (2014) and Schuler et al. (2011b); atomic parameters are from numerous sources and compiled in VALD (Piskunov et al. 1995). All (N-S) abundance differences are listed in Table 3.
The only element besides Fe for which we measured two ionization states was titanium. We removed 1 outliers based on the mean and standard deviation of the line-by-line solar-normalized abundances. This procedure changed the [Ti I/H] and [Ti II/H] values by 0.025, but reduced the dispersion in the abundances by roughly a factor of two.
Bergemann (2011) found the discrepancy between solar Ti I and II is solved by including non-LTE line formation, and suggested that Ti II may be a better [Ti/H] indicator in solar-type stars. We tested whether non-LTE corrections to Ti I lines in XO-2N and -2S, calculated using statistical equilibrium and line formation codes described in Bergemann (2011) and MAFAGS-OS models with the same stellar parameters derived here, change the [Ti I/H] values. We find these corrections do not significantly alter [Ti I/H], but as these are the first non-LTE corrections calculated for cool, metal-rich stars, we provide the A(Ti I)NLTE-A(Ti I)LTE corrections in Table 2. We report a total [Ti/H] based on the lines of both species, with 1 outliers removed within each species as described above.
3 Results and Discussion
The results of our measurements are in Table 2, including wavelength, , log , EWs for each element for the Sun, XO-2N, and XO-2S. The final derived stellar parameters and their 1 uncertainties are in Table 1, and the (X/H) and values calculated on a line-by-line basis for XO-2S–XO-2S are in Table 3. Next we discuss the resulting abundances from the four different parameter sets derived above.
3.1 Relative Abundances versus Tc
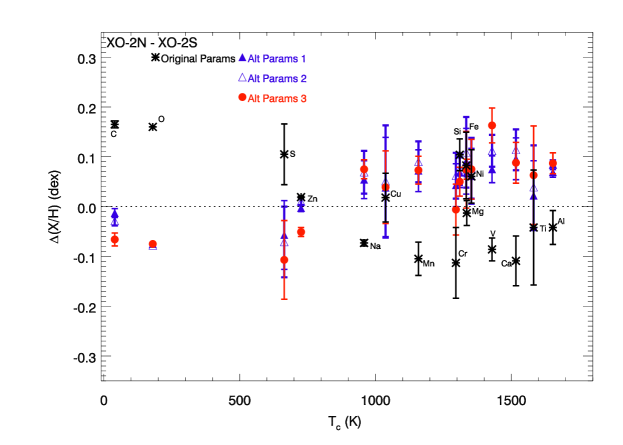
The advantage of studying binary stars is the likelihood that their formation environments were similar, so their compositions – assuming like XO-2N and -2S they are of similar mass and temperature – should also be similar. Small differences in binary star abundances were previously suggested to be related to planet formation/migration (e.g., Tucci-Maia et al. 2014). To investigate the XO-2 system for such abundance differences, we compare one star directly to the other, (XO-2N - XO-2S). In Figure 1 we show the line-by-line (N-S) differences and standard deviations of the differences (error bars) for our four parameter sets.
The black asterisks in Figure 1 represent the largest possible differences between (N-S) – -204 K Teff, 0.27 dex log , and 0.11 dex [Fe/H]. Based on these differences, XO-2N may have less refractories than XO-2S, save a few elements – Si, Fe, and Ni. These “original” parameter results also imply XO-2N is enhanced in volatile elements; the slope for T500 K elements is negative (1.66E-4 dex/K).
However, the abundance differences, and thus slopes, change with different stellar parameters, as suggested in §2. Using a smaller line list, relative-to-solar/absolute results in the blue closed/open triangles in Figure 1. These parameters correspond to (N-S) differences of -83/-72 K Teff, -0.09/-0.11 dex log , and 0.09/0.11 dex [Fe/H]. Interestingly the relative-to-solar and absolute analyses produce a very similar pattern, indicating that XO-2N is enhanced in most refractory elements and depleted in volatiles. The red points in Figure 1 represent abundances represent parameters derived from a longer line list than the “original” parameter set, with measurements made with ARES, and (N-S) differences of 3 K Teff, 0.06 dex log , and 0.08 dex [Fe/H]. These abundance differences show an even greater enhancement/depletion in XO-2N of refractory/volatile elements versus the abundances marked with blue triangles.
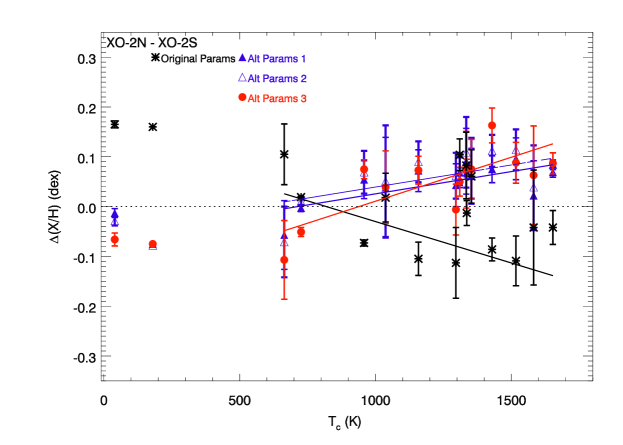
The different (N-S) abundances, and corresponding Tc-slopes, resulting from different stellar parameters make it challenging to conclude whether any of the enhancements/depletions between XO-2N and -2S are real, within the bounds of measurement errors. To investigate how dependent the abundance differences are on Teff and log , which change the most between our different analyses, we used the same EWs and three test parameter sets that varied only in log . For these tests, we adopted Teff -130 K (N-S), based on the spread of the points in Figure 1; this Teff is between the Teffs of the black asterisks (-204 K) and red circles (3 K). Specifically, the parameters for XO-2N/S were 5390/5520 K, 0.43/0.33 dex [Fe/H], and 1.20 km/s for , with log varying between 4.30/4.40, 4.35/4.35, and 4.40/4.30.
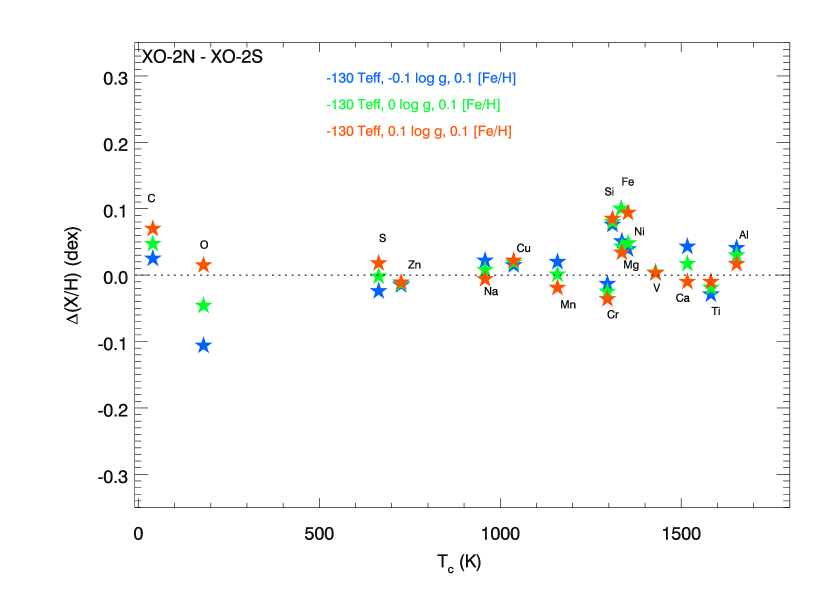
The results of changing log between XO-2N and -2S are shown in Figure 2 as blue (-0.1 dex), green (0 dex), and orange (0.1 dex) stars.Changing log has a minimal effect on the abundance differences, except for (O/H), which is known to depend strongly on log . For most elements, the log tests result in (N-S) abundances of 0, falling somewhere in between the black, blue, and red points from Figure 1.
However, in all three tests in Figure 2, the abundances of Si, Fe, and Ni are still above the zero difference line. This is remarkably consistent with all four parameter sets derived in §2 and plotted in Figure 1, which all show Si, Fe, and possibly Ni enhancements in XO-2N. Varying many different aspects of the analysis and stellar parameters does not alter this enhancement pattern, providing strong evidence for a real abundance difference in Si, Fe, and Ni between XO-2N and -2S.
3.1.1 Possible Causes of Abundance Pattern
Robinson et al. (2006) and Brugamyer et al. (2011) found differences in [Si/Fe] between known host and non-host stars; Robinson et al. (2006) also found that host stars are enhanced in nickel. While these studies compare known hosts and non-hosts, they point specifically at Si and Ni as important to giant planet formation. This is interesting given these are two elements we find enhanced in XO-2N, the hot Jupiter host. Indeed, plotting Brugamyer et al. (2011)’s [Si/H] values against planet semi-major axis shows a dearth of silicon-poor hosts to close-in ( AU) planets, suggesting that silicon may play a role in close-in giant planet formation.
The enrichment of certain elements in XO-2N could be due to accretion of material preferentially enhanced in these elements. Simulations have shown that a significant fraction of giant planets migrating in disks as a result of planet-planet scattering cause much, if not all, of rocky disk material to be accreted onto the star (Raymond et al. 2011). The RV evidence for a second object orbiting XO-2N (Damasso et al. 2015; Knutson et al. 2014; Narita et al. 2011) adds weight to the planet-planet scattering migration scenario (Rasio & Ford 1996; Nagasawa et al. 2008), by which XO-2Nb could have migrated inward and subsequently had its eccentricity and spin-orbit alignment angle damped (Narita et al. 2011).
XO-2S’s lesser amount of Fe, Si, and Ni may instead indicate that these elements are important to small planet formation; XO-2S may have formed small planets that were ejected. Kaib et al. (2013) specifically studied wide binaries, finding that 70% of 1 M⊙-1 M⊙ systems with the separation of XO-2N and -2S were unstable and ejected a planet within 10 Gyr. Based on dynamical simulations of wide binary planet systems, Morbidelli (2014) found that 73% of planets are ejected, and that 60% of wide binaries, versus 41% of isolated systems, lost a planet.
3.2 Comparison to Other Host Star Binary Studies
In all parameter cases, a few refractory elements (Si, Fe, Ni) stand out as enhanced in the cooler XO-2N. This pattern is different from other abundance studies of binary exoplanet hosts. Liu et al. (2014) found [X/H] values consistent with zero in the HAT-P-1 G0+F8 binary. Though there is not consensus regarding differences between 16 Cyg A (G1.5) and B (G3), the proposed differences (Ramírez et al. 2011; Tucci Maia et al. 2014) either show 0.04 dex uniform depletion with Tc, or a range of depletions increasing with Tc at the -0.03 to -0.05 dex level. (We switched A-B values to B-A, to stay consistent with cooler-hotter star.) Mack et al. (2014), who measured the double-host binary HD20781/HD20782 (G9.5/G1.5), show in their Figure 3 non-zero differences for O, Al, V, Cr, Fe, and Co. Are we seeing an effect in [X/H] trends due to Teff, moving from hotter stars and no differences to cooler stars and more significant differences? Right now this question is hard to answer due to different analysis techniques, line lists, and the host star nature of these systems (whether or not both stars host planets). In Gratton et al. (2001)’s Figure 1, plotting [Fe/H] versus Teff for stars without confirmed planets, there is no clear pattern – [Fe/H] is near zero for stars with Teff 10, 90, 275, and 330 K, and [Fe/H] = 0.05 and 0.09 for stars with Teff 120 and 275 K. Desidera et al. (2006)’s data hint at larger [Fe/H] differences at larger Teffs, but Desidera et al. (2004)’s data show no real dependence of [Fe/H] on Teff. More uniform abundances studies, and a larger sample, are needed to understand the temperature dependence of binary host star abundance differences and whether they are related to planet formation.
4 Conclusions
We performed a detailed stellar abundance analysis on XO-2N and XO-2S, binary stars of similar temperature and mass that host planets of different types, to look for effects of planet formation. Though binary stars are expected to have approximately identical abundances, some studies report differences between host stars that may be due to planet formation.
When comparing the stars relative to one another, there are hints of abundance differences. We test how dependent these differences, and the (X/H) slopes with Tc, are on stellar parameters using two different line lists, solar-normalized and absolute abundance analyses, and measurements made by hand in IRAF and automatically with ARES. Most of the resulting (X/H) values vary widely, but a few refractory elements – Si, Fe, and possibly Ni – consistently appear to be enhanced in XO-2N. This pattern is independent of analysis method and adopted Teff and log value, giving confidence to the conclusion that XO-2N and -2S have real abundance differences.
This work adds to the few binary host star analyses, which may prove to be the most useful for constraining both the effects of planet formation on stellar abundances, and the bulk compositions of giant exoplanets. However, it also illustrates how sensitive binary host star abundances and Tc slopes are to derived stellar parameters; such studies approach the limit of measurement errors and should be considered carefully.
References
- Adibekyan et al. (2014) Adibekyan, V. Z., González Hernández, J. I., Delgado Mena, E., et al. 2014, A&A, 564, LL15
- Bergemann & Gehren (2008) Bergemann, M., & Gehren, T. 2008, A&A, 492, 823
- Brugamyer et al. (2011) Brugamyer, E., Dodson-Robinson, S. E., Cochran, W. D., & Sneden, C. 2011, ApJ, 738, 97
- Buchhave et al. (2014) Buchhave, L. A., Bizzarro, M., Latham, D. W., et al. 2014, Nature, 509, 593
- Burke et al. (2007) Burke, C. J., et al., 2007, ApJ, 671, 2115
- Casagrande et al. (2010) Casagrande, L., Ramírez, I., Meléndez, J., Bessell, M., & Asplund, M. 2010, A&A, 512, AA54
- Chambers (2010) Chambers, J. E. 2010, ApJ, 724, 92
- (8) Damasso, M., Biazzo, K., Bonomo, A. S., et al. 2015 arXiv:1501.01424
- Desidera et al. (2004) Desidera, S., Gratton, R. G., Scuderi, S., et al. 2004, A&A, 420, 683
- Desidera et al. (2006) Desidera, S., Gratton, R. G., Lucatello, S., & Claudi, R. U. 2006, A&A, 454, 581
- Desidera et al. (2014) Desidera, S., Bonomo, A. S., Claudi, R. U., et al. 2014, A&A, 567, L6
- Fischer & Valenti (2005) Fischer, D. A., & Valenti, J. 2005, ApJ, 622, 1102
- Ghezzi et al. (2010) Ghezzi, L., Cunha, K., Smith, V. V., de Araújo, F. X., Schuler, S. C., de la Reza, R., 2010, ApJ, 720, 1290
- Gonzalez (1997) Gonzalez, G. 1997, MNRAS, 285, 403
- Gonzalez et al. (2010) Gonzalez, G., Carlson, M. K., & Tobin, R. W. 2010, MNRAS, 407, 314
- González Hernández et al. (2011) González Hernández, J. I., Israelian, G., Santos, N. C., et al. 2011, 16th Cambridge Workshop on Cool Stars, Stellar Systems, and the Sun, 448, 879
- Gratton et al. (2001) Gratton, R. G., Bonanno, G., Claudi, R. U., et al. 2001, A&A, 377, 123
- Ida & Lin (2004) Ida, S., & Lin, D. N. C. 2004, ApJ, 616, 567
- Jofré et al. (2014) Jofré, P., Heiter, U., Soubiran, C., et al. 2014, A&A, 564, AA133
- Kaib et al. (2013) Kaib, N. A., Raymond, S. N., & Duncan, M. 2013, Nature, 493, 381
- Kratter (2011) Kratter, K. M. 2011, Evolution of Compact Binaries, 447, 47
- Knutson et al. (2014) Knutson, H. A., Fulton, B. J., Montet, B. T., et al. 2014, ApJ, 785, 126
- Liu et al. (2014) Liu, F., Asplund, M., Ramírez, I., Yong, D., & Meléndez, J. 2014, MNRAS, 442, L51
- Lodders (2003) Lodders, K. 2003, ApJ, 591, 1220
- Mack et al. (2014) Mack, C. E., III, Schuler, S. C., Stassun, K. G., & Norris, J. 2014, ApJ, 787, 98
- Meléndez et al. (2009) Meléndez, J., Asplund, M., Gustafsson, B., & Yong, D. 2009, ApJ, 704, L66
- Meléndez et al. (2014) Meléndez, J., Ramírez, I., Karakas, A. I., et al. 2014, ApJ, 791, 14
- (28) Morbidelli, A. 2014, Phil Trans R Soc A, 372, 20130072
- Nagasawa et al. (2008) Nagasawa, M., Ida, S., & Bessho, T. 2008, ApJ, 678, 498
- Narita et al. (2011) Narita, N., Hirano, T., Sato, B., Harakawa, H., Fukui, A., Aoki, W., Tamura, M., 2011, PASJ, 63, L67
- Önehag et al. (2014) Önehag, A., Gustafsson, B., & Korn, A. 2014, A&A, 562, A102 M. H., DePoy, D. L., & Coffee, M. 2001, ApJ, 556, L59
- Piskunov et al. (1995) Piskunov, N. E., Kupka, F., Ryabchikova, T. A., Weiss, W. W., & Jeffery, C. S. 1995, A&AS, 112, 525
- Pollack et al. (1996) Pollack, J. B., Hubickyj, O., Bodenheimer, P., et al. 1996, Icarus, 124, 62
- Ramírez et al. (2010) Ramírez, I., Asplund, M., Baumann, P., Meléndez, J., & Bensby, T. 2010, A&A, 521, A33
- Ramírez et al. (2011) Ramírez, I., Meléndez, J., Cornejo, D., Roederer, I. U., & Fish, J. R. 2011, ApJ, 740, 76
- Ramírez et al. (2014) Ramírez, I., Meléndez, J., & Asplund, M. 2014, A&A, 561, A7
- Rasio & Ford (1996) Rasio, F. A., & Ford, E. B. 1996, Science, 274, 954
- Raymond et al. (2011) Raymond, S. N., Armitage, P. J., Moro-Martín, A., et al. 2011, A&A, 530, A62
- Robinson et al. (2006) Robinson, S. E., Laughlin, G., Bodenheimer, P., & Fischer, D. 2006, ApJ, 643, 484
- Santos et al. (2004) Santos, N. C., Israelian, G., & Mayor, M. 2004, A&A, 415, 1153
- Schuler et al. (2011) Schuler, S. C., Flateau, D., Cunha, K., King, J. R., Ghezzi, L., Smith, V. V., 2011b, ApJ, 732, 55
- Schuler et al. (2011) Schuler, S. C., Cunha, K., Smith, V. V., Ghezzi, L., King, J. R., Deliyannis, C. P., Boesgaard, A. M., 2011a, ApJ, 737, L32
- Sneden (1973) Sneden, C. 1973, ApJ, 184, 839
- Sousa et al. (2008) Sousa, S. G., Santos, N. C., Mayor, M., et al. 2008, A&A, 487, 373
- (45) Sousa, S. G., Santos, N. C., Israelian, G., et al. 2007, A&A, 469, 783
- Teske et al. (2013) Teske, J. K., Schuler, S. C., Cunha, K., Smith, V. V., & Griffith, C. A. 2013, ApJ, 768, L12
- Torres et al. (2012) Torres, G., Fischer, D. A., Sozzetti, A., et al. 2012, ApJ, 757, 161
- Tucci Maia et al. (2014) Tucci Maia, M., Meléndez, J., & Ramírez, I. 2014, ApJ, 790, L25
- Valenti & Piskunov (1996) Valenti, J. A., & Piskunov, N. 1996, A&AS, 118, 595
- Wyatt (2008) Wyatt, M. C. 2008, ARA&A, 46, 339
| Parameters | Teff (K) | error | log (cgs) | error | (km s-1) | error | error | line list | relative to solar? | IRAF/ARES | |
|---|---|---|---|---|---|---|---|---|---|---|---|
| Orig Params, XO-2S | 5547 | 59 | 4.22 | 0.24 | 1.24 | 0.07 | 0.28 | 0.14 | 49 Fe II, 10 Fe II | yes | IRAF |
| Orig Params, XO-2N | 5343 | 78 | 4.49 | 0.25 | 1.22 | 0.09 | 0.39 | 0.14 | 49 Fe II, 8 Fe II | yes | IRAF |
| Alt Params 1, XO-2S | 5523 | 49 | 4.44 | 0.11 | 1.35 | 0.08 | 0.36 | 0.04 | 23 Fe I, 10 Fe II | yes | IRAF |
| Alt Params 1, XO-2N | 5440 | 69 | 4.35 | 0.19 | 1.29 | 0.09 | 0.45 | 0.06 | 23 Fe I, 9 Fe II | yes | IRAF |
| Alt Params 2, XO-2S | 5447 | 47 | 4.36 | 0.11 | 1.08 | 0.06 | 0.28 | 0.04 | 23 Fe I, 10 Fe II | no | IRAF |
| Alt Params 2, XO-2N | 5375 | 78 | 4.25 | 0.20 | 1.02 | 0.11 | 0.39 | 0.07 | 23 Fe I, 9 Fe II | no | IRAF |
| Alt Params 3, XO-2S | 5403 | 39 | 4.40 | 0.13 | 1.06 | 0.07 | 0.39 | 0.06 | 67 Fe I, 8 Fe II | yes | ARES |
| Alt Params 3, XO-2N | 5406 | 32 | 4.46 | 0.08 | 1.11 | 0.05 | 0.47 | 0.05 | 72 Fe I, 9 Fe II | yes | ARES |
| Ion | log | EW⊙ | XO-2S | XO-2N | ||
|---|---|---|---|---|---|---|
| (Å) | (eV) | (dex) | (mÅ) | EW (mÅ) | EW (Å) | |
| C I | 5052.17 | 7.86 | -1.304 | 33.9 | 36.4 | 33.0 |
| 5380.34 | 7.69 | -1.615 | 19.4 | 22.4 | 20.5 | |
| O I | 6300.30 | 0.00 | -9.717 | |||
| Na I | 4751.82 | 2.10 | -2.078 | 13.1 | 48.0 | |
| 5148.84 | 2.10 | -2.044 | 12.4 | 42.0 | 45.8 | |
| 6154.23 | 2.10 | -1.547 | 36.2 | 82.9 | 89.3 | |
| 6160.75 | 2.10 | -1.246 | 55.4 | 103.7 | 113.0 |
Note. — This table is available in its entirety in a machine-readable form online.
| (X/H) | Orig N-S | Orig (N-S) | AP 1 N-S | AP 1 (N-S) | AP 2 N-S | AP 2 (N-S) | AP 3 N-S | AP 3 (N-S) |
|---|---|---|---|---|---|---|---|---|
| (C/H) | 0.165 | 0.007 | -0.013 | 0.009 | -0.029 | 0.009 | -0.066 | 0.013 |
| 0.16 | -0.075 | -0.078 | -0.075 | |||||
| -0.073 | 0.006 | 0.054 | 0.038 | 0.069 | 0.043 | 0.075 | 0.019 | |
| -0.013 | 0.025 | 0.066 | 0.009 | 0.079 | 0.008 | 0.075 | 0.020 | |
| -0.042 | 0.066 | 0.069 | 0.010 | 0.084 | 0.009 | 0.087 | 0.021 | |
| 0.104 | 0.032 | 0.068 | 0.030 | 0.075 | 0.032 | 0.050 | 0.029 | |
| 0.105 | 0.061 | -0.057 | 0.069 | -0.071 | 0.071 | -0.107 | 0.079 | |
| -0.109 | 0.050 | 0.096 | 0.042 | 0.114 | 0.041 | 0.088 | 0.041 | |
| -0.042 | 0.115 | 0.022 | 0.070 | 0.039 | 0.084 | 0.063 | 0.099 | |
| -0.086 | 0.023 | 0.075 | 0.027 | 0.112 | 0.032 | 0.163 | 0.035 | |
| -0.113 | 0.071 | 0.043 | 0.043 | 0.062 | 0.046 | -0.006 | 0.051 | |
| -0.105 | 0.033 | 0.072 | 0.042 | 0.090 | 0.041 | 0.073 | 0.028 | |
| 0.083 | 0.067 | 0.091 | 0.066 | 0.109 | 0.071 | 0.074 | 0.077 | |
| 0.061 | 0.054 | 0.061 | 0.056 | 0.077 | 0.061 | 0.075 | 0.060 | |
| 0.018 | 0.049 | 0.038 | 0.101 | 0.051 | 0.112 | 0.039 | 0.073 | |
| 0.019 | 0.002 | -0.003 | 0.007 | 0.010 | 0.008 | -0.051 | 0.009 |