Mesoscale simulations of shockwave energy dissipation via chemical reactions
We use a particle-based mesoscale model that incorporates chemical reactions at a coarse-grained level to study the response of materials that undergo volume-reducing chemical reactions under shockwave-loading conditions. We find that such chemical reactions can attenuate the shockwave and characterize how the parameters of the chemical model affect this behavior. The simulations show that the magnitude of the volume collapse and velocity at which the chemistry propagates are critical to weaken the shock, whereas the energetics in the reactions play only a minor role. Shock loading results in transient states where the material is away from local equilibrium and, interestingly, chemical reactions can nucleate under such non-equilibrium states. Thus, the timescales for equilibration between the various degrees of freedom in the material affect the shock-induced chemistry and its ability to attenuate the propagating shock.
I Introduction
When materials are subject to dynamical mechanical loads (shockwaves) a plethora of complex processes are launched in response to the insult. These can include plastic deformation, HolianScience1998 ; BringaScience2005 ; LoveridgePRL2001 , phase transitions, KadauScience2002 ; KalandarPRL2005 ; Erskine1991 , chemical reactions YangJAP2004 ; StrachanPRL2003 , and even electronic transitions ReedNatPhys2008 . Studying the response of different materials to shockwaves has resulted in significant insight into the response of materials under extreme conditions.DlottARPC2011 In most cases, when solid materials are shocked above a threshold strength, known as the Hugoniot elastic limit, plastic deformation nucleates behind the shock front to release the compressive stress along the shock direction and minimize free energy by achieving a more hydrostatic state. GermannPRL2000 ; JaramilloPRB2007 This stress relaxation weakens the leading shockwave, often resulting in a two-wave structure, with a leading elastic wave followed by a plastic wave that propagates at slower speeds; similar two-wave structures have been found in shock induced martensitic transformations KadauScience2002 . In the case of explosives, exothermic reactions that lead to low density products can enhance the initial shockwave and transform it into a detonation wave. For this to happen, the chemical reactions have to generate enough energy and pressure. However, thermodynamics alone is not sufficient; fast reaction kinetics are critical to significantly affect a traveling shockwave.
Materials that dissipate or absorb the energy in shockwaves causing the shock front to weaken as it propagates are of interest for protection against impacts, collisions and blasts. Impact resistant materials include fiber composites kevlar and ceramic/metal armor lopez2005effect . There has been growing interest in softer materials capable of absorbing shockwave energy via molecular-level processes. Polyurea, a polymer with glass transition below room temperature, has been shown effective at absorbing energy in ballistic impact tests. bogoslovov2007impact While the mechanisms for the high energy absorption capability at high strain rates are not fully understood, a transition to the glassy state is believed to play a key role. bogoslovov2007impact ; grujicic2010computational ; grujicic2013coarse Materials with very high porosity at the nanoscale, such as metal organic frameworks, are also attracting attention for such applications as void collapse can contribute to weaken the shockwave Yot2014 .
In this paper, we explore the possibility of using chemical reactions in molecular systems for shock wave energy absorption; specifically endothermic, volume reducing chemistry. We use a recently developed model for coarse grain simulations for a class of model materials that exhibit the desired behavior at the molecular level and and study the mechanisms through which shock energy dissipation can occur. Our objective is to understand requirements of such shockwave energy dissipating (SWED) materials and to establish how the characteristics of the chemical reactions affect its ability to weaken shocks. We foresee this knowledge could contribute to experimental design efforts. Our simulations demonstrate that a chemical reaction front involving endothermic, volume-reducing chemistry can propagate fast enough to couple with the leading shockwave and weaken it. The results also shed light on how the nucleation and propagation of such chemical reactions occur under dynamical loading.
The paper is organized as follows. Section II introduces ChemDID, the coarse grain model used to investigate shock-induced chemistry and the family of model materials to be characterized. Section III discusses the response of materials that can undergo volume reducing chemistry to shock loading and relate characteristics of the chemical reactions and the ability of the materials to weaken shocks. Section IV discusses the molecular processes that govern the nucleation of chemistry behind the shockwave and Section V draws conclusions.
II Model and simulation details
II.1 ChemDID
ChemDID Antillon2014 is a coarse-grained, particle-based model that enables the description of stress-induced chemical reactions involving degrees of freedom (DoF) internal to the mesoparticles. Unlike all-atom MD, where particles represent atoms, in ChemDID particles describe extended objects, molecules in this paper. Such molecules will be represented by a spheres with 3N-3 internal DoFs (for an N atom molecule), out of which we will single out one of them to describe the chemical reactions in the molecule while the rest will be treated via the equipartition theorem.
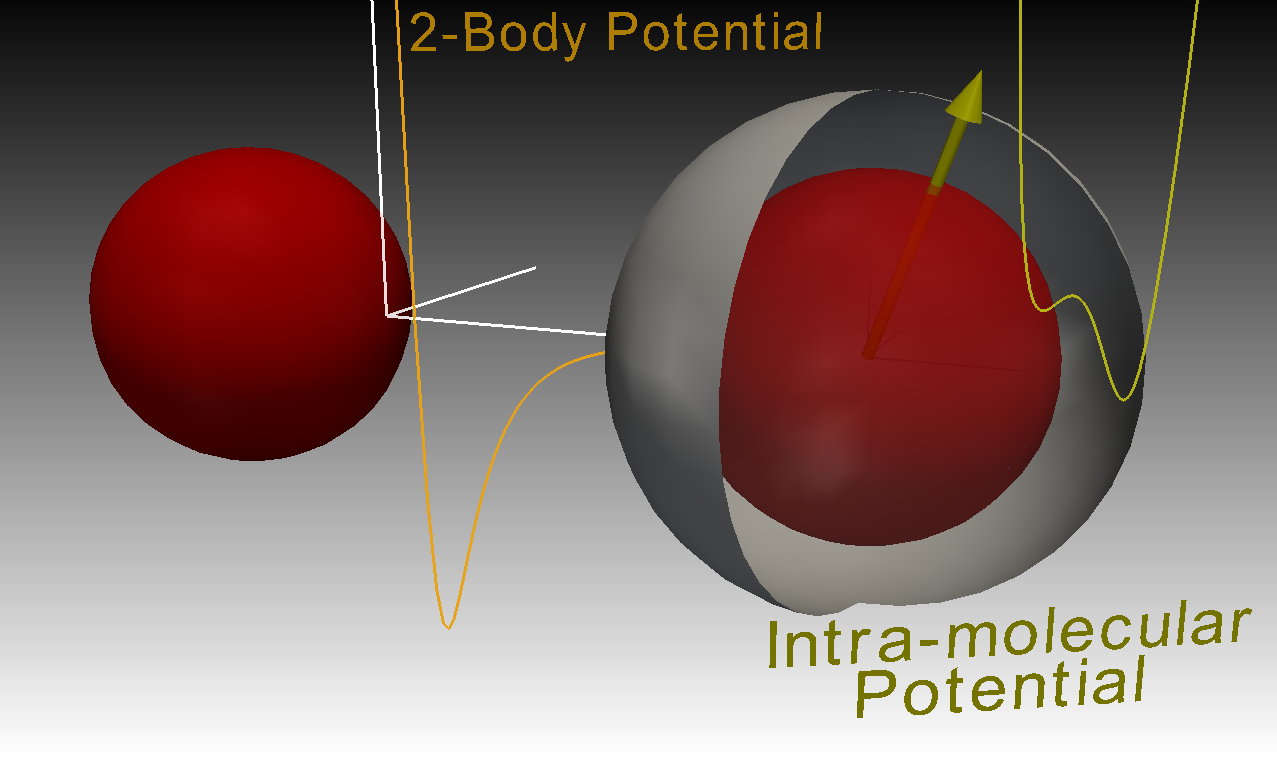
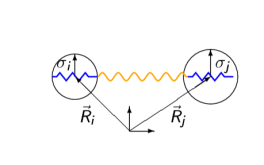
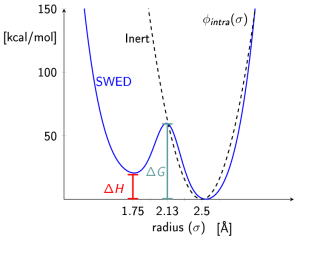
The variable singled out will represents the molecular radius (), and is described with explicit Hamiltonian dynamics and an associated potential energy that can enable chemical reactions. The remaining 3N-4 DoFs are described in an averaged form using the approach proposed in Ref. StrachanPRL2005 . Their state is described by a single dynamical variable that represent their temperature. Thus, the complexity of many-body intra-molecular interactions, including the desired volume collapsing reactions, is reduced to an Intra-molecular potential inspired in transition state theory, where the size of the mesoparticle is used as an order parameter that governs the transition between an initial high-volume low-energy state or a collapsed-low volume high-energy state; we will refer to such materials as SWED materials, while materials that do not undergo chemical reactions will be called Inert. Fig. 2 contrasts the two cases described. The non-bonded interactions between mesoparticles are described by pair-potentials which acts from surface to surface distance as shown in Figure 1.
 |
 |
| (a) | (b) |
The Hamiltonian of the system is:
| (1) |
where and describe the inter-molecular and intra-molecular potential terms, describes the translational momentum and associate mass of particle , and similarly describes the conjugate momentum to the breathing mode with its associated inertial parameter . A derivation of the equations of motions has been previously shown in Antillon2014
We note that the Hamiltonian does not account for the remaining 3N-4 internal DoFs of the molecules. These modes exchange energy with the Hamiltonian variables (center of mass position and molecular radius) and they are described with the approach proposed in Ref. StrachanPRL2005 . These internal DoFs are incorporated statistically and described by temperature (); they are coupled to the explicit DoFs via the position update equation such that energy flows to equalize the temperatures associated with the various degree of freedom: , that of the radial breathing mode and that of the c.m. of the molecules . The resulting equation of motion for the internal temperature, see Refs. StrachanPRL2005 ; LinJCP2014 , is:
| (2) |
where is the energy of the implicit DoFs, is their specific heat, and describe the strength of the internal-to-intermolecular coupling and the internal-to-radial coupling respectively, is a reference temperature, and the ratio ) provides a natural timescale for the corresponding interaction. Note that the magnitude and direction of the energy flow between internal DoFs and the molecular centers of mass (first term in the RHS of Eq. 2) and the breathing mode (second term) is governed by the difference in local temperatures such that heat flows from hot to cold. The total energy is a conserved quantity in ChemDID and it is given by
| (3) |
We remind the reader that although the above definition of temperatures only applies for equilibrium conditions after time or ensemble averages in the canonical ensemble, defining instantaneous and local values is useful to study processes out-of-equilibrium.
II.2 A model reactive molecular crystal
The parameterization of a ChemDID model involves determining inter-molecular and intra-molecular potentials, the molecular mass and the inertial parameter for the dynamics of the molecule radii and as well as the coupling constants, and , that describe the coupling between the internal DoFs and the molecular centers of mass and radii. In this paper we parameterized a model reactive material with thermo-mechanical properties similar to anthracene, a molecular material believed to be capable of endothermic, volume reducing chemistry; DFT calculations by Slepetz et al. slepetz show that the low-volume endothermic state of anthracene has an energy between 10-20 kcal/mol over the high-volume ground state.
We studied a family of intramolecular potential associated with the breathing mode in order to quantify how characteristics of the chemical reactions affect the shock weakening power of the material. We characterize the chemical reactions by three key parameters: i) volume collapse, ii) endothermicity, and iii) activation energy. The initial radius of the molecule is taken as = 2.50 Å, this value corresponds roughly to one of the dimensions that undergoes the greatest change in the anthracene molecule under the application of pressureslepetz ; Jezowski . The intra-molecular potential used takes the form:
| (4) |
,where and denote the low-volume and high-volume (meta)stable points, the parameter determines the overall curvature of the potential away from the (meta)stable points, while a Gaussian term (A,) controls the curvature of the region in-between, denotes the amount of endothermicity of the reaction for the collapsed state at , and the activation barrier will depend implicitly on both the Gaussian parameters (A,) and the overall curvature parameter . Table 1 shows the intramolecular potential parameters.
In determining the overall collapse of the molecule, the radius of the sphere and the inter-molecular separation will both play a role. In this paper, we quantify this volume-collapse in terms of its van der Waals radius
| (5) |
where van der Waals radius () will be given by the sum of the sphere’s hard-core radius () and a van der Waals skin (). The later depends on the intermolecular potential, discussed next, and takes the value to 1.07Å. A Morse potential will be used to describe its inter-molecular interactions, given by:
| (6) |
where the parameters , , and describe the cohesive energy, interaction range, and its curvature near its global minima; the values used are shown in Table 1. The ground state structure of such a system is the fcc crystal structure and the inter- and intra-molecular parameters chosen resulting a lattice parameter of Å. The molecular mass will be taken as g/mol, which has been used previously as a benchmark for molecular crystals and corresponds to an HMX-molecule JaramilloPRB2007 ; lynch2009coarse . This gives an equilibrium volume per molecule ( ) of 258.8 Å3, close to that of athracene (231.2 Å3). The equilibrium volume per molecule and the van der Waals volumes are related by the packing fraction , which corresponds to a value of 0.74 for an fcc arrangement.
|
 |
| (a) | (b) |
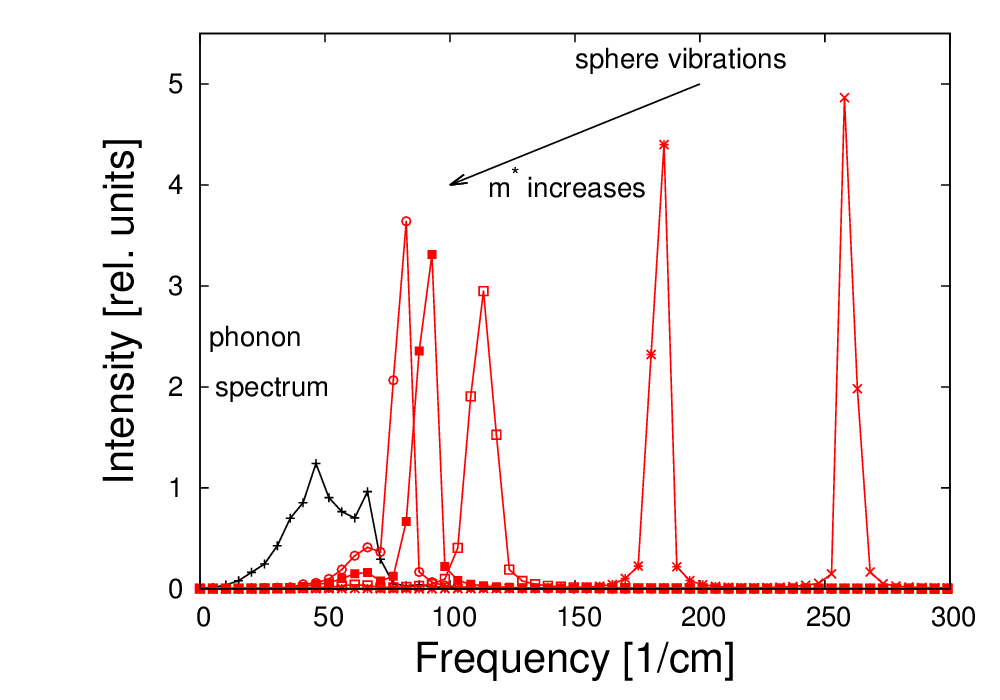
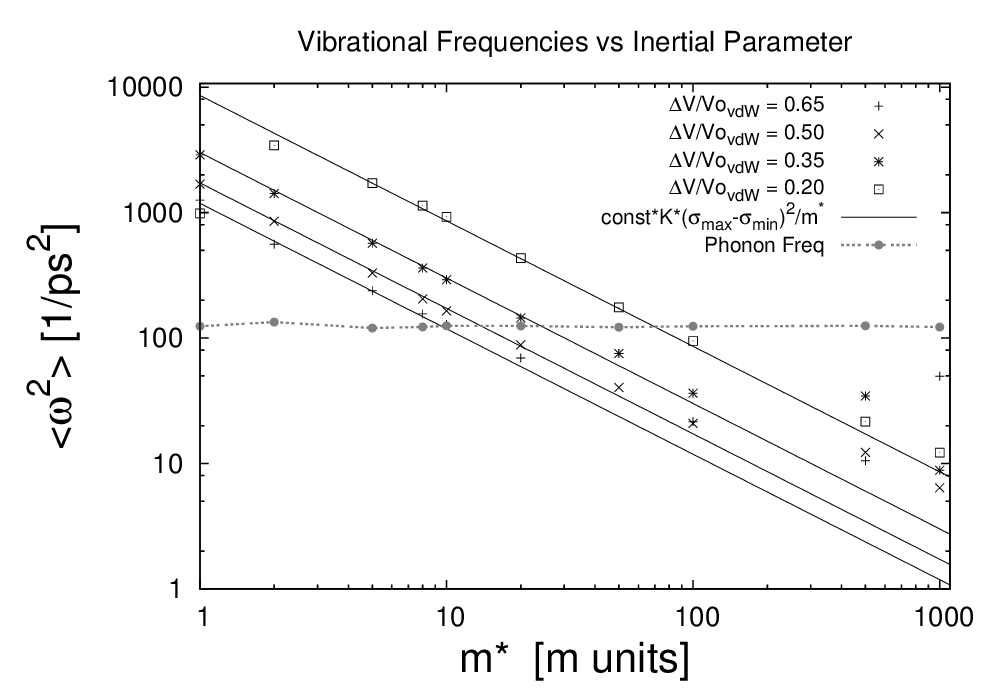
The remaining parameters in the model determine the coupling constants between the various DoFs and to do this it is useful to look at ChemDID the in terms of a coupled spring model, where a set of intra-molecular spring are in series with inter-molecular springs as shown in Fig. 2 (a). Similar vibrational frequencies between the intra-molecular and inter-molecular modes allow for an effective exchange of energy between them, while a significant difference will tend to decouple the two sets of modes. For this reason the rate of energy exchange between the translational mode () and radial modes () can be tuned by changing the inertia parameter() which increases the overlap between the intra-molecular (sphere modes) and the translational phonon spectrum, and therefore, leads to a stronger coupling. Figure 3 (a) shows the (un-normalized) vibrational spectrum for the breathing and the phonon modes for different values of the inertia parameter (). Figure 3 (b) shows the mean squared frequency , where is the normalized density of states in Figure 3 (a). Note that the value of is chosen as to bring the mean of the sphere vibrational frequency to the same range as the mean of the phonon vibrational frequency. Table 1 shows how these values depend on the compliance between the two springs.
| Internal Parameters | ||||||
| parameter | symbol | unit | value | |||
| Internal Heat | ||||||
| Capacitance | — | 60 | ||||
| internal-to-intermolecular | ||||||
| coupling | 1/ps | 0.1 | ||||
| internal-to-intramolecular | ||||||
| coupling | 1/ps | 0.1 | ||||
| mesoparticle mass | g/mol | 296.16 | ||||
| Intermolecular parameters | ||||||
| parameter | symbol | units | values | |||
| morse potential | kcal/mol | Eqn. 6 | ||||
| range | Å | 2.14 | ||||
| curvature | — | 4.5 | ||||
| energy | kcal/mol | 7.0 | ||||
| mean freq. square | 1/ps2 | 120.0 | ||||
| Intramolecular parameters111Parameters here have been defined such that and [kcal/mol] | ||||||
| parameter | symbol | unit | values | |||
| ChemDID potential | kcal/mol | Eqn. 4 | ||||
| barrier | kcal/mol | 30 | - | 80 | ||
| endothermicity | kcal/mol | 0 | - | 20 | ||
| parameters | ||||||
| depending on | 1.50 Å | 1.75 Å | 2.00 Å | 2.25 Å | ||
| volume change | — | 65 % | 50 % | 35 % | 20 % | |
| inertial parameter | g/mol | 2961 | 4145 | 7402 | 21319 | |
| mean freq. | 1/ps2 | 118.4 | 123.00 | 120.3 | 119.2 | |
| curvature | — | 80 | 253 | 1280 | 20500 | |
| Gaussian width | Å | 0.177 | 0.133 | 0.088 | .044 | |
| Gaussian constant | kcal/mol | |||||
| maximum radius | Å | 2.5 | ||||
III Shock propagation and attenuation
III.1 Response to a sustained shock
In the following we compare the shock response of inert and SWED materials using ChemDID. The initial condition for the simulations consist of a target made of an fcc crystal obtained by replicating the four-atom fcc unit cell (with lattice parameter of 10.1 Å) 200 times along the shock direction (z) and 20 times along the x and y directions leading to a system with 320,000 molecules. Periodic boundary conditions are imposed along the x and y directions, while the z direction is open. The system is thermalized at 300 K for 100 ps bringing internal DoFs in ChemDID to thermal equilibrium with radial and center of mass modes.
The samples are impacted with a thin (one lattice constant thick), rigid and infinitely massive piston traveling at the piston velocity (up). For piston’s speeds below 2.0 km/sec we use an integration time step of ps, whereas for speeds above this value we halve the time step in order to get numerical stability. The infinitely massive piston does not slow down due to the interactions with the target, nor rarefaction waves are generated from its free surface. Thus this setup generates a sustained shock as opposed to one of finite duration obtained with finite pistons. Since the piston does not slow down, the material that is in its immediate proximity will quickly approach the same velocity up. The material under stress will attempt to deform or rearrange in order to alleviate its local stress build up. While in an inert material, plastic deformation or phase transformations are the only mechanisms that allow for stress relaxation, in a SWED material volume-reducing chemical reactions can significantly reduce pressure build up and attenuate the leading shock, as we shall see.
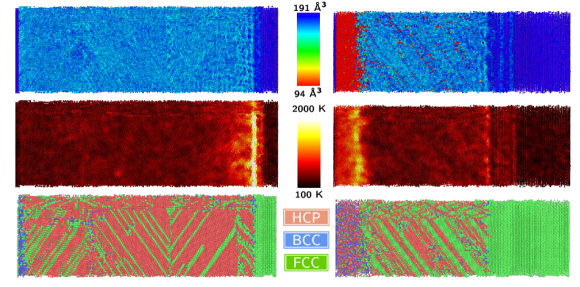
Figure 4 shows atomic snapshots of steady shocks on a SWED and inert materials shocked with up=2.0 km/s. Molecules are colored to indicate local volume, temperature, and crystal structure. Interestingly, the SWED material exhibits a region of reacted (volume collapsed) material next to the piston; this reacted region propagates along the shock direction. As expected, in the inert case shocked particles also reduce their volume due to the high pressures but this occurs rather uniformly throughout the sample. Importantly, we see that the leading shock has propagated much further in the inert material (all snapshots correspond to the same time of 25 ps), an indication that the chemistry is weakening the shock. The amount of plastic deformation following the shock also sheds light into its strength. We analyze plastic and structural transformations by characterizing the local crystal environment of each molecule. Hcp atoms in the fcc crystal indicate stacking faults that separate partial dislocations; thus red atoms indicate the traces of partial dislocations or regions that transformed to hcp. We see significantly less plastic deformation in the SWED material; this is because the leading shock is weaker. A temperature spike follows the primary wave in the inert case, but it in the SWED case the highest temperatures localize in the chemically reacted region.
 |
 |
 |
 |
 |
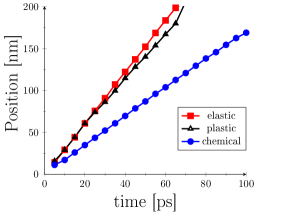 |
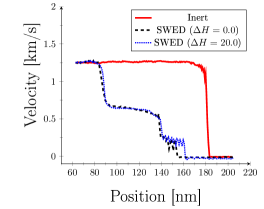
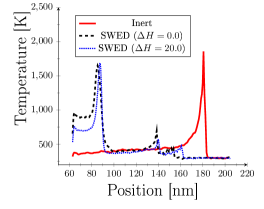
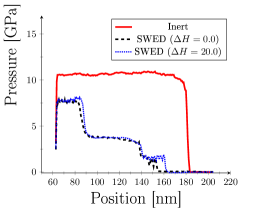
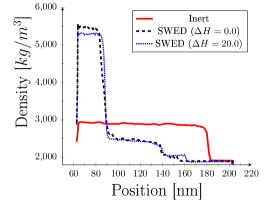
Figure 5 contrasts the profiles of key thermodynamic quantities for a SWED and inert materials at a given time; the SWED profiles further contrast the response with zero ( kcal/mol) and finite endothermicity ( kcal/mol). A three-wave structure can be seen for the SWED material. The leading wave (often called elastic precursor) shocks the material and behind it a plastic wave propagates at a slower velocity. Following the plastic is a chemical wave that densifies and heats up the material. Note that higher endothermicity decreases the temperature in the reacted region. Also the stiffness here will be slightly higher due to the linear term in appearing in the intramolecular potential. It is interesting to note that the pressure is greater in the reacted material than in the rest of the sample. It will be shown below, that this is a consequence of the volume collapse during a sustained shock and a necessity for steady state shocks. A similar three-wave structure has been observed experimentally on porous copper Boade .
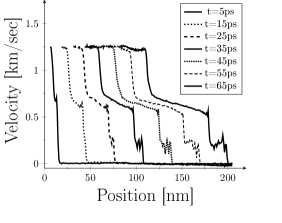
Figure 6 (a) shows velocity profiles at different times and depicts the development of the three wave structure. The chemical wave separates from the initial shock at short times and the plastic and elastic waves take significantly longer time to separate. For the case shown the separation between the elastic and plastic waves occurs at around 30 ps, after which the two waves trail each other within a few nm. In contrast, the inert material is in an overdriven regime where the plasticity has merged with its elastic propagation into a single wave. Figure 6 (b) shows the position of the three wave fronts as a function of time from which we obtain their velocities. We see that steady-state is reached very early for the chemical wave, whereas for the plastic/elastic fronts it takes a longer time for this to occur.
III.2 Taming shockwaves with volume-reducing chemical reactions
Now that we have established the possibility of weakening shocks with chemical reactions that involve volume collapse, we are interested in understanding how the characteristics of the chemistry affect the strength of the coupling and the SWED effect. Before describing our ChemDID results we use conservation laws to develop a general framework to discuss SWED and understand how volume collapse, activation barrier and endothermicity contribute to achieving the desired effect.
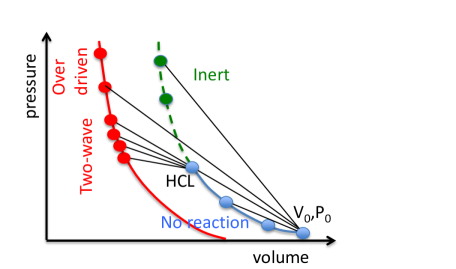
We start by considering the locus of the pressure-volume states accessible by shocking a material initially at volume and negligible pressure , see blue dots in Figure 7. It is important to understand that these states (the Hugoniot of the material) is different from a reversible equation of state; each point is the result of a shock experiment and can only be accessed by shocking material at the initial point (,). Assuming the shock is too weak to trigger chemistry or plastic deformations, we will have a single wave structure GermannPRL2000 . By applying mass and momentum conservation across the shock front we will obtain interesting insight into the SWED behavior.
Requiring mass conservation across the shock wave ShockBook yields the following equality:
| (7) |
where and represent the density and particle velocity in the shocked region and, as before, subscript 0 denote the unshocked region. Since the unshocked material is not moving (), we can readily solve for the particle velocity in the shocked region in terms of the densities and the shock velocity:
| (8) |
An expression for the pressure in the shocked region can be written from the momentum conservation equation as:
| (9) |
The case when the pre-shocked region is not stationary is given in the appendix VI.1. Rearranging the two conservation equations, known as Rankine-Hugoniot equations,ShockBook we can write down an expression for the shock velocity in terms of the change in pressure and volume
| (10) |
We see that the slope of the line connecting the initial and shocked materials (black lines in Fig. 7 known as Rayleigh lines) is related to the velocity squared of the corresponding wave. It is clear from the conservation equations that in order to decrease the pressure following the initial shock it is necessary to slow down the shock speed or, equivalently, maintain the density in the shocked region as close as possible to the un-shocked density. Let’s delve into how chemical reactions can help to maintain both of these conditions.
If we shock the material above a given threshold, that we will call Hugoniot chemical limit (HCL) in analogy to the Hugoniot elastic limit, a chemical wave will develop behind the elastic one. For simplicity we will consider two wave structures and neglect the plastic wave. In the pressure-volume plot we connect the state representing the elastic wave with the Hugoniot of the chemical products (red circles in Fig. 7). We can see that there will be a series of shocks for which the velocity of the chemical wave will be lower (gentler slopes) than that of the leading elastic precursor (steeper slope). In this regime, the point () in the Hugoniot determines the propagation velocity and pressure of the elastic precursor through Eqn. (9) and (10), where s = HCL (assuming no plasticity). This value is independent of the piston velocity (the dependence of the HCL with the activation barrier is described in the next section) until the velocity of the chemical wave matches that of the elastic precursor. At this point, the overdriven regime is reached, and the profile of the wave is characterized by a single wave structure.
Let us now quantify how the chemical wave weakens the leading shock wave. Applying mass conservation across the chemical wave { c }, i.e. between the reacted and shocked regions leads to:
| (11) |
where and represent the density and particle velocity in the reacted region. Substituting Eq. 8 into Eq. 11 and rearranging terms we obtain an expression for the shock speed as:
| (12) |
Moreover, in a sustained shock the particle velocity of the reacted material is equal to the piston velocity (). Hence, we arrive at an expression for the pressure following the leading shock in terms of the densities of the various regions and the velocity of the chemical wave:
| (13) |
Let us comment on the regime under which this expression is valid. In order for waves to separate into a chemical and a shocked components, the velocity of the chemical wave needs to lie between the piston velocity and the wave speed corresponding to the HCL: . The upper limit, , corresponds to the overdriven regime when chemical wave and the shock wave travel at a single speed . The lower limit, i.e. a chemical wave traveling at corresponds to no chemistry production, viz. , therefore the (inert) shocked wave travels at speed: .
 |
 |
| (a) | (b) |
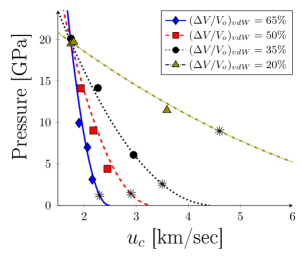
Equation 13 shows that in order to weaken the shock, i.e. reduce , we need to be high (large volume collapse) but also we need the chemical wave to travel at fast speeds. This makes it clear that, as discussed earlier, reaction kinetics are critically important for SWED. We now compare the predictions of Eq. 13 for the pressure behind the leading shockwave with results from explicit ChemDID for a family of SWED materials with various volume collapse amounts and activation energies. The density in the shocked regions depends slightly on the activation barrier, but we will assume it to be constant at kg/m3 to evaluate Eq. 13; this number changes at most by 20 % for all the cases considered at this piston speed. We shall see that this assumption leads to reasonable predictions and, in the next section, we will explore the sensitivity of the results with respect to it.
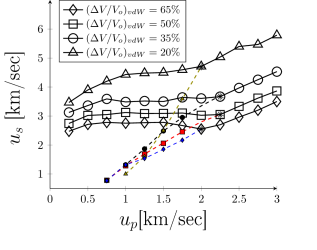
Figure 8 (a) shows the pressure following the initial shock as a function of the velocity of the chemical wave. The lines show the predictions from Eq. 13 and the symbols represent ChemDID results. The results are shown for four model materials with different amounts of volume collapse and various activation barriers ( kcal/mol). As expected, increasing the amount of volume collapse results in lower shock pressures. The non-linear dependence of pressure on the density of the compressed state is consistent with the analysis of shocks on porous materials Gogulya1985shock ; davison1971shock . For a given volume collapse, lowering the activation energy (that controls reaction kinetics) leads to faster chemical waves and also result in a reduction of the shock pressure. Figure 8 (b) shows the effect of volume-collapse on the leading shockwave (open symbols) and chemical wave (filled symbols) speed as a function of the piston velocity; we show the same volume-collapse cases in (a). Higher volume collapse result in lower shock velocities for all piston velocity and a reduction of the velocity corresponding to the HCL. Once a chemical wave propagates, it couples with the leading shock wave resulting in a plateau of the shock wave speed as a function of the piston speed. Interestingly, we find that chemical waves tend to propagate faster the smaller the volume-collapse for a given piston velocity. These results are also consistent with the shock experiments on porous copper of different densitiesBoade . The authors report a three-wave structure, similar to what is observed in our simulations, where measurement of the slower wave (equivalent to our chemical wave) shows a steeper slope for samples with less porosity. The point where the chemical wave merges with the leading shock wave can also be seen in Figures 8 (a) and (b) and is denoted by the asterisks. This points marks the end of the shock absorbing capabilities of the material and further increasing the piston velocity leads to increased shock velocity and pressure.
In summary, we have shown that volume collapse is the dominant factor in determining the effectiveness of the chemical reactions at weakening the leading shockwave (i.e. reducing the pressure) but reaction kinetics is also important. On the other hand, large volume collapses cases exhibit HCLs corresponding to slower shock velocities and the design of materials for shock absorption should take into account the regime of operation.
III.3 Quantifying the role of chemistry on shock propagation
As discussed in the previous sub-section, in order to engineer materials with desired shock-wave dissipation response, it is imperative to establish relationships between the characteristics of the chemical reactions and the material response. We have already shown the importance of volume collapse and the velocity of the chemical wave. In this section we explore ChemDID simulations in more detail, in order to correlate microscopic characteristics of the chemical reactions with shock dissipation.
 |
 |
| (a) | (b) |
To understand the development of a two-wave structure and its properties we show the evolution of the system in the pressure-volume space. Using ChemDID, we follow the local properties of a thin slab of material during shock loading. The results are shown in Fig. 9 (a) for three different activation barriers for a volume collapse of %. This figure shows the individual paths for a range of piston speeds between km/sec (in steps of 0.25 km/sec). For velocities below a critical value (HCL-limit; see Fig 7), the ends of the Rayleigh lines follow the inert (unreacted) Hugoniot. After a critical compression is reached, corresponding the volume of the HCL () which depends slightly on the activation barrier for chemistry, the system develops a two-wave structure described by two Rayleigh lines: the first going from the initial state to the pressure and volume after the initial wave (along the unreacted Hugoniot) and the second crossing into the reacted Hugoniot. In this description we are combing the plastic and elastic waves into one as their propagation velocities are similar and they do not separate significantly during the simulation time.
In order to investigate the dominant factors during this transition, we can write down the following expression relating the pressures in the reacted region and unreacted shocked region ; the derivation is shown in Section VI.1 of the Appendix.
| (14) |
The pressure in the reacted zone will lie in the reacted Hugoniot and will depend primarily on the impact speed. Higher pistons will cause the reacted region to move towards higher pressures along the product Hugoniot. This can be seen in Fig.9 where the case =1.75 km/sec has been emphasized. The pressure response of the reacted material for this case will tend to collapse to the same region around and P = 17 GPa. The critical pressure , on the other hand, will depend on the onset of chemistry. As seen from Eqn. 14, this pressure is mainly dominated by density of the reacted material and the propagation velocity of the chemical wave since they appear quadratic in this expression, while the critical volume appears linearly. This is the reason we were able to ignore the crucial density () in Eqn. 13 and obtain and expression that matches well with the simulated data. We also see from Eqn. 14, that the change in pressure cannot be negative, since . The slope of the Raleigh line in the P-V plane is therefore zero near threshold, and negative for case with more volume collapse. The slope of the Raleigh-line determines the propagation velocity of the chemical front. The points that lie between the reacted and inert Hugoniots represents cases with heterogeneous regions of collapsed volume which do fully propagate, at least within the scales of our simulation.
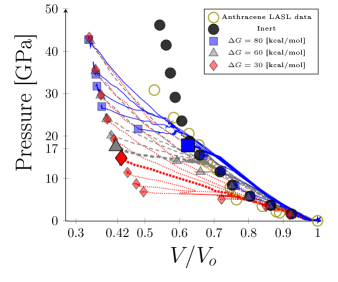
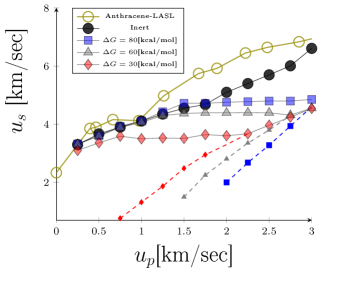
In Fig. 9 (b) we compare the shock velocities for an inert an reactive ChemDID simulations with various activation energies and includes experimental data on anthracene for reference LASL . In the elastic regime, i.e. shocks weaker than the HEL, the shock speed increases linearly with piston velocity. The HEL is reached for piston velocities of approximately 0.75 km/sec, this value depends weakly on the stiffness of the intra-molecular potential; stiffer materials tend to have slightly higher HEL limits. The HCL, on the other hand, occurs at slightly higher piston velocities and depends strongly on the activation barrier of the intra-molecular chemistry (dashed lines) in Fig. 9 (b). The case where HEL HCL (occurring for small barriers) is studied in more detail in section IV, where we discuss how chemistry directly affect the different energy transferring mechanisms. We find that lowering the activation barrier on the chemical reactions leads to faster chemistry and a stronger coupling to the leading shock wave, and therefore, to a reduction in the pressure in this region. Whereas the propagation of the chemical and elastic waves achieve steady-state during the simulation, an accurate determination of the velocity plastic wave is difficult for the sizes of the system simulated as the plastic wave separates from the elastic precursor at late times, see Fig. 6 (b).
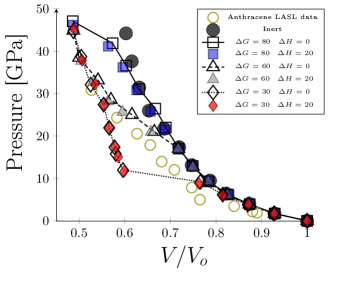
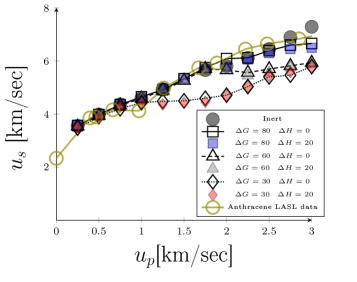
The effect of endothermicity was found to be minimal for all the cases considered in this study. Figure 10 compares the effect of endothermicity on the Hugoniot and us-up curves for an inert and SWED materials with a curvature on the intramolecular potential corresponding to %. We see that, for cases where volume collapse is small and larger activation barriers, endothermicity can slightly alleviate the shock speed, and therefore, its resultant pressure. We note that while the anthracene data matches the inert % case, in the % case, the Hugoniot appears to match a reactive case with activation barriers between kcal/mol.
 |
 |
IV Role of kinetics and lack of local equilibrium in the nucleation of chemistry
In the previous sections, we characterized the interplay between chemistry and the shock response for a family of SWED materials. We now focus on the molecular-level mechanisms that control the nucleation of volume-collapsing chemical reactions. We are interested, specifically, in understanding how the translational energy of the shockwave is transferred to the modes responsible for chemistry, i.e. the breathing mode, and how this process influences the initiation of chemistry. To do so, we study how the excitation energy from the shockwave is partitioned between the various meso, radial and internal modes and explore whether the coupling rates between them can influence chemical reactions.
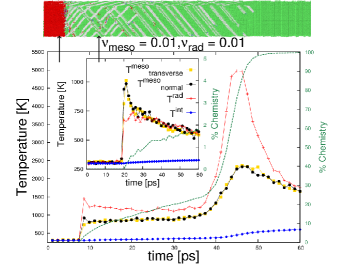
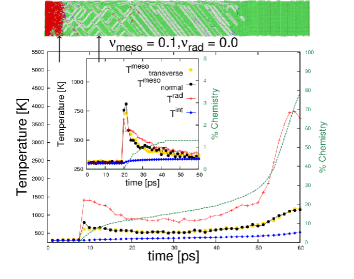
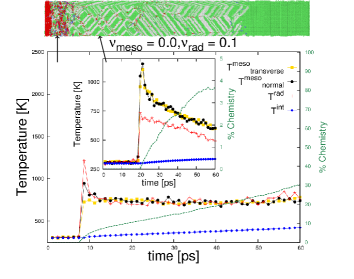
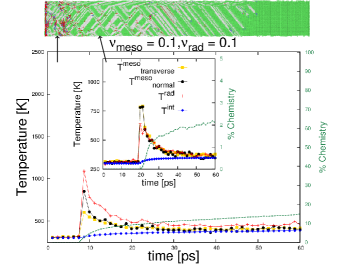
We focus on the response of a SWED material with kcal/mol and = 35 %. Such a sample will be shocked at = 0.75 km/s as this corresponds to the HCL for this set of parameters. Figure 11 shows the time evolution of the temperatures associated with the three sets of DoFs for two thin slabs of material; one 20 nm away from the impact surface and another 60 nm away (inset in figure). The set of plots capture the effect of the coupling constants between the implicit DoFs and the particles c.m. () and radial (or breathing) modes (). The meso temperature is further divided into normal (along the shock direction) and transverse modes. A dashed green line represent the percentage of reactive molecules as a function of time. Atomics snapshots of reacted particles and crystal structure are also shown at time 50 ps; fcc is colored in green, bcc in blue, hcp in white, and reacted particles in red. It is very clear that the rates associated with energy transfer affect chemistry.
As the shock passes through the material, the molecular system will be away from local equilibrium with the modes that couple more strongly to the shock having higher temperatures. In all cases, the energy in the shockwave initially excites the particles c.m. and breathing modes as these modes are involved directly in the propagation of the compression wave. These modes achieve high temperatures in very short timescales and this excitation is transferred to the internal modes over longer timescales, which depend on the coupling rates, and . This is consistent with all atom MD simulation, see for example Refs. JaramilloPRB2007 ; StrachanPRL2005 .
The high temperature in the radial modes, together with the high pressure caused by the shockwave facilitates the volume-reducing chemical reactions. As the barrier for chemical reactions is overcome and the molecules relax to the metastable, low-volume state, the breathing modes are excited and cases with significant chemistry are marked by higher transient temperatures in the breathing modes. On the other hand, in regions with little chemistry, the mesoscale and radial temperatures achieve equilibrium faster.
Interestingly, ChemDID predicts that chemical reactions can be initiated within short timescales, during this non-equilibrium stage. Thus, the timescales of energy exchange between the various sets of modes which determine the range of temperature experienced by the breathing modes play an important role in the chemical reactions. The nucleation of chemistry is also facilitated by high stresses and nucleation is observed predominantly in active slip planes where plastic deformation is localized. This can be seen in the atomic snapshots shown in Fig. 11.
 |
|
| (A) | (B) |
 |
|
| (C) | (D) |
We now focus on the effect of energy coupling rates on the chemical response of the materials. To help in the discussion, Fig. 12 shows the pressure profiles for different coupling rates we have used in Fig.11. For weak coupling rates to the internal DoFs, ps-1 in Fig. 11 (a), the radial and mesoscopic temperatures remain in the non-equilibrium, high-temperature state for extended periods of time leading to significant chemical reactions. The propagation of a chemical front leads to a significant reduction in pressure behind the leading shockwave, see red line in Fig. 12. As a result, this pressure reduction leads to a significant quenching of chemistry on the region behind the shock, except between active slip planes with high stress.
Increasing the internal-to-intermolecular coupling ( ps-1) and removing the internal-to-radial coupling ( ps-1), leads to a reduction in chemical conversion throughout the sample. This occurs rather indirectly, as the internal temperature couples to the mesoscopic temperature via the DID equations and the latter couples to the radial DoFs via the Hamiltonian. The result is that the radial temperatures are lower compared to the case with weak coupling discussed above, see Fig. 11 (b). Now reversing the implicit couplings, i.e. ps-1 and ps-1, leads to faster cooling on the radial temperature by the internal DoFs and a much slower chemical reaction front propagation. As expected, quenching the amount of chemistry near the impact leads to higher pressure in the region behind the leading shock, and as a result, to slightly more chemistry (4 %) in the region behind the leading shock, compared to the other two previous cases (<2%).
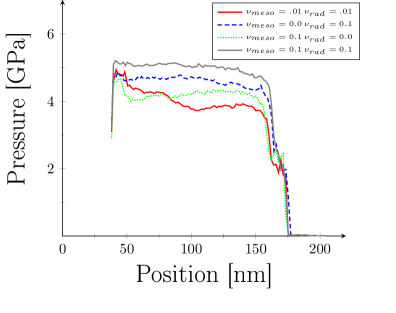 |
Lastly, strong coupling between internal and meso and radial modes, ps-1, results in rapid equilibration of the radial and mesoscale temperatures with the internal temperature. We see equilibration with all the temperatures occurring within 30 ps throughout the whole sample, leading to a fast quenching effect on chemistry production. The pressure for this case, is the highest compared to all the other cases. As a result we see a large fraction of nucleation of chemical reaction behind the leading shock, but interestingly, these nucleations do not subsequently grow into a propagating chemical wave. Our simulations clearly show that the ability of the chemical reactions to weaken shock waves is also affected by the details of the energy transfer between modes in the molecules.
V Conclusions
In this paper we used ChemDID mesoscale simulations to explore the shock response of materials that can undergo endothermic, volume reducing chemical reactions. The simulations demonstrate that such stress-induced chemical reactions can be effective at dissipating the shockwave and such materials could be valuable in applications requiring protection from dynamical loads.
We find that when a critical shock strength is reached, a chemical reaction wave is induced behind the leading shock wave. The chemical reactions weaken the leading shockwave. For a range piston velocities above this hugoniot chemical limit we observe a three-wave structure, with the elastic and plastic waves traveling at similar speeds and a the chemical wave trailing behind. Increasing the piston velocity results in an increase in the velocity of the chemical wave but does not affect the velocity leading shock nor the corresponding pressure. Under this regime, the material weakens the shock. This effect continues until the chemical wave moves at the same speed as the leading wave. In such an overdriven driven regime an increase in the shock velocity is translated directly to the leading shock.
The results of the simulations together with an analysis of the shockwave structure using conservation laws show that both the amount of volume collapse and the velocity of the chemical wave (governed by the activation energy associated with the chemical reactions) are the critical parameters for shockwave attenuation. The endothermicity of the chemical reactions plays a secondary role that is only discernible in the case of high barriers and modest volume collapse. Such information should be useful in the design and optimization of materials for shockwave energy dissipation.
Interestingly, energy transfer rates between the various modes in the material also play a role in the nucleation and propagation of chemical reactions. Dynamical loading of materials leads to non-equilibrium states right behind the shockwave; with various DoFs experiencing different temperatures. Chemical reactions are influenced by the temperature history of the corresponding modes and the coupling rates between them. Recent reactive MD simulations of solid explosives also indicate the possibility of chemical reactions away from local equilibrium following shock loading.Cherukara2014 The interplay between plasticity and chemistry will also affect resultant chemical reactions and shock attenuation in the material. Whereas our simulations presented focused on single crystalline materials, ChemDID could also be a useful tool to explore the effect of microstructure and defects on shock induced chemistry. This would require large-scale simulations and we are working on an implementation of our mesoscale model in the LAMMPS parallel simulator that would enable such studies.
For a given piston speed, a specific volume collapse provides a limited range where chemistry is able alleviate pressure buildup. Higher volume-collapse reduces the shock pressure the most, but also reduces the shock velocity corresponding to the aforementioned overdriven state. Avoiding this overdriven regime may be of interest for some applications. As a function of piston speeds, the larger activation energies can postpone the onset of chemistry to higher piston speeds before it reaches the overdriven state. Therefore, it is important to take both of these effects into consideration in order to design SWED materials that achieve the maximum amount of pressured dissipated over a desired range of velocities.
In this paper we focused on the idealized case of sustained shocks and model materials. Additional complexity is introduced when considering finite pistons that lead to reflection and rarefaction waves that depend on the relative size of the target to impactor. In such cases non-steady states need to be considered, yet the general conclusions presented in this paper are useful for such cases. Finally, ChemDID can be parameterized to describe specific materials of interest. This would likely require more complex inter-molecular interaction potentials and chemical kinetics matching the real case. While developing such models is challenging, the technique would enable achieving time and length scales well beyond what is possible today with all-atom MD.
VI appendix
VI.1 Pressure quantification
We write an expression for the pressure between a chemical region {c} and a shocked region {s} where none of the components are at rest. The transition across this region has to satisfy momentum conservation:
| (15) |
Let us expand this expression, we get
,where we have made use of mass conservation ( Eqn, 11 ) above. Substituting Eqn. 12, twice, and rearranging, we obtain the final form
| (16) |
References
- (1) B. Holian and P. Lomdahl, Science 280, 2085 (1998)
- (2) E. Bringa, A. Caro, Y. Wang, M. Victoria, J. McNaney, B. Remington, R. Smith, B. Torralva, and H. Van Swygenhoven, Science 309, 1838 (2005)
- (3) A. Loveridge-Smith, A. Allen, J. Belak, T. Boehly, A. Hauer, B. Holian, D. Kalantar, G. Kyrala, R. Lee, P. Lomdahl, M. Meyers, D. Paisley, S. Pollaine, B. Remington, D. Swift, S. Weber, and J. Wark, Physical Review Letters 86, 2349 (2001)
- (4) K. Kadau, T. Germann, P. Lomdahl, and B. Holian, Science 296, 1681 (2002)
- (5) D. Kalantar, J. Belak, G. Collins, J. Colvin, H. Davies, J. Eggert, T. Germann, J. Hawreliak, B. Holian, K. Kadau, P. Lomdahl, H. Lorenzana, M. Meyers, K. Rosolankova, M. Schneider, J. Sheppard, J. Stolken, and J. Wark, Physical Review Letters 95, 075502 (2005)
- (6) D. J. Erskine and W. J. Nellis, Journal of Applied Physics 71, 4882 (1992)
- (7) Y. Yang, S. Wang, Z. Sun, and D. Dlott, Journal of Applied Physics 95, 3667 (2004)
- (8) A. Strachan, A. C. van Duin, D. Chakraborty, S. Dasgupta, and W. A. Goddard III, Physical Review Letters 91, 098301 (2003)
- (9) E. J. Reed, M. R. Manaa, L. E. Fried, K. R. Glaesemann, and J. D. Joannopoulos, Nature Physics 4, 72 (2008)
- (10) D. Dlott, Annual Review of Physical Chemistry 62, 575 (2011)
- (11) T. Germann, B. Holian, P. Lomdahl, and R. Ravelo, Physical Review Letters 84, 5351 (2000)
- (12) E. Jaramillo, T. D. Sewell, and A. Strachan, Physical Review B 76, 064112 (2007)
- (13) D. Roylance, Textile Research Journal 47, 679 (1977)
- (14) J. López-Puente, A. Arias, R. Zaera, and C. Navarro, International journal of impact engineering 32, 321 (2005)
- (15) R. Bogoslovov, C. Roland, and R. Gamache, Applied physics letters 90, 221910 (2007)
- (16) M. Grujicic, B. Pandurangan, T. He, B. Cheeseman, C.-F. Yen, and C. Randow, Materials Science and Engineering: A 527, 7741 (2010)
- (17) M. Grujicic, J. Snipes, S. Ramaswami, R. Yavari, J. Runt, J. Tarter, and G. Dillon, Journal of Materials Engineering and Performance 22, 1964 (2013)
- (18) P. G. Yot, Z. Boudene, J. Macia, D. Granier, L. Vanduyfhuys, T. Verstraelen, V. Van Speybroeck, T. Devic, C. Serre, G. Ferey, N. Stock, and G. Maurin, Chemical Communications 50, 9462 (2014)
- (19) E. Antillon, K. Banlusan, and A. Strachan, Modelling and Simulation in Materials Science and Engineering 22, 025027 (2014)
- (20) A. Strachan and B. L. Holian, Physical Review Letters 94, 014301 (2005)
- (21) K.-H. Lin, B. L. Holian, T. C. Germann, and A. Strachan, Journal of Chemical Physics 141, 064107 (2014)
- (22) B. Slepetz and M. Kertesz, Journal of the American Chemical Society 135, 13720 (2013)
- (23) S. R. Jezowski, L. Zhu, Y. Wang, A. P. Rice, G. W. Scott, C. J. Bardeen, and E. L. Chronister, Journal of the American Chemical Society 134, 7459 (2012)
- (24) K. Lynch, A. Thompson, and A. Strachan, Modelling and Simulation in Materials Science and Engineering 17, 015007 (2009)
- (25) R. R. Boade, Journal of Applied Physics 39, 5693 (1968)
- (26) G. Ben-Dor, O. Igra, and T. Elperin, Handbook of Shock Waves, Vol. 1 (Academic Press, 2000)
- (27) M. Gogulya, I. Voskoboinikov, and A. Prostoserdov, Combustion, Explosion, and Shock Waves 21, 373 (1985)
- (28) L. Davison, Journal of Applied Physics 42, 5503 (1971)
- (29) S. P. Marsh, LASL shock Hugoniot data, Vol. 5 (Univ of California Press, 1980)
- (30) M. Cherukara, M. Wood, E. Kober, and A. Strachan, In preparation(2014)