ALMA detection of [C ii] 158m emission from a strongly lensed star-forming galaxy††thanks: Based on ALMA observations 2011.0.00130.S.
Abstract
Aims. Our objectives are to determine the properties of the interstellar medium (ISM) and of star-formation in typical star-forming galaxies at high redshift.
Methods. Following up on our previous multi-wavelength observations with HST, Spitzer, Herschel, and the Plateau de Bure Interferometer (PdBI), we have studied a strongly lensed galaxy, the arc behind the galaxy cluster MACS J0451+0006, with ALMA to measure the [C ii] 158m emission line, one of the main coolants of the ISM.
Results. [C ii] emission from the southern part of this galaxy is detected at . Taking into account strong gravitational lensing, which provides a magnification of , the intrinsic lensing-corrected [C ii] luminosity is L⊙. The observed ratio of [C ii]-to-IR emission, , is found to be similar to that in nearby galaxies. The same also holds for the observed ratio /, which is comparable to that of star-forming galaxies and active galaxy nuclei (AGN) at low redshift.
Conclusions. We utilize strong gravitational lensing to extend diagnostic studies of the cold ISM to an order of magnitude lower luminosity ( L⊙) and SFR than previous work at high redshift. While larger samples are needed, our results provide evidence that the cold ISM of typical high redshift galaxies has physical characteristics similar to normal star forming galaxies in the local Universe.
Key Words.:
Galaxies: high-redshift – Galaxies: starburst – Galaxies: ISM – Galaxies: formation – Radio lines: galaxies1 Introduction
Observations of CO molecular emission and fine structure lines, such as [C ii] 158m, provide interesting insight into the gas reservoir and interstellar medium (ISM) of galaxies (Carilli & Walter 2013). Although such observations are now yielding first measures of the molecular gas fraction at high redshifts (e.g. Tacconi et al. 2010; Saintonge et al. 2013) and hints on the ISM (photo-dissociation regions (PDRs), and H ii regions) up to (Riechers et al. 2013; De Breuck et al. 2014; Rawle et al. 2014; Riechers et al. 2014), very little is known about the properties of the most abundant galaxies with relatively low IR luminosities and modest stellar masses. Gravitationally lensed sources offer a unique chance to sample this regime.
The Herschel Lensing Survey of massive galaxy clusters (Egami et al. 2010) and accompanying multi-wavelength observations were in particular designed to constrain the properties of typical-luminosity galaxies by probing beyond nominal sensitivity limits with the power of strong gravitational lensing. Detailed stellar, star-formation, and dust properties of a sample of seven galaxies at have been determined by Sklias et al. (2014). Using CO observations we have also studied their molecular gas properties in Dessauges-Zavadsky et al. (2014). In cycle 0 we have been able to observe one of these galaxies with ALMA, the gravitationally lensed, multiply-imaged arc MACS J0451+0006 at , to study its ISM/PDR properties, as part of an ongoing ALMA program to study line emission in high redshift gravitationally-lensed galaxies (PI: Ellis). We here present results concerning the [C ii] 158m emission, providing some of the first time information on [C ii] and CO in an IR-faint ( L⊙), low mass ( M⊙ for a Chabrier IMF) star-forming galaxy at high redshift.
2 Observations
2.1 ALMA observations and results
The MACS J0451+0006 arc was targeted with ALMA in cycle 0 to map [C ii] emission on pc scales. Our aims are to measure the spatial distribution and kinematics of the cold ISM/PDRs, and to compare this with the distribution and kinematics of star forming regions traced by H (Jones et al. 2010). Although the delivered data did not meet our requested sensitivity, it is sufficient to examine the average ISM/PDR properties from the integrated [C ii] emission.
Our source was observed by 25 antennas in band 9 during a 1h track including calibration scans on the 31st of December 2012. Projected baseline lengths range from 13 to 376 meters. The correlator was set up to obtain 4 spectral sub-bands of 2 GHz with 128 channels of 15.625 MHz. The receivers were tuned to center the bands on the following frequencies in GHz: 628.826, 630.520, 632.220 and 648.234. Passband, flux and phase calibrations used the quasar J0423-013, extrapolating from ALMA band 3 (100 GHz) and band 7 (300 GHz) observations made between December 14-16, 2012, which leads to a relatively large uncertainty for the flux calibration, of the order of 25%. The visibilities were calibrated and the image cleaned with the CASA software. With natural weighting the clean beam full width at half maximum (FWHM) is and the noise RMS is mJy beam-1 in 14.9 km s-1 channels.
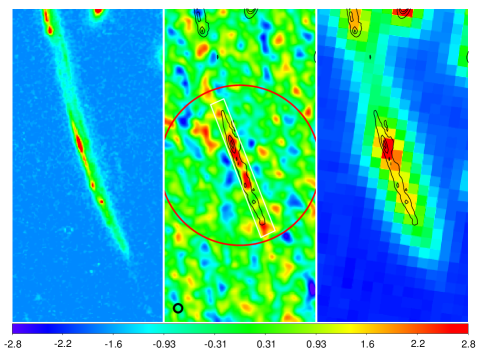
Flagging bad channels and masking out the [C ii] 158m line we integrate the 4 sub-bands to produce a continuum map, obtaining a noise of mJy beam-1. No continuum emission is detected at the position of the gravitational arc. Integrating the flux in a box encompassing the arc as shown in the Fig. 1 and correcting for the primary beam, we obtain a 3 upper limit of mJy, which is compatible with the SPIRE 500 m band (Zamojski et al., in preparation).
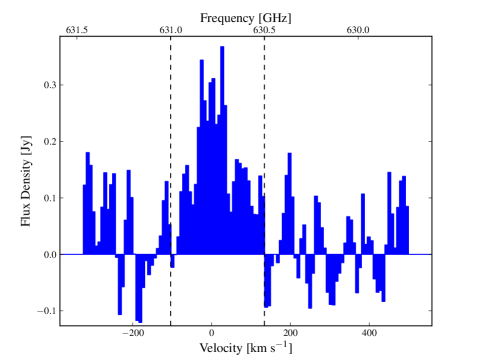
Integrating the spectra corrected for the primary beam in the same spatial box we clearly detect the [C ii] 158m line shown in Fig. 2. The flux integrated in the range 630.5-631.0 GHz is Jy km s-1, which corresponds to an intrinsic luminosity of L⊙, after correction for magnification by a factor . This magnification corresponds both to the mean magnification of the total arc (cf. Jones et al. 2010) and to the mean over the region concerned here, as determined from an updated version of the lensing model by Richard et al. (2011) and recent updates to it. We estimate an uncertainty of . Spatially, the [C ii] emission follows closely the arc, as traced by the 1.4 and 3.6 m emission. Given that the [C ii] emission is very compact along the direction perpendicular to the arc, the flux is thus well constrained by the baselines in that direction. Furthermore, the length of the arc is smaller than the primary beam and the corresponding baselines are well sampled. Therefore, the flux lost due to missing short spacings should be small, and negligible compared to the flux uncertainties quoted above.
| Quantity | value |
|---|---|
| 2.013 | |
| 630.743 0.015 GHz | |
| Jy km/s | |
| L⊙ | |
| L⊙ | |
| c | L⊙ |
| d | L⊙ |
| e | L⊙ |
2.2 Other observations
The CO(3-2) line was detected with the PdBI by Dessauges-Zavadsky et al. (2014). The emission originates from the southern part of the arc, i.e. the same region as targeted with ALMA. The CO flux translates to a lensing-corrected CO(1-0) luminosity of L⊙ assuming a factor between the CO(3-2) and CO(1-0) line luminosities, and (Dessauges-Zavadsky et al. 2014). The IR spectral energy distribution of the MACS J0451+0006 arc, based on Spitzer and Herschel observations, has been studied in detail by Sklias et al. (2014), from which we obtain the IR luminosity for the southern part of the arc222From the difference between the total luminosity and that of the subdominant northern part. corresponding to the region of the CO and [C ii] detection. The CO and IR luminosities are listed in Table LABEL:t_derived. As commonly used, is defined as the luminosity between 42.5 and 122.5 m rest-frame, whereas the total IR luminosity, denoted here, refers to the 8-1000 m domain.
Although both the CO and [C ii] emission originate from the region, the two lines show different velocity profiles: the former a double-peaked profile and the latter a single component centered on zero velocity. The apparent difference between the line profiles could result from the ISM properties of the galaxy or be due to the relatively low S/N of the CO line. Future ALMA observations should settle this question.
3 Results
3.1 Carbon emission from a , faint LIRG
We now compare the observed [C ii] luminosity with that of other star-forming galaxies and AGN detected in the IR, both at low and high redshift.
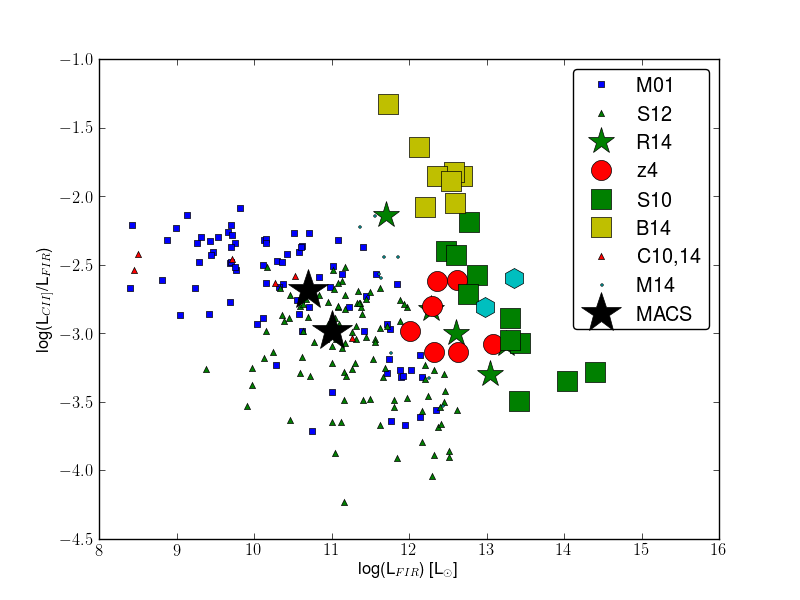
The [C ii] 158m luminosity of MACS J0451+0006 is shown in Fig. 3 as a function of together with previous detections in nearby and high redshift galaxies and AGN. Two main results are clearly seen from this figure. First, our source has a significantly lower IR luminosity than previously studied galaxies at . Indeed, thanks to a high magnification by gravitational lensing our source is currently the IR-faintest galaxy detected in [C ii] 158m at , namely a faint LIRG. Second, relative to , the [C ii] 158m emission of MACS J0451+0006 is , similar to that in nearby galaxies, as seen e.g. by the comparison with the measurements from Malhotra et al. (2001) and Sargsyan et al. (2012).
Although other [C ii] measurements currently available for high redshift () galaxies are mostly restricted to the very IR luminous objects ( L⊙) the relative / emission of many of them is also comparable to that of MACS J0451+0006, as can be seen from Fig. 3. This is also the case for a Lyman break galaxy (LBG) at from which Riechers et al. (2014) have recently detected [C ii] emission with ALMA. Indeed, although the LBG is undetected in the IR continuum ( L⊙333 limit obtained from their Table 1.), [C ii] is fairly strong, corresponding to . So far, the available data at show a fairly large dispersion in the / ratio, Some galaxies (marked with B14 in our figure) with high ratios of were recently found by Brisbin et al. (2014). We note, however, that most of their [C ii] detections are of low significance, hence associated with large uncertainties.
The large scatter in [C ii]/ probably implies that several factors, such as the average radiation field density, ISM density, metallicity and others, determine the [C ii]/FIR ratio, as amply discussed in the literature (e.g. Graciá-Carpio et al. 2011; Magdis et al. 2014). For the MACS J0451+0006 arc observed here, we have derived fairly detailed information on its stellar content, star formation rate, and dust properties, as well as some measure of its molecular gas (cf. Sklias et al. 2014; Dessauges-Zavadsky et al. 2014, and below). The dust temperature , in particular, has also been determined from our Herschel observations, and is found to be fairly high, between 50–80 K, for the southern part of the arc observed here. Although local galaxies show an anti-correlation between the / ratio and (cf. Malhotra et al. 2001; Graciá-Carpio et al. 2011; Magdis et al. 2014), our galaxy shows a “normal” ratio despite its high dust temperature. A similar result is also found for the lensed galaxy HLSW-01 (SWIRE6) reported by Magdis et al. (2014), which has a high K and a normal ratio . Clearly, more measurements and additional information on the physical properties of a representative sample of high- galaxies are needed to improve our understanding of these objects and their ISM.
Given the agreement of the observed with that of nearby objects, our galaxy is logically also in good agreement with the SFR– relation (cf. de Looze et al. 2011; De Looze et al. 2014) determined from local star-forming galaxies. Indeed, from the star formation rate is SFR(IR) M⊙ yr-1 for a Chabrier/Kroupa IMF, one would obtain L⊙, in fair agreement with our observed value.
3.2 Normal [C ii]/CO emission
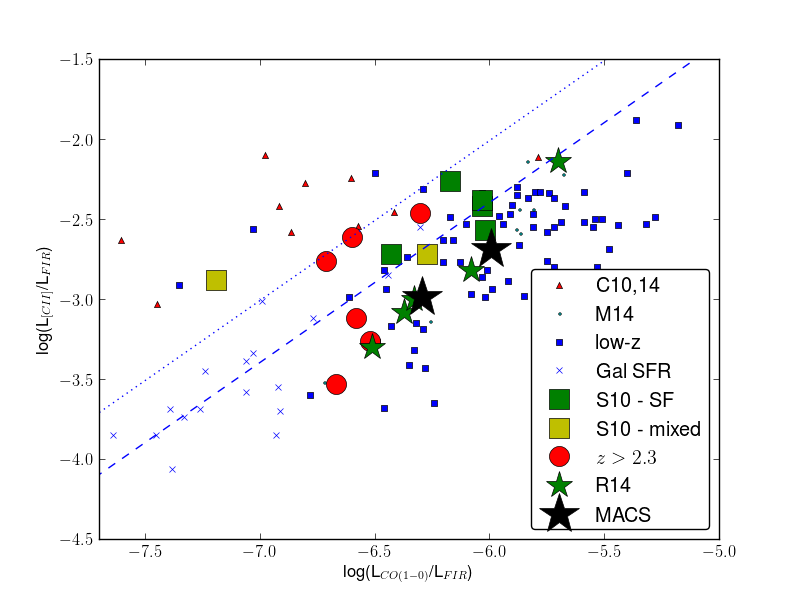
The [C ii] 158m and CO line strengths, both normalized to , are shown in Fig. 4 and compared to available data from nearby and distant galaxies and AGN. Again MACS J0451+0006 is found in a region of “normal” [C ii]/CO ratios, close to shown by the dashed line, where most nearby starbursts, AGN, and star-forming galaxies are found. In contrast, nearby quiescent star-forming galaxies show a lower [C ii]/CO ratio (Stacey et al. 2010). At the other end, some objects, mostly dwarf galaxies, show significantly higher [C ii]/CO ratios, exceeding significantly .
Both observations and PDR modeling suggest that high [C ii]/CO ratios are related to low metallicity (cf. Stacey et al. 1991; Cormier et al. 2010; De Breuck et al. 2011). High [C ii]/CO ratios are explained by spherical PDR models, where the CO emission region is reduced at low metallicity (see e.g. Bolatto et al. 1999; Röllig et al. 2006). For MACS J0451+0006, Richard et al. (2011) derive a metallicity of from the [N ii]/H ratio. However, since the region may contain an AGN (Zamosjki et al., in preparation), [N ii]/H may be boosted by the AGN, and the metallicity hence overestimated. Indeed, a low/sub-solar metallicity would be expected from the fairly low mass of this galaxy. Using, e.g., the fundamental mass-SFR-metallicity relation of Mannucci et al. (2010) one expects , lower than the above estimate. However, in comparison to the nearby dwarf galaxies from Cormier et al. (2010, 2014), with metallicities , MACS J0451+0006 has a higher metallicity, consistent with a lower [C ii]/CO ratio.
Compared to most low redshift galaxies (except for low metallicity dwarf galaxies), MACS J0451+0006 shows a comparable / ratio (Fig. 4), although a large dispersion is found at all redshifts (cf. Genzel et al. 2010; Combes et al. 2013; Dessauges-Zavadsky et al. 2014). At the corresponding / (or equivalently /) ratio, the observed / ratio is slightly below, although consistent with the observed trend of local galaxies (Graciá-Carpio et al. 2011; Magdis et al. 2014).
In simple 1D PDR models the main physical parameters are the incident far-UV (FUV) radiation field, commonly measured by the Habing flux , and the gas density (e.g. Le Petit et al. 2002). From such models variations of / are mostly explained by varying , with an increased FUV flux causing a decrease of / (cf. Stacey et al. 1991, 2010). In their galaxy sample, Stacey et al. (2010) find that galaxies containing an AGN have on average a higher FUV flux, i.e. a lower / ratio. Indeed, MACS J0451+0006 shows a comparable / ratio as their “mixed” sample, which could indicate that the ratio is also affected by a presumed AGN contribution in this galaxy. However, the comparison sample of Stacey et al. (2010) is very small, and other galaxies at high redshift (indicated as in Fig. 4) also display comparable properties in the / and / ratios.
3.3 Discussion
To place our target into a more general context of IR-detected galaxies, MACS J0451+0006 is – with L⊙ – a faint LIRG, with an infrared luminosity , below the characteristic value of at using the luminosity function of Gruppioni et al. (2013), or at using the measurements of Magnelli et al. (2013). Compared to the stellar mass function of star-forming galaxies at our galaxy has a mass of (cf. Ilbert et al. 2013).
Compared to other galaxies currently detected in [C ii] at high redshift for which information is relatively sparse, our rich dataset available for MACS J0451+0006 allow us to determine quantities concerning its dust content (mass, temperature, UV attenuation), gas content (CO mass, gas depletion timescale, gas fraction), stellar content (SFR, mass, approximate metallicity), and kinematics (see Jones et al. 2010; Richard et al. 2011; Sklias et al. 2014; Dessauges-Zavadsky et al. 2014). From our present knowledge at , MACS J0451+0006 appears as fairly normal for its stellar/star formation properties: it is, e.g., close to or within the main sequence of Daddi et al. (2007), although this not well determined in the mass range of MACS J0451+0006. In terms of ISM/PDR properties, however, only few galaxies are measured at these redshifts, preventing us from determining what their “normal”/typical properties are. In any case, despite a higher sSFR and hotter dust compared to nearby galaxies and possibly the presence of an AGN, MACS J0451+0006 shows relative [C ii] 158m/IR and CO/IR properties which are very similar to those of nearby (and few other ) star-forming galaxies. This shows that the ISM properties depend in a more complex manner on several physical parameters.
4 Conclusion
Using ALMA in cycle 0, we have detected [C ii] 158m emission from the strongly lensed, multiply-imaged arc MACS J0451+0006 previously studied in depth thanks to HST, Spitzer, Herschel, and IRAM observations. The spatially integrated [C ii] luminosity corresponds to L⊙, after correction for lensing. The IR luminosity of this galaxy is times fainter than any previous source detected both in [C ii] and in the IR continuum at high redshift. The observed ratio of [C ii]-to-IR emission, , is found to be similar to that in nearby galaxies. The same also holds for the observed [C ii]/CO ratio, which is comparable to that of star-forming galaxies and AGN at low redshift, and also in agreement with available measurements in more IR-luminous systems at high redshift. Although MACS J0451+0006 shows a high dust temperature ( K, Sklias et al. 2014), the / ratio is not lower than in nearby galaxies with comparable dust temperatures (cf. Malhotra et al. 2001; Magdis et al. 2014).
Our previous CO observations with IRAM and the present [C ii] 158m detection with ALMA provide a first hint on PDR/ISM properties of a relatively low mass ( M⊙) star-forming galaxy at . Observations of larger samples of “normal” star-forming galaxies at high redshift should soon become available, providing us then with a better understanding of their ISM and star formation properties. Further ALMA observations of MACS J0451+0006 have been approved to study [C ii], CO, and dust emission on small spatial scales down to 200 pc in the source plane.
Acknowledgements.
This work was supported by the Swiss National Science Foundation. This paper makes use of the following ALMA data: 2011.0.00130.S (PI Ellis). ALMA is a partnership of ESO (representing its member states), NSF (USA) and NINS (Japan), together with NRC (Canada) and NSC and ASIAA (Taiwan), in cooperation with the Republic of Chile. The Joint ALMA Observatory is operated by ESO, AUI/NRAO and NAOJ. We gratefully thank the ALMA staff of NAASC for their assistance in preparing the observations, which form the basis of this Letter.References
- Bolatto et al. (1999) Bolatto, A. D., Jackson, J. M., & Ingalls, J. G. 1999, ApJ, 513, 275
- Brisbin et al. (2014) Brisbin, D., Ferkinhoff, C., Nikola, T., et al. 2014, ArXiv e-prints
- Carilli & Walter (2013) Carilli, C. L. & Walter, F. 2013, ARA&A, 51, 105
- Casey et al. (2014) Casey, C. M., Narayanan, D., & Cooray, A. 2014, Phys. Rep, 541, 45
- Combes et al. (2013) Combes, F., García-Burillo, S., Braine, J., et al. 2013, A&A, 550, A41
- Cormier et al. (2010) Cormier, D., Madden, S. C., Hony, S., et al. 2010, A&A, 518, L57
- Cormier et al. (2014) Cormier, D., Madden, S. C., Lebouteiller, V., et al. 2014, A&A, 564, A121
- Daddi et al. (2007) Daddi, E., Dickinson, M., Morrison, G., et al. 2007, ApJ, 670, 156
- De Breuck et al. (2011) De Breuck, C., Maiolino, R., Caselli, P., et al. 2011, A&A, 530, L8
- De Breuck et al. (2014) De Breuck, C., Williams, R. J., Swinbank, M., et al. 2014, A&A, 565, A59
- de Looze et al. (2011) de Looze, I., Baes, M., Bendo, G. J., Cortese, L., & Fritz, J. 2011, MNRAS, 416, 2712
- De Looze et al. (2014) De Looze, I., Cormier, D., Lebouteiller, V., et al. 2014, A&A, 568, A62
- Dessauges-Zavadsky et al. (2014) Dessauges-Zavadsky, M., Zamojski, M., Schaerer, D., et al. 2014, A&A, in press, arXiv:1408.0816
- Egami et al. (2010) Egami, E., Rex, M., Rawle, T. D., et al. 2010, A&A, 518, L12
- Genzel et al. (2010) Genzel, R., Tacconi, L. J., Gracia-Carpio, J., et al. 2010, MNRAS, 407, 2091
- Graciá-Carpio et al. (2011) Graciá-Carpio, J., Sturm, E., Hailey-Dunsheath, S., et al. 2011, ApJL, 728, L7
- Gruppioni et al. (2013) Gruppioni, C., Pozzi, F., Rodighiero, G., et al. 2013, MNRAS, 432, 23
- Ilbert et al. (2013) Ilbert, O., McCracken, H. J., Le Fèvre, O., et al. 2013, A&A, 556, A55
- Jones et al. (2010) Jones, T. A., Swinbank, A. M., Ellis, R. S., Richard, J., & Stark, D. P. 2010, MNRAS, 404, 1247
- Le Petit et al. (2002) Le Petit, F., Roueff, E., & Le Bourlot, J. 2002, A&A, 390, 369
- Magdis et al. (2014) Magdis, G. E., Rigopoulou, D., Hopwood, R., et al. 2014, ArXiv e-prints
- Magnelli et al. (2013) Magnelli, B., Popesso, P., Berta, S., et al. 2013, A&A, 553, A132
- Malhotra et al. (2001) Malhotra, S., Kaufman, M. J., Hollenbach, D., et al. 2001, ApJ, 561, 766
- Mannucci et al. (2010) Mannucci, F., Cresci, G., Maiolino, R., Marconi, A., & Gnerucci, A. 2010, MNRAS, 408, 2115
- Rawle et al. (2014) Rawle, T. D., Egami, E., Bussmann, R. S., et al. 2014, ApJ, 783, 59
- Richard et al. (2011) Richard, J., Jones, T., Ellis, R., et al. 2011, MNRAS, 413, 643
- Riechers et al. (2013) Riechers, D. A., Bradford, C. M., Clements, D. L., et al. 2013, Nature, 496, 329
- Riechers et al. (2014) Riechers, D. A., Carilli, C. L., Capak, P. L., et al. 2014, ApJ, 796, 84
- Röllig et al. (2006) Röllig, M., Ossenkopf, V., Jeyakumar, S., Stutzki, J., & Sternberg, A. 2006, A&A, 451, 917
- Saintonge et al. (2013) Saintonge, A., Lutz, D., Genzel, R., et al. 2013, ApJ, 778, 2
- Sargsyan et al. (2012) Sargsyan, L., Lebouteiller, V., Weedman, D., et al. 2012, ApJ, 755, 171
- Sklias et al. (2014) Sklias, P., Zamojski, M., Schaerer, D., et al. 2014, A&A, 561, A149
- Stacey et al. (1991) Stacey, G. J., Geis, N., Genzel, R., et al. 1991, ApJ, 373, 423
- Stacey et al. (2010) Stacey, G. J., Hailey-Dunsheath, S., Ferkinhoff, C., et al. 2010, ApJ, 724, 957
- Tacconi et al. (2010) Tacconi, L. J., Genzel, R., Neri, R., et al. 2010, Nature, 463, 781