The imprints of the Galactic bar on the thick disk with RAVE
Abstract
We study the kinematics of a local sample of stars, located within a cylinder of radius centered on the Sun, in the RAVE dataset. We find clear asymmetries in the - velocity distributions of thin and thick disk stars: there are more stars moving radially outwards for low azimuthal velocities and more radially inwards for high azimuthal velocities. Such asymmetries have been previously reported for the thin disk as being due to the Galactic bar, but this is the first time that the same type of structures are seen in the thick disk. Our findings imply that the velocities of thick disk stars should no longer be described by Schwarzschild’s, multivariate Gaussian or purely axisymmetric distributions. Furthermore, the nature of previously reported substructures in the thick disk needs to be revisited as these could be associated with dynamical resonances rather than to accretion events. It is clear that dynamical models of the Galaxy must fit the 3D velocity distributions of the disks, rather than the projected 1D, if we are to understand the Galaxy fully.
Subject headings:
Galaxy: disk — Galaxy: kinematics and dynamics — Galaxy: structure1. Introduction
The velocity distribution of stars in the Solar neighborhood contains key information about the current dynamical state of our Galaxy and also about its history. The kinematics of stars can be used to derive both the mass distribution of the Milky Way through sophisticated dynamical models, as well as to identify accretion events.
The velocities of thin disk stars are often described by the Schwarzschild distribution function, which considers each of the velocity components separately. However, data from the Hipparcos mission (Perryman et al. 1997; ESA 1997) and later from the Geneva-Copenhagen survey (Holmberg et al. 2009) have revealed a more complex distribution with significant overdensities and structure (Dehnen 1998; Famaey et al. 2005; Antoja et al. 2008). Some of the over-densities and distortions of the velocity distribution appear to be the imprints of the non-axisymmetric components of the Milky Way, namely the spiral arms and Galactic bar (e.g. Dehnen 2000; De Simone et al. 2004; Sellwood 2010; Antoja et al. 2011; McMillan 2011). Streams or moving groups are formed by stars on orbits that are close to resonant with the natural frequencies of the spiral arms and/or the bar. Examples of such moving groups that are heterogeneous in age and chemical composition are the Pleiades, Hyades, Sirius, and Hercules streams (the latter very likely driven by the bar).
On the other hand, the velocity distribution of the thick disk has been studied in less detail thus far because of limitations in the size of volume complete samples. In practice, this has implied that Gaussian distributions were used to fit the kinematics of thick disk stars (see Binney et al. 2014; Sharma et al. 2014, for a recent discussion on how Gaussian functions poorly fit all velocity components). Further, substructures have also been reported in the thick disk (e.g. Gilmore et al. 2002; Navarro et al. 2004; Helmi et al. 2006), identified through statistical comparisons with Galactic models or with simple kinematic models such as those discussed above.
Many of these substructures have been attributed to accretion events, as these typically leave behind streams of stars with similar velocities that do not necessarily appear to be spatially coherent near the Sun because of the short mixing timescales in the inner Galaxy. However, recent modeling has shown that the impact of spiral arms (Solway et al. 2012; Faure et al. 2014) and the Galactic bar on the kinematics of stars in the thick disk is non-negligible. For example, Monari et al. (2013) and Monari (2014) have found in their simulations that there is as much resonant trapping in the thick disk as in the thin disk. Another clear signature of the impact of the bar in their thick disk simulations is a bimodality in the velocity distribution for stars located near the Outer Lindblad Resonance, similar to that observed in the thin disk.
Here we explore whether these features are present in local samples of thick disk stars, especially now that such samples have increased in size by large factors, (as in e.g. LAMOST and SEGUE, Cui et al. 2012 and Yanny et al. 2009, respectively). For example the Geneva-Copenhagen survey contained stars, while stars have now been measured by the RAdial Velocity Experiment (RAVE) (Steinmetz et al. 2006). We report on the analysis of the local RAVE dataset, and find indeed clear asymmetries/structures in the velocity distributions of local thick disk stars, which can be attributed to the resonant interaction with the Galactic bar. In Section 2 we present the dataset and the selection of the different populations, in Section 3 the analysis, and we conclude in Section 4 with a discussion on the implications of our findings.
2. Observations and data selection
In this study we use the RAVE Data Release 4 (DR4) (Kordopatis et al. 2013b). The stellar atmospheric parameters of the DR4 are computed using two different pipelines, presented by Kordopatis et al. (2011) and Siebert et al. (2011). The stellar parallaxes that we use were obtained through the Bayesian distance-finding method of Binney et al. (2014).
First we select stars with i) signal-to-noise ratio better than 20, ii) the first morphological flag indicating that they are normal stars (Matijevič et al. 2012), and iii) converged algorithm of computation of the physical parameters. From these, we further select those in a cylinder with radius of centred on the Sun’s position. This results in a sample of 162153 stars with 6D phase-space information, of which are dwarf stars and are giants. The DR4 proper motions were compiled from several catalogs and here we use UCAC4 (Zacharias et al. 2013).
Following Reid et al. (2014) we assume that the Sun is at and take a circular velocity at the Sun of . For the velocity of the Sun with respect to the Local Standard of Rest we adopt (Schönrich et al. 2010). The resulting value of is , which is compatible with that from the reflex motion of the Sgr A* (Reid & Brunthaler 2004). With these values, we compute the stars’ cylindrical velocities: (positive towards the Galactic center, in consonance with the usual velocity component) and (towards the direction of rotation).
| N | RAVE-fit | fit 2 | ||||||||||||
|---|---|---|---|---|---|---|---|---|---|---|---|---|---|---|
| thin | thick | halo | thin | thick | ||||||||||
| 1 | 47883 | 0.05 | 0.05 | 5.0 | 4.3 | 3.3 | 0.10 | 96 | 4 | 0.5 | 99.8 | 0.2 | ||
| 2 | 5123 | 0.38 | 0.13 | 15.7 | 15.1 | 5.2 | 0.10 | 0.2 | 88 | 11 | 13 | 87 | ||
| 3 | 21624 | 0.06 | 0.06 | 6.6 | 5.0 | 4.0 | 0.12 | 0.7 | 78 | 22 | 3 | 97 | ||
| 4 | 2939 | 0.40 | 0.13 | 17.3 | 18.0 | 5.4 | 0.10 | 0.003 | 68 | 32 | 0.7 | 99.3 | ||
From the selected sample we consider 4 different subsets of stars based on their height and their metallicity to maximize or minimize the number of thin or thick disk stars. The properties of each subset and relative thin/thick/halo fractions are listed in Table 1. Two of the subsets are located on the plane but have metallicities corresponding to thin (1) and to thick (3) disk components, respectively. The other two are located far from the plane and have intermediate (2) and low (4) metallicities and could be both associated with the thick disk.
For each subset it is important to estimate the fraction of stars that could belong to a different population than desired. We have derived two different estimates of these fractions for each of the samples. The first estimate, which we term RAVE-fit, is based on an admittedly simplistic three Gaussian population model (old thin disk, thick disk and halo) fit to the metallicity distribution to RAVE data by Kordopatis et al. (2013a, their tables 1 and 2). We use the fits derived for all stars with galactocentric radius between and , to estimate the population fraction for samples (1) and (3). Since these samples have an additional constraint, namely , the fractions of thick disk and halo stars are probably overestimated. For samples (2) and (4) we use the RAVE fits derived for stars in the same radial range. In this case, since in our samples we consider all stars with , it is likely that the fraction of thin and thick disk stars is underestimated, while that of the halo is overestimated. In fact, if we assume that the halo has no net rotation and that all stars with belong to the halo, we can estimate the fraction of halo stars as twice that of stars with . We find this to be of only 3%, 0.7% and 4% for samples (2), (3) and (4), respectively, i.e. much smaller than the fractions obtained through the RAVE-fit.
The second estimate (fit 2) of the contamination in our subsets is based on a simple model with two populations (thin and thick disk) with specified density and metallicity distributions. We use two exponential disks with vertical scale heights of and and scale lengths of and 111The scale lenghts and density normalization of the disks are uncertain, see e.g. Bensby et al. 2011)., and a local density normalization of , all as measured by Jurić et al. (2008)222Robin et al. (2003) gives a normalization of for the intermediate-age to old thin to thick disk. This would yield an even lower thin disk contamination in samples (2) to (4).. We also assume Gaussian metallicity distributions with means and and dispersions and (similar to the intermediate-old thin and thick disk populations of Robin et al. 2003, respectively). We estimate the fraction of each population by integrating between the given ranges of metallicities and heights. For samples (2) and (4) we assume a maximum height of .
The population fractions estimated with the two methods (RAVE-fit and fit 2) indicate that the contamination of thick disk stars in sample (1) is very low. On the other hand, samples (2), (3) and (4) are clearly dominated by the thick disk as desired.
3. Statistical analysis
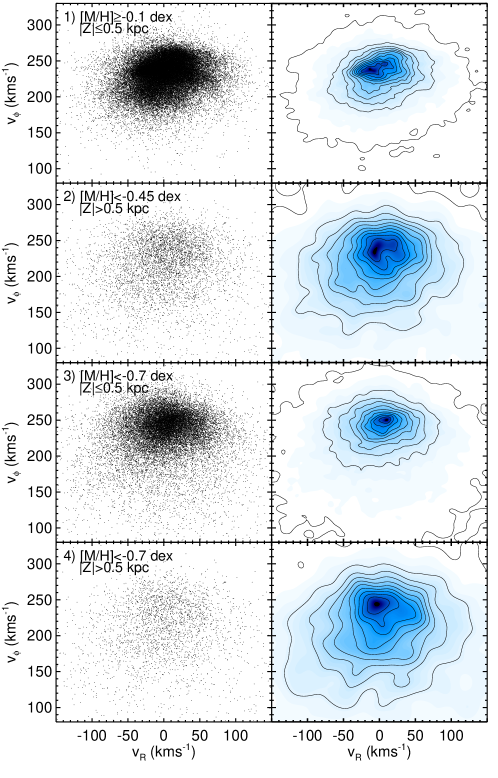
In Fig. 1 we show the velocity distributions of the different samples using scatter plots (left) and a kernel density estimator (right, see caption for details). The velocity distribution of the thin disk, subset (1), is not homogeneous and depicts overdensities and asymmetries, as already reported in Antoja et al. (2012) for RAVE thin disk stars. We see a clear asymmetry: stars with are shifted to the left part of the distribution (). Interestingly, this asymmetry is visible in the thick disk subsets for both scatter and density plots shown in the remaining panels.
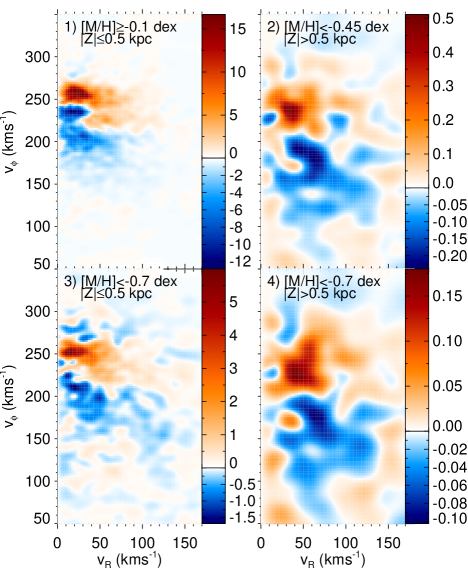
To study this in more detail, we use the density field shown in the right panels of Fig. 1 to compute the difference between regions with positive and negative . In practise, if is the density in a certain pixel of the grid (of size) and is the number for the symmetric pixel , we compute . This quantity is plotted in Fig. 2. Red colors indicate (more stars with ), and blue colors .
The upper left panel in Fig. 2, corresponding to the thin disk sample, clearly shows that the region with has an excess of stars with , while the contrary is true for . This separation is not at constant for all (i.e horizontal in the - diagram) but rather varies with . The other three panels, corresponding to the thick disk subsets, depict a similar asymmetry. However, in these cases, the asymmetry is not as sharp and clear as for the thin disk set. This is probably due to the larger velocity errors and to the lower number of stars, especially for samples (2) and (4). Nevertheless, the asymmetry is very clear for sample (3), and it is located roughly at the same velocities as for sample (1). Despite limitations for samples (2) and (4), it is still clear that red colors dominate the half upper part of the distribution while blue colors dominate in the other half 333Note that a wrong assumption of the peculiar velocity of the Sun would also produce an asymmetry in the counts of with respect to , but this would be positive or negative everywhere and would not depend on as we see here. Note also that a different assumption of the values for , and can not produce the observed asymmetries, only shifting the positions or the velocity ..
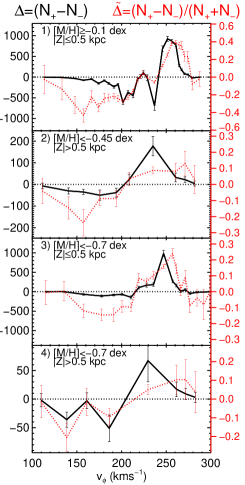
The left panel of Fig. 3 is a one-dimensional version of Fig. 2, where we plot for each the difference between the counts for () and those for (). We use the method presented in Scargle et al. (2013) and implemented in VanderPlas et al. (2012) to bin the data in . It is a non-parametric technique that finds the optimal data segments of variable size that maximize a certain fitness function in a Bayesian likelihood framework and based on Poissonian statistics. Although the binning choice is arbitrary, we have checked that our conclusions do not change if we use bins of equal size or bins with equal number of stars. For this figure we plot also in red (right vertical axis) the relative asymmetry in the counts, i.e. .
This plot shows the trend already highlighted in the two-dimensional plots of Fig. 2. There is a large asymmetry in the counts towards that peaks at and extends from to . A smaller but significant (note the small errors) asymmetry is detected for velocities below and at least down to . This asymmetry is in a region of the velocity plane with a lower number of stars, and is thus better seen for the red curves which corresponds to the normalized counts .
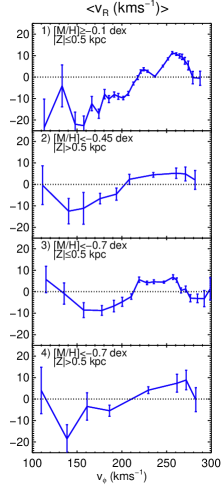
On the right panel of Fig. 3 we show the mean as function of for all the subsets using the same binning as before. The shape of these curves are similar to those on the left plot. This is because an excess of counts for positive reflects in a positive mean , and conversely. The change in sign of the mean is significant for all four samples and occurs at . It is noteworthy that the negative asymmetry seen both in the counts and in the mean extends well into low , a region more often thought to be characteristic of accretion events. For instance, this is where the Arcturus stream is also located (Navarro et al. 2004).
For the thin disk sample (top panels of Fig. 3) we observe also other smaller bumps and more detailed features. In particular, two clear positive peaks are seen both in the counts and in the mean . These are due to known kinematic over-densities in the Solar Neighborhood. Some hints of similar bumps (e.g. at and at ) are also seen for the thick disk sample (3).
The results presented above are robust to the specific choice of proper motion catalog, as we have checked that no significant differences are seen when using other catalogs, namely UCAC2 and UCAC3 (Zacharias et al. 2010, and references therein), Tycho-2 (Høg et al. 2000) and PPMXL (Roeser et al. 2010). We also obtained the same results when we scaled the distances by factors of 0.8 and 1.2, i.e. assuming that the distances were overestimated and underestimated by 20%, respectively. Furthermore the choice of the volume of the cylinder has no effect on our results: stars with the same cuts but located in a cylindrical ring of radius between 0.5 and (dominated by giant stars instead of by dwarfs as in our initial cylinder) show the same asymmetries.
As mentioned in Section 1, the main effect of the bar on the local velocity distribution is a bimodality in the velocity distribution near the Outer Lindblad Resonance (Kalnajs 1991; Dehnen 2000). This produces the Hercules stream, an excess of stars with negative at velocities around (heliocentric velocity ), and the dominant mode of low-velocity stars centered around the local standard of rest () and with an elongation through positive . We believe that the asymmetries that we observe have the same origin.
4. Discussion and Conclusions
We have found clear asymmetries in the - velocity distributions of thin and thick disk stars near the Sun. In the thin disk such asymmetries are due to well-known over-densities such as the Hercules stream, which has been explained by the resonant effects of the bar near its OLR.
This is the first time that the same type of structures and asymmetries are seen in the thick disk. The features are significant for the three different thick disk samples considered based on metallicity and height above the plane, which we have estimated to have low contamination from thin disk and halo stars. These findings suggest that the Galactic bar leaves strong imprints on both the thin and thick disk.
It is clear that the observed velocities are highly skewed, not following a Gaussian distribution. Binney et al. (2014) also showed that the radial and vertical velocities can not be fitted by Gaussian functions not only due to moving groups but also because they peak more sharply than Gaussians. Our results also imply that the velocities of thick disk stars should no longer be described by independent Schwarzschild, multivariate Gaussian or purely axisymmetric distributions: the reported asymmetry is both and dependent. The RAVE dataset has also shown peculiar vertical velocity patterns (Williams et al. 2013) and other studies based on simulations have found that the non-axisymmetries of the Galaxy can also influence the vertical velocity distribution (Faure et al. 2014). It follows that that dynamical models of the Galaxy must fit the 3D velocity distributions, rather than the projected 1D.
Simulations show that the deformations and over-densities of the velocity distribution caused by the bar change with position (both in radius and azimuthal angle) in the thin (e.g. Dehnen 2000; Antoja et al. 2014) and in the thick disk as well (Monari et al. 2013). This implies that the asymmetries in the velocity distribution of the thick disk must change with spatial position. Interestingly, rotational lags and asymmetries in the thick disk were reported by Humphreys et al. (2011) and Jayaraman et al. (2013), which may be further evidence of this. Future modeling of the velocity distributions must therefore be position dependent. One should notice that the asymmetry projects differently on line of sight and transverse velocity, creating different signatures.
This also implies that the nature of previously found substructures in the thick disk needs to be revisited as these could be associated with dynamical resonances rather than to accretion events. Specifically, the Arcturus stream would seem to be naturally explained in this way, being an extension towards lower velocities, which would also be favored given its chemical abundances (Williams et al. 2009), and hence there would be no need to invoke any accretion events nor ringing due to a past merger event (Minchev et al. 2009). Also the substructure reported by Gilmore et al. (2002) could perhaps be explained along similar lines, although it was suggested that this is part of a metal-weak thick disk (Kordopatis et al. 2013c). The role of the bar on the formation of such structures should thus be investigated.
It is clear that with the advent of larger and more precise samples of the disk kinematics we are entering a new era where the classic velocity distribution models are not sufficient and the effects of the non-axisymmetry in the disk have to be taken into account in the modeling. This is particularly relevant now given that in approximately two years time the first Gaia data will be published and we expect to detect these and perhaps other asymmetries far beyond the Sun.
References
- Antoja et al. (2008) Antoja, T., Figueras, F., Fernández, D., & Torra, J. 2008, A&A, 490, 135
- Antoja et al. (2011) Antoja, T., Figueras, F., Romero-Gó mez, M., et al. 2011, MNRAS, 418, 1423
- Antoja et al. (2012) Antoja, T., Helmi, A., Bienaymé, O., et al. 2012, MNRAS, 426, L1
- Antoja et al. (2014) Antoja, T., Helmi, A., Dehnen, W., et al. 2014, A&A, 563, A60
- Bensby et al. (2011) Bensby, T., Alves-Brito, A., Oey, M. S., Yong, D., & Melendez, J. 2011, ApJL, 735, L46
- Binney et al. (2014) Binney, J., Burnett, B., Kordopatis, G., et al. 2014, MNRAS, 437, 351
- Binney et al. (2014b) Binney, J., Burnett, B., Kordopatis, G., et al. 2014, MNRAS, 439, 1231
- Cui et al. (2012) Cui, X.-Q., Zhao, Y.-H., Chu, Y.-Q., et al. 2012, Research in Astronomy and Astrophysics, 12, 1197
- Dehnen (2000) Dehnen, W. 2000, AJ, 119, 800
- Dehnen (1998) Dehnen, W. 1998, AJ, 115, 2384
- De Simone et al. (2004) De Simone, R. S., Wu, X., & Tremaine, S. 2004, MNRAS, 350, 627
- Famaey et al. (2005) Famaey, B., Jorissen, A., Luri, X., et al. 2005, A&A, 430, 165
- Faure et al. (2014) Faure, C., Siebert, A., & Famaey, B. 2014, MNRAS, 440, 2564
- Gilmore et al. (2002) Gilmore, G., Wyse, R. F. G., & Norris, J. E. 2002, ApJ, 574, L39
- Helmi et al. (2006) Helmi, A., Navarro, J. F., Nordström, B., et al. 2006, MNRAS, 365, 1309
- Høg et al. (2000) Høg, E., Fabricius, C., Makarov, V. V., et al. 2000, A&A, 355, L27
- Holmberg et al. (2009) Holmberg, J., Nordström, B., & Andersen, J. 2009, A&A, 501, 941
- Humphreys et al. (2011) Humphreys, R. M., Beers, T. C., Cabanela, J. E., et al. 2011, AJ, 141, 131
- Jayaraman et al. (2013) Jayaraman, A., Gilmore, G., Wyse, R. F. G., Norris, J. E., & Belokurov, V. 2013, MNRAS, 431, 930
- Jurić et al. (2008) Jurić, M., Ivezić, Z., Brooks, A., et al. 2008, ApJ, 673, 864
- Kalnajs (1991) Kalnajs, A. J. 1991, Dynamics of Disk Galaxies, ed. B. Sundelius, 323
- Kordopatis et al. (2011) Kordopatis, G., Recio-Blanco, A., de Laverny, P., et al. 2011, A&A, 535, A106
- Kordopatis et al. (2013a) Kordopatis, G., Gilmore, G., Wyse, R. F. G., et al. 2013a, MNRAS, 436, 3231
- Kordopatis et al. (2013b) Kordopatis, G., Gilmore, G., Steinmetz, M., et al. 2013b, AJ, 146, 134
- Kordopatis et al. (2013c) Kordopatis, G., Hill, V., Irwin, M., et al. 2013c, A&A, 555, A12
- Matijevič et al. (2012) Matijevič, G., Zwitter, T., Bienaymé, O., et al. 2012, ApJS, 200, 14
- McMillan (2011) McMillan, P. J. 2011, MNRAS, 418, 1565
- Minchev et al. (2009) Minchev, I., Quillen, A. C., Williams, M., et al. 2009, MNRAS, 396, L56
- Monari (2014) Monari, G. 2014, PhD thesis, University of Groningen
- Monari et al. (2013) Monari, G., Antoja, T., & Helmi, A. 2013, ArXiv e-prints, arXiv:1306.2632
- Navarro et al. (2004) Navarro, J. F., Helmi, A., & Freeman, K. C. 2004, ApJ, 601, L43
- Perryman et al. (1997) Perryman, M. A. C., Lindegren, L., Kovalevsky, J., et al. 1997, A&A, 323, L49
- Reid & Brunthaler (2004) Reid, M. J., & Brunthaler, A. 2004, ApJ, 616, 872
- Reid et al. (2014) Reid, M. J., Menten, K. M., Brunthaler, A., et al. 2014, ApJ, 783, 130
- Robin et al. (2003) Robin, A. C., Reylé , C., Derrière, S., & Picaud, S. 2003, A&A, 409, 523
- Roeser et al. (2010) Roeser, S., Demleitner, M., & Schilbach, E. 2010, AJ, 139, 2440
- Scargle et al. (2013) Scargle, J. D., Norris, J. P., Jackson, B., & Chiang, J. 2013, ApJ, 764, 167
- Schönrich et al. (2010) Schönrich, R., Binney, J., & Dehnen, W. 2010, MNRAS, 403, 1829
- Sellwood (2010) Sellwood, J. A. 2010, MNRAS, 409, 145
- Sharma et al. (2014) Sharma, S., Bland-Hawthorn, J., Binney, J., et al. 2014, ApJ, 793, 51
- Siebert et al. (2011) Siebert, A., Williams, M. E. K., Siviero, A., et al. 2011, AJ, 141, 187
- Silverman (1986) Silverman, B. W. 1986, Density estimation for statistics and data analysis
- Solway et al. (2012) Solway, M., Sellwood, J. A., & Schönrich, R. 2012, MNRAS, 422, 1363
- Steinmetz et al. (2006) Steinmetz, M., Zwitter, T., Siebert, A., et al. 2006, AJ, 132, 1645
- VanderPlas et al. (2012) VanderPlas, J., Connolly, A. J., Ivezic, Z., & Gray, A. 2012, in Proceedings of Conference on Intelligent Data Understanding (CIDU), pp. 47-54, 2012., 47–54
- Williams et al. (2009) Williams, M. E. K., Freeman, K. C., Helmi, A., & the RAVE collaboration. 2009, in IAU Symposium, Vol. 254, IAU Symposium, ed. J. Andersen, J. Bland-Hawthorn, & B. Nordström, 139–144
- Williams et al. (2013) Williams, M. E. K., Steinmetz, M., Binney, J., et al. 2013, MNRAS, 436, 101
- Yanny et al. (2009) Yanny, B., Rockosi, C., Newberg, H. J., et al. 2009, AJ, 137, 4377
- Zacharias et al. (2013) Zacharias, N., Finch, C. T., Girard, T. M., et al. 2013, AJ, 145, 44
- Zacharias et al. (2010) Zacharias, N., Finch, C., Girard, T., et al. 2010, AJ, 139, 2184