Kuiper belt structure around nearby super-Earth host stars
Abstract
We present new observations of the Kuiper belt analogues around HD 38858 and HD 20794, hosts of super-Earth mass planets within 1 au. As two of the four nearby G-type stars (with HD 69830 and 61 Vir) that form the basis of a possible correlation between low-mass planets and debris disc brightness, these systems are of particular interest. The disc around HD 38858 is well resolved with Herschel and we constrain the disc geometry and radial structure. We also present a probable JCMT sub-mm continuum detection of the disc and a CO J=2-1 upper limit. The disc around HD 20794 is much fainter and appears marginally resolved with Herschel, and is constrained to be less extended than the discs around 61 Vir and HD 38858. We also set limits on the radial location of hot dust recently detected around HD 20794 with near-IR interferometry. We present HARPS upper limits on unseen planets in these four systems, ruling out additional super-Earths within a few au, and Saturn-mass planets within 10 au. We consider the disc structure in the three systems with Kuiper belt analogues (HD 69830 has only a warm dust detection), concluding that 61 Vir and HD 38858 have greater radial disc extent than HD 20794. We speculate that the greater width is related to the greater minimum planet masses (10-20 vs. 3-5 ), arising from an eccentric planetesimal population analogous to the Solar System’s scattered disc. We discuss alternative scenarios and possible means to distinguish among them.
keywords:
planetary systems: formation — planet-disc interactions — circumstellar matter — stars: individual: HD 20794 — stars: individual: 61 Vir — stars: individual: HD 69830 — stars: individual: HD 388581 Introduction
The first evidence for the existence of a planetary system other than our own was arguably the image of the debris disc around Pictoris (Smith & Terrile, 1984). With the contemporaneous discovery of many other examples of the “Vega phenomenon” with the IRAS satellite (Aumann et al., 1984), it was soon realised that the dust in these systems was the product of collisions between larger planetesimals (Backman & Paresce, 1993), the same building blocks thought to build the planets now seen around hundreds of stars.
Despite a clear conceptual connection between planets and debris discs, both being a product of some degree of planet formation, there has until recently been surprisingly little evidence of statistically significant correlations between the two (e.g. Bryden et al., 2009; Kóspál et al., 2009; Kennedy & Wyatt, 2012; Morales et al., 2012). However, with many nearby stars observed with both the Spitzer (Werner et al., 2004) and Herschel111Herschel is an ESA space observatory with science instruments provided by European-led Principal Investigator consortia and with important participation from NASA. (Pilbratt et al., 2010) observatories, and the continual increase in the sensitivity of radial velocity surveys for planets, the first correlations have begun to emerge (Wyatt et al., 2012; Marshall et al., 2014). Wyatt et al. (2012) reported that of 6 out of the 60 nearest G-type stars with close-in low-mass planets and no known planets above a Saturn-mass, 4 have relatively bright debris discs (i.e. at least an order of magnitude brighter than our Edgeworth-Kuiper belt; HD 20794, 61 Vir, HD 69830, HD 38858). This high detection rate is in contrast with a detection rate of 15% around normal Sun-like main-sequence stars (Trilling et al., 2008), which is comparable with that for stars with more massive planets, suggesting there is some kind of link between low-mass planets and the brightness of the debris in those systems. A decreased ability of low-mass planets to eject planetesimals compared to gas giants is a possible explanation (e.g. Payne et al., 2009; Wyatt et al., 2012).
With only a handful of low-mass planet + disc systems, the cause of such a correlation remains unclear, so characterisation of the four G-type systems that contribute to this correlation is a first step towards an understanding. Of those four, resolved imaging of 61 Vir was presented and discussed by Wyatt et al. (2012), and HD 69830, which only hosts warm dust that was not detected by Herschel (Marshall et al., 2014), has been discussed in numerous studies (Beichman et al., 2005; Lisse et al., 2007; Smith et al., 2009; Beichman et al., 2011). Here, we present new Herschel PACS observations of the remaining two systems; HD 38858 and HD 20794. The former hosts a bright and well resolved debris disc, so was also observed with SCUBA-2 and RxA3 on the JCMT. The latter hosts one of the faintest debris discs known, and at only 6 pc and with three low-mass planets is clearly a system of high interest. In what follows we present and describe the observations, derive constraints on the disc spatial structure, present upper limits on undiscovered planets using radial velocity (RV) data, and discuss the disc structure and possible relations with the planets.
2 The HD 38858 and HD 20794 systems
We begin by describing the previously known stellar and planetary properties of our systems. HD 38858 (HIP 27435) is a nearby (15.2 pc) Sun-like (G4V) star. Stellar age estimates vary from as young as 200 Myr (Casagrande et al., 2011), to as old as 2.32 to 8.08 Gyr (Takeda et al., 2007), and 9.3 Gyr (Sousa et al., 2010). The star is known to host a cool debris disc, which was first detected with Spitzer (Beichman et al., 2006). As noted by Krist et al. (2012), the disc was found to be marginally resolved at 70 m with Spitzer with an inclination of 48∘, position angle of 56∘, and a radius 135 au (9″, no uncertainties given). The star was observed with the Precision Integrated Optics Near Infrared ExpeRiment (PIONIER, Le Bouquin et al., 2011) in search of a resolved excess, and the 3 upper limit on the disc/star flux ratio in the H-band is 1% (Ertel et al., 2014). The star has been reported to host a super-Earth mass planet (Mayor et al., 2011), for which we provide an update on the orbit below (Marmier et al. in preparation).
HD 20794 (HIP 15510) is a nearby (6 pc) Sun-like (G8V) star. Stellar age estimates vary from as young as 3.9 Gyr (Casagrande et al., 2011), through intermediate ages of 5.2 to 6.2 Gyr (Vican, 2012) and up to 11.3 Gyr (Holmberg et al., 2009). The star has been found to host two robust low-mass planets, with a possible third planet (Pepe et al., 2011). The star was subsequently found to host a debris disc using archival Spitzer data, as described by Wyatt et al. (2012), who also reported a detection with Herschel that we elaborate on below. This star was also observed with PIONIER, resulting in a significant -band disc/star flux ratio of (Ertel et al., 2014).
3 Debris Disc Observations
Here we present new observations of HD 38858 with several different instruments. It was observed by Herschel (Pilbratt et al., 2010) under the auspices of the Search for Kuiper-belts ARound Planet-host Stars (SKARPS) survey (e.g. Kennedy et al., 2013), and by the new Submillimetre Common User Bolometer Array (SCUBA-2) as part of the SCUBA-2 Observations of Nearby Stars (SONS) James Clerk Maxwell Telescope (JCMT) Legacy survey (Panić et al., 2013). Finally, HD 38858 has also been observed in search of CO J=2-1 emission using the RxA3 receiver on the JCMT.
We also present a detailed analysis of observations of HD 20794 with the Herschel PACS instrument, observed as part of the Disc Emission via a Bias-free Reconnaissance in the Infrared/Submillimetre (DEBRIS) survey. The disc around this star is very faint compared to HD 38858, so it was not selected for the any of our JCMT programmes due to the high probability of a non-detection.
3.1 HD 38858
3.1.1 Herschel PACS
| Target | ObsIds | Date | (m) | Duration (s) |
|---|---|---|---|---|
| HD 20794 | 1342216456/7 | 20 Mar 2011 | 100 | |
| HD 20794 | 1342234096/7 | 14 Dec 2011 | 70 | |
| HD 38858 | 1342242537/8 | 28 Mar 2012 | 70 |
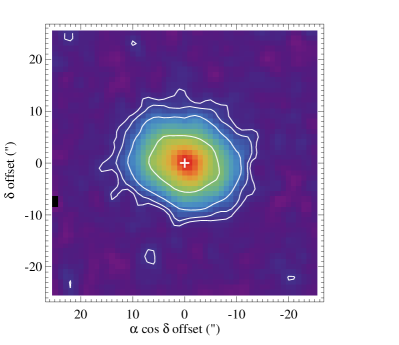
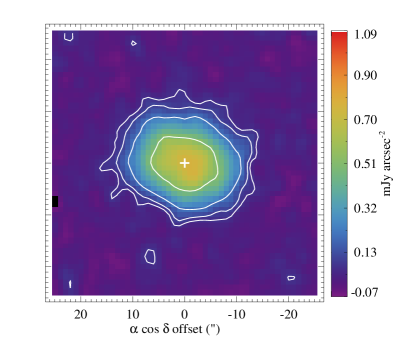
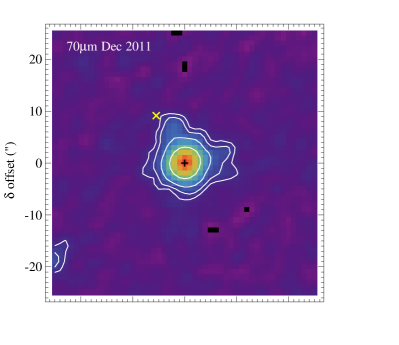
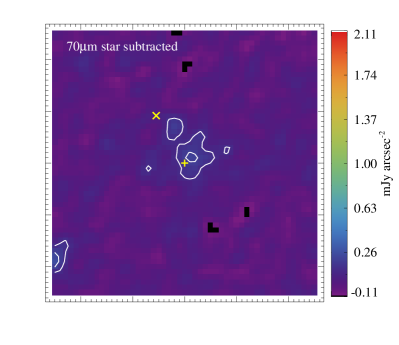
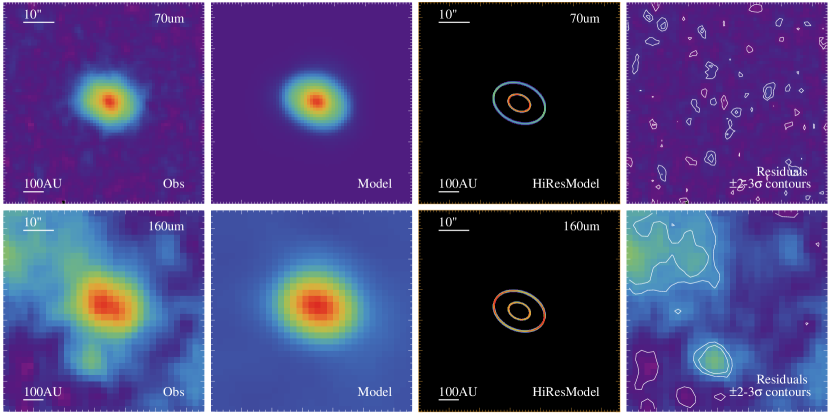
HD 38858 was observed with the Herschel Photodetector Array Camera and Spectrometer (PACS, Poglitsch et al., 2010) instrument at 70 and 160 m as part of the SKARPS open time programme (see Table 1). The 70 m image of HD 38858 is shown in Fig. 1. The left panel shows the original image and the stellar emission has been subtracted from the right panel. Most of the 70 m emission clearly originates in the disc, and the full-width at half-maximum (FWHM) PACS beam size at 70 m is about 6″ so the disc is clearly resolved. The disc is approximately 15″ across, so the system distance of 15.2 pc implies a disc diameter of around 225 au, similar to the size estimated from Spitzer (Krist et al., 2012). We return to the disc properties and geometry in section 4.1.
Measuring the brightness of the star+disc in the PACS image is fairly straightforward for HD 38858. The disc is well resolved so we use a 20″ radius aperture that is centred on the peak emission location (and about 3″ from the expected stellar position, so consistent with the pointing uncertainty). After aperture correction we find a flux density of mJy at 70 m, and of mJy at 160 m. The uncertainty is estimated by the mean value of a number of 20″ apertures placed randomly in high coverage regions in each map, and is added in quadrature to the calibration uncertainty (which is included above, and dominates the 70 m uncertainty). The uncertainty is several times higher at 160 m than expected simply from the PACS integration time due to a high Galactic background level. This high background level is expected in the Orion Complex, and HD 38858 was excluded from the DEBRIS survey based on such an expectation (Phillips et al., 2010). These measurements are in excellent agreement with a 70 m Spitzer measurement of mJy (Lawler et al., 2009).
3.1.2 JCMT SCUBA-2 continuum imaging
As a star with a disc bright enough for a possible detection at sub-mm wavelengths, HD 38858 was included in the SONS survey, which uses SCUBA-2 (Holland et al., 2013) to detect and image discs at 450 and 850 m. HD 38858 was observed for a total of 10 hours, made up of 20 half-hour integrations. We used the constant speed DAISY pattern, which provides uniform exposure time coverage in the central 3 arcmin-diameter region of a field (Holland et al., 2013).
The SCUBA-2 data were reduced using the Dynamic Iterative Map-Maker within the STARLINK SMURF package (Chapin et al., 2013) called from the ORAC-DR automated pipeline (Cavanagh et al., 2008). The map maker used a configuration file optimized for known position, compact sources. It adopts the technique of “zero-masking” in which the map is constrained to a mean value of zero (in this case outside a radius of 60″ from the center of the field), for all but the final interation of the map maker (Chapin et al., 2013). The technique not only helps convergence in the iterative part of the map-making process but suppresses the large-scale ripples that can produce ringing artefacts. The data are also high-pass filtered at 1 Hz, corresponding to a spatial cut-off of 150″ for a typical DAISY scanning speed of 155″/s. The filtering removes residual low-frequency (large spatial scale) noise and, along with the “zero-masking” technique, produces flat and uniform final images largely devoid of gradients and artefacts (Chapin et al., 2013).
To account for the attenuation of the signal as a result of the time series filtering, the pipeline re-makes each map with a fake 10 Jy Gaussian added to the raw data, but offset from the nominal map centre by 30″ to avoid contamination with any detected source. The amplitude of the Gaussian in the output map gives the signal attenuation, and this correction is applied along with the flux conversion factor derived from the calibrator observations. The final images were made by coadding the 20 maps using inverse-variance weighting, re-gridded with 1″ pixels at both wavelengths. The final images at both wavelengths have been smoothed with a 7″ FWHM Gaussian to improve the signal-to-noise ratio. The FWHMs of the primary beam are 7.9″ and 13.0″ at 450 and 850 m, respectively.
Fig. 2 shows the SCUBA-2 images overlaid as contours on the PACS 160 m data. At 450 m a 4 significant peak is seen about 10″ to the North of HD 38858. This detection is consistent with being unresolved, and has a flux density of mJy. The relatively low S/N means that the detected flux may actually originate closer to HD 38858 than 10″, but given the known high background level it is likely that this detection is not associated with HD 38858 and we do not consider it further.
At 850 m the SCUBA-2 data show a clear detection. The peak location (6) is offset from the star location by about 10″ to the East, and the centre of the 5 contour offset by about 5″. A background source is seen to the South, and probably corresponds to emission detected at 160 m at about the same location with PACS. The co-location of these sources suggests that the accuracy of the JCMT pointing for these observations is within a few seconds of arc, and splitting the SCUBA-2 data in half yields two images with similar structure. More broadly, we find no systematic pointing errors in SONS observations, for example the pre- and post-observation pointing calibrations are within about 3″ across the entire SONS survey. The 850 m flux density at the peak position is mJy/beam, and at the stellar position mJy/beam. The integrated flux within 30″radius of the peak location is mJy, the larger flux indicating that the emission covers a few JCMT resolution elements. The 3-5 contours cover the location of HD 38858, so the image could include both Orion Complex background emission to the East of the star and disc emission centred on the star. If the contamination is not severe, the disc flux lies between 3.7 and 11.5 mJy.
An alternative possibility is extra-galactic confusion; given about galaxies degree-2 brighter than 5 mJy (e.g. Blain et al., 1999), there is a 2% chance that a source as bright as the peak would appear within an aperture 15″ in radius centred on HD 38858, and a much smaller chance that such a source would be well centred on the star. Thus, the star-centred emission could arise from a galaxy with 0.2% probability, or the offset peak could arise from a galaxy with 2% probability. In the latter case the star-centred emission still requires an explanation, and adding a second galaxy lowers the probability significantly. Thus, in either case it is unlikely that the emission located at the stellar position originates from a background galaxy.
Given the small chance of contamination from background galaxies, and that some contribution from the Orion Complex is likely, we consider the SCUBA-2 emission a probable detection of emission associated with HD 38858. Our favoured interpretation is that because the 3-5 contours cover the stellar location, 850m emission from the disc is indeed detected with a flux of at least 3.5 mJy (i.e. 5 the point source uncertainty) and that the emission is shifted to the East by extended background contamination that also includes the source to the South. We illustrate this interpretation further after constructing models of the HD 38858 disc below in section 4.1.3, where we find an 850 m disc flux of mJy.
3.1.3 JCMT CO J=2-1 line emission
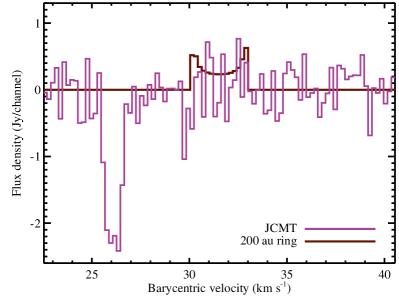
The RxA3 receiver on the JCMT was used to search for CO J=2-1 (230.538 GHz) emission towards HD 38858. The grid-chop mode was used to stare at the target while beam-switching on the sky. Standard calibration was done using hot, cold and sky loads, and inspection of spectra of standard sources. The co-added spectrum consists of 27 observations of 20 minutes duration each, over 5 nights between 12 Nov 2013 and 24 Dec 2013. The correction (main-beam) ( at the time was between 0.5 and 0.6 from measurements on Mars. The 22 individual outputs of the ORACDR pipeline were co-added using the ’wcsmosaic’ task in KAPPA. The output data have units of in K versus heliocentric velocity (radio definition) in km s-1, and are converted to Jy with multiplication by a factor of 27.4 Jy K-1. The spectral ’cube’ (1x1x2048 points) was exported to Starlink SPLAT for further reduction. The spectrum was rebinned by a factor of 5 to a 0.2 km s-1 channel width, and a low-order polynomial fit (that excluded the absorption feature described below) subtracted.
The RxA3 spectrum is shown in Fig. 3, in Jy channel-1. A spectral line associated with the star should be centred around the heliocentric stellar radial velocity of 31.54 km s-1 (Nidever et al., 2002). To guide the eye the dark red line shows an example line profile with an integrated flux of 1 Jy km s-1, calculated as the histogram of velocities for material uniformly distributed around a circular narrow ring at 200 au, with the inclination derived from the 70 m PACS image. There is no clear line emission at the expected velocity of HD 38858, but a large negative feature at 26 km s-1, which likely originates from the Orion Complex background, where CO J=1-0 emission is seen at 23.5 to 30 km s-1 (heliocentric, Wilson et al., 2005). This dip in the spectrum makes estimation of the baseline difficult; the flux in the range 27-30 km s-1 may suffer from absorption and thus the flux near the velocity of HD 38858 could be higher than estimated in Fig. 3. Future observations that find the origin of this line and subtract it will help resolve this issue.
We estimate the uncertainty on the measurement by fitting line profiles like that shown in Fig. 3 for a range of velocity widths. We first randomized the bins in the spectrum multiple times, fitting lines of a range of widths each time, resulting in a standard deviation of about 1 Jy km s-1 for radii from 50-300 au. We repeated this exercise, but at a range of locations in the non-randomized spectrum, finding similar results. We revisit the implications of this upper limit in terms of the gas mass in section 4.1.4.
3.2 HD 20794
We now turn to the observations of HD 20794. The disc around this star is much fainter than that around HD 38858 so was only observed with Herschel PACS (see Table 1). HD 20794 was first observed at 100 m and 160m, and following the possible resolution of the disc at low S/N, was re-observed at 70 and 160 m.
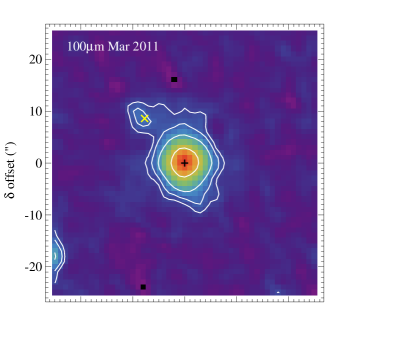
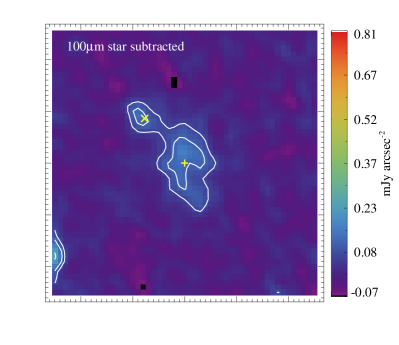
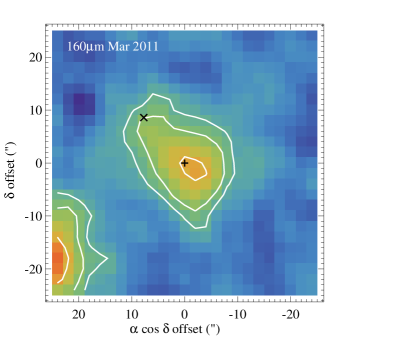
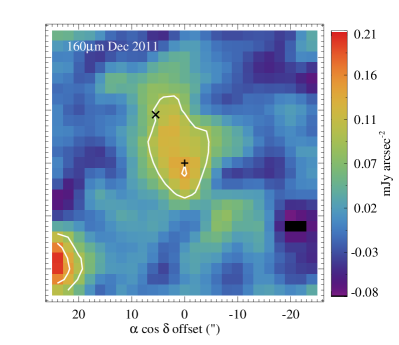
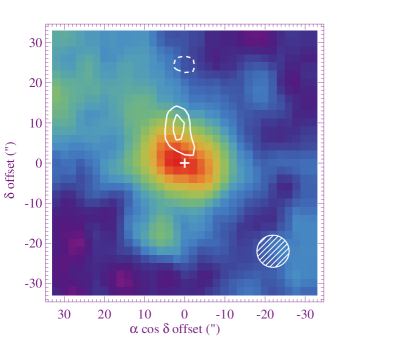
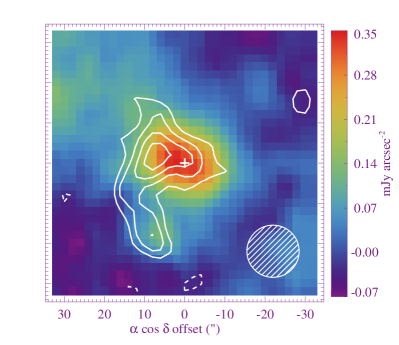
In contrast to HD 38858, most of the emission observed near HD 20794 with PACS comes from the star itself. The 70, 100, and 160 m images of HD 20794 are shown in Fig. 4. The top row of panels show the 70 m image, where the star has been subtracted in the right panel. The middle row of panels is the same, but shows the 100 m image. The bottom row shows the two 160 m images, the image in the left panel was taken at the same time at the 100 m image, the right panel at the same time as the 70 m image. The star has not been subtracted from these bottom panels.
It is clear from the 70 and 100 m star-subtracted panels in Fig. 4 (i.e. top right and middle right) that removing the stellar flux density does not account for all of the emission located at the stellar position. There is also evidence that the residual emission at the star location is resolved, as the region enclosed by the 3 contour in the star-subtracted 100 m image is elliptical with a position angle pointing slightly East of North. We return to the issue of whether the emission is resolved when modelling the disc below in section 4.2.
The 100 and 160 m images also show that there is significant emission that lies to the NE of the star, as marked by the “” symbol. HD 20794 has a high proper motion of 3.0″ yr-1 Eastwards and 0.7″ yr-1 Northwards (van Leeuwen, 2007), so the nearly year long interval between the 100 and 70 m observations means that a background object would move Westward (right) relative to the star by about 2.3″ between epochs. This movement is not easily discernible for the NE background object in these images due to a low S/N, but is possibly evident from both the change in separation and position angle of the stellar and background source emission in the 160 m images.
To measure the flux density of the star+disc emission from HD 20794 we use point-spread function (PSF) fitting. Though the disc may be marginally resolved, it is also confused to some degree by the source 10″ away to the NE. This method gives a measurement that is more robust to confusion, but that will underestimate the flux density slightly if the disc is resolved. For the PSF fitting we find mJy at 70 m, mJy at 100 m, and mJy at 160 m, including calibration uncertainties. Previous measurements at 70 m using MIPS found and mJy (Beichman et al., 2006; Gáspár et al., 2013), consistent with our measurement. Our values are also consistent with those presented in Wyatt et al. (2012). We revisit the derived fluxes when modelling the disc in section 4.2.
4 Disc models
We now consider the properties of the debris discs around HD 38858 and HD 20794. We have different levels of information about each, with the HD 38858 disc well resolved and bright, but the HD 20794 disc faint and only marginally resolved at best, so the modelling has a level of complexity that reflects this. We first consider the implications of the flux distributions inferred from the star+disc photometry, and then move onto modelling of the resolved images. For HD 38858 we also use the disc models to interpret the upper limit on CO emission and the mass of gas present.
4.1 HD 38858
4.1.1 SED
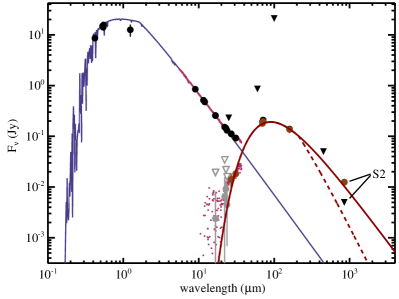
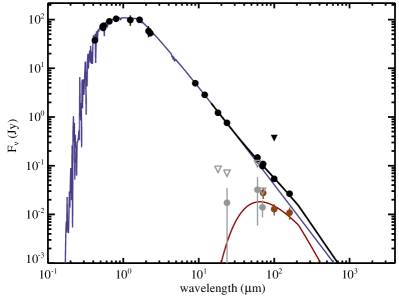
We begin the modelling of HD 38858 with the flux density distribution, which we abbreviate to “SED” for simplicity. The SED from optical to sub-mm wavelengths is shown in Fig. 5. The short-wavelength photometry comes from various sources, and includes “heritage” Stromgren and UBV bands (Hauck & Mermilliod, 1998; Mermilliod, 2006) and space-based Tycho bands (Høg et al., 2000), but the quality of the photospheric prediction ultimately relies on mid-IR photometry from IRAS, AKARI, and WISE (Neugebauer et al., 1984; Ishihara et al., 2010; Wright et al., 2010). HD 38858 was observed with the IRS spectrograph, and we use the spectrum from the CASSIS database (Lebouteiller et al., 2011). We also include Spitzer MIPS photometry from the aforementioned sources.
To construct an SED model, we fitted photometry shortward of 15 m with an AMES-Cond stellar photosphere model (Brott & Hauschildt, 2005), finding a stellar effective temperature of K and luminosity of 0.83 . With only the 5-35 m IRS spectrum, and far-IR photometry at 70 and 160 m, the spectral coverage for the disc is poor, which limits our ability to constrain the disc spectrum. For the disc we therefore simply subtract the expected stellar flux in each band, and fit the remaining fluxes with a blackbody disc model.222The AMES-Cond model spectra are computed to 1mm, so the few percent decrease in the stellar 100 m flux density relative to a Rayleigh-Jeans extrapolation from the mid-IR is included in our photospheric prediction. The temperature of this disc model is well constrained at K.
The long-wavelength part of the disc spectrum depends on our interpretation of the SCUBA-2 observations (see section 3.1.2). Assuming that the 450 m emission is not associated with HD 38858, and that the 850 m emission is partly contaminated, we find a disc flux of 7.5 mJy, and the disc spectrum is near to a pure blackbody, as shown in Fig. 5. We use a “modified” blackbody, where we multiply the spectrum by beyond m, with m and . With only a single measurement beyond 160 m, and are degenerate, and their accuracy is also limited by the systematic uncertainty introduced by our interpretation of the SCUBA-2 850 m image.
Useful disc properties that can be derived from the SED are the disc radius assuming blackbody grains, which yields 21 au (about 3″), and the disc fractional luminosity , which is . As can already be seen from Fig. 1, the disc is much larger than this estimate, indicating that the grains in the disc are hotter than blackbodies for a given location, as expected for grains that emit poorly at long wavelengths. Thus, the requirement of a nearly pure blackbody spectrum to account for the SCUBA-2 flux is surprising, since if the disc material lay at a single radius a blackbody spectrum implies that the blackbody and resolved disc sizes would agree.
However, blackbody disc spectra have been seen for other discs that appear at larger radii that their blackbody temperature suggest. In the case of AU Mic, the likely explanation is that the sub-mm observations detect the parent body distribution, which may have blackbody properties, but that far-IR observations detect a halo of smaller grains that reside on high eccentricity orbits due to radiation and/or stellar wind forces (e.g. Strubbe & Chiang, 2006; Fitzgerald et al., 2007, Matthews et al. submitted). Therefore, a discrepancy between the blackbody and observed disc sizes does not warrant the exclusion of sub-mm fluxes that result in near blackbody disc spectra.
Using the disc temperature and the SCUBA-2 observations, we can also derive the dust mass in the disc. Assuming an 850 m opacity of 45 au2 and flux of 7.5 mJy the dust mass is 0.008 . Because most bodies are expected to be much larger than the detected dust, the total disc mass is much larger, depending on the size (in km) of the largest planetesimals. Using equation (15) of Wyatt (2008) and assuming a disc radius of 60 au and a minimum grain size of 1 m yields a total disc mass , so about an Earth mass for 1 km sized planetesimals. By assuming a stellar age and that the debris disc has been evolving for all of this time, can be estimated, for example using equation (16) of Wyatt (2008), where the important proportionality here is . If we assume an age for HD 38858 of 1 Gyr and the planetesimal properties found for Sun-like stars by Kains et al. (2011), the maximum size of objects that must be present to replenish the disc over the star’s lifetime is 0.04 km, though this size is very uncertain because it depends on the square of the stellar age and planetesimal strength. For weaker planetesimals as found for A-type stars by Wyatt et al. (2007b) the size is of order 10 km. Thus, the corresponding disc mass is between about 0.1 to 3 Earth masses, and only depends linearly on the age and object strength. We can also estimate the rate at which mass is being lost from the disc as the total mass divided by the age, which yields to kg yr-1. Because the derived mass depends on the age (via ), the mass loss rate is independent of the assumed age and the main contributor to the uncertainty as calculated here is the planetesimal strength. This mass loss rate will be used when considering the mass of CO gas below in section 4.1.4.
4.1.2 Resolved models
We now construct resolved models of the PACS images of HD 38858 to constrain the disc spatial structure. For a given disc structure, we first generate high resolution images at each observed wavelength, and then convolve these with the telescope response to a point source (i.e. the PSF, which is a calibration observation of Dra) for comparison with the observations. All of our Herschel images are created with North pointing upwards, so the PSF observations, which have a different telescope orientation, must be rotated to the correct orientation.
The disc is well resolved and our unsuccessful attempts to model the 70 m image with a single narrow ring find that the disc has significant radial extension. We therefore use two similar models, one in which the disc is simply made up of two narrow dust belts, and one where the disc is radially extended. Common parameters for both models are the disc inclination and position angle (East of North), and the disc temperature profile as defined by . The factor accounts for how much hotter the dust appears compared to a blackbody at the same distance from the star, where . That is, reconciles the disc spatial structure with the SED. All models are consistent with , similar to the values found for the disc around the Sun-like star 61 Vir (Wyatt et al., 2012). We use modified blackbody parameters for the disc spectrum as described above, though here our goal is to model the disc structure as seen by PACS so they are relatively unimportant.
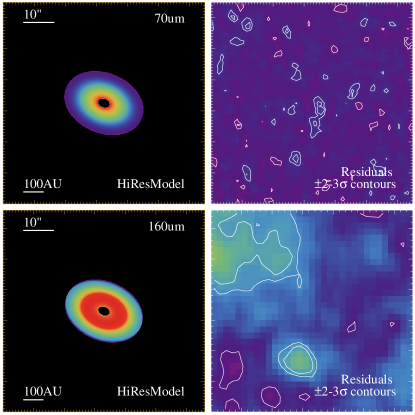

For the two ring model we use belts that are 10 au wide with constant optical depths, and the best fitting model is shown in Fig. 6. The disc inclination and position angle are 44∘ and 67∘, with estimated uncertainties of 5∘. These measurements are consistent with the geometry reported by Krist et al. (2012) from lower resolution Spitzer observations. The two rings are centred on 55 and 130 au, with face-on optical depths of and . The observed-model residuals in the right panels of Fig. 6 show that this model is a good fit to the PACS observations, with the only significant remaining structure attributable to the high background level. The model also reproduces the disc spectrum well, though a lack of far-IR photometry means that this goal is easily met.
We also considered two similar extended models for the disc. These consist of two disc zones, that extend from to , and then from to . These two zones have independent power-law optical depth profiles , where is 1 or 2 for the inner and outer zones. The absolute level of the zones is set such that the join at is smooth. The disc inclination and position angles are as in the two ring model, and allowing them to vary does not improve the model fit.
For a first model, we set and , so the optical depth increases from some inner edge to a peak value, and then decreases to the outer edge. For these assumptions we find , , and au. To explore the parameter uncertainties we construct a second model with and , for which we find , , and au. These two models are shown in Fig. 7, which both have similarly good residual images, indicating that neither of these models should be preferred relative to each other, or relative to the two ring model described above. This two zone model clearly has some degree of degeneracy, with shifting to account for changes in the optical depth profiles. The inner and outer radii are common however, suggesting that for continuous models the inner edge is around 30 au, and the outer edge around 200 au.
In comparison to the two ring model, the two zone model extends to both smaller and larger radii. This is to be expected however; a model that was continuous only between the two radii found by the two ring model would have too much emission from the region between the ring locations, so this concentration is countered by making the continuous model cover a wider range of radii.
We briefly compare the prediction of our model for the scattered light brightness with limits set by Krist et al. (2012) using the Space Telescope Imaging Spectrograph (STIS) instrument onboard the Hubble Space Telescope (HST). The limits decrease with increasing radius, being about 21 mag arcsec-2 at 3.5″ (55 au) and 23.3 mag arcsec-2 at 8.5 ″ (130 au). If we assume isotropic scattering and an albedo of 0.1, the inner component of our two belt model is too faint to detect (22 mag arcsec-2), and the outer component is near the limit of detectability. Therefore the upper limit on the albedo is about 0.5 for the inner belt, and about 0.1 for the outer belt. For the continuous model the surface brightnesses are about one magnitude fainter for an albedo of 0.1, and the inner regions of such a disc cannot be detected even with an albedo of 0.9, at which point the outer disc is at the limits of detectability. Low albedoes are generally the norm for scattered light observations of debris discs (e.g. Krist et al., 2010), with relatively strong forward scattering being a possible explanation (Min et al., 2010; Mulders et al., 2013). Therefore, the STIS observations do not set sufficiently strong limits that the dust albedo in the HD 38858 disc appears any different to discs that were detected in scattered light.
In summary, we find that several different models can reproduce the structure in the HD 38858 disc. It is not clear from the PACS data whether the disc is split into two separate components at about 55 and 130 au, or whether the disc covers a wide region from about 30 to 200 au. For the latter models, the optical depth profile is not clear because it is possible to construct a two zone model with differing profiles in each zone, depending on the radial location of the join between these zones.
4.1.3 SCUBA-2 interpretation
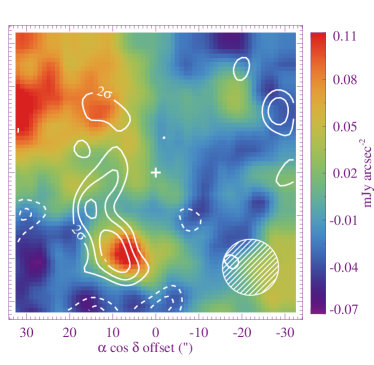
As noted in section 3.1.2, our SCUBA-2 images appear to suffer from some background contamination, most likely from the Orion Complex. As suggested by the contours in Fig. 2, the 850 m image likely also contains flux originating in HD 38858’s debris disc. Having derived possible disc structures using the PACS data, we can therefore assume that the structure is similar at 850 m and attempt to verify this interpretation.
Using the models of the disc structure derived above (which all yield similar results), Fig. 8 shows 850 m residual contours after subtracting a model with a total disc flux of 7.5 mJy. The model was created in the same way as the PACS models, but at a wavelength of 850 m and using a 13″ Gaussian for the PSF. The residuals show a “stripe” of emission to the East of the stellar position, which extends between two regions where significant residual emission remains in the 160 m image (see also Figs. 6 and 7). The choice of total disc flux is somewhat subjective, and was chosen so that the stripe is fairly uniform in brightness from North to South; we assign an uncertainty of 2 mJy (i.e. 3 higher than the point source uncertainty). That we can successfully subtract a symmetric disc model centred on the expected stellar position, and that the residual flux has good correspondence with the 160 m residual emission, shows that our interpretation is reasonable. It may of course be that the disc is asymmetric and some of the residual 850 m flux to the East actually belongs to the disc. However, given that the PACS images, that have much higher S/N, are consistent with being symmetric, we consider this possibility unlikely.
4.1.4 Gas mass
To estimate the upper limit on the total CO gas mass from our limit on the integrated J=2-1 flux (section 3.1.3), we apply the CO excitation model described in Matrà et al. (2015). The model solves the statistical equilibrium of CO rotational levels, taking into account both collisional and radiative excitation in a full non-local thermodynamic equilibrium (NLTE) approach. The radiation field impinging on CO molecules at the frequency of the transition J=2-1 (230.538 GHz) is dominated by the cosmic microwave background (CMB), with negligible contribution from both the star (beyond about 1 au) and from any of the disc models described above (regardless of location). That is, the radiative excitation of CO molecules is largely independent of their radial location. Additional excitation of the molecules by other means, most likely collisions with electrons freed from carbon ionisation following CO dissociation, will only lead to more J=2-1 emission from a fixed mass of CO. We can therefore set a hard upper limit on the total CO mass around HD 38858 of 1.5 10-4 M⊕.
The age of HD 38858 is well beyond when gas of any kind has been detected around young stars (Zuckerman et al., 1995; Moór et al., 2011; Matrà et al., 2015), so little is expected to exist in this system, and any gas that is present likely originates in icy planetesimals within the observed debris disc (e.g. Zuckerman & Song, 2012). If we assume such a second-generation scenario where the gas is composed of cometary molecules such as H2O, CO and their photodissociation products, electrons (produced via CO photodissociation followed by C ionisation) are the main colliders and we can set stricter limits on the total CO mass. Such a constraint can be illustrated by assuming a value of 100 for the C/CO ratio (as observed in Pictoris, Roberge et al., 2000), and an ionisation fraction C+/C of 1.7 (as estimated by Fernández et al., 2006, at 100 au around a G-type star). For HD38858, the interstellar UV field dominates photodissociation of CO even at the inferred inner edge of the dust disc (30 au), yielding a CO lifetime of 120 years, while H2O will be affected by the stellar radiation field, dissociating in 3 years at 30 au, and in 40 years at 200 au. For gas released from planetesimals with Solar System cometary CO/H2O abundance ratios (between 0.4 and 30%, Mumma & Charnley, 2011), electrons dominate the collisional excitation of CO. We then find a CO mass upper limit of 3.2 10-5 M⊕. While this limit depends on the above assumptions, it shows how the limit on gas can change with the scenario assumed.
We then consider what this upper limit means in terms of production and destruction of secondary gas in the system. CO is mainly destroyed via photodissociation by the interstellar UV, with a timescale of 120 years. Dividing the upper limit on CO mass by this timescale, we set an upper limit on the CO production rate of 1.6 1018 kg yr-1. On the other hand, we can estimate the CO production rate from the mass loss rate of solids through collisions in the disc (1015 to 1016 kg yr-1, section 4.1.1), where the production rate depends on the ice/rock and CO/H2O fractions. For Solar-System-type comets, we therefore obtain an observational upper limit on the CO production rate from the JCMT observations that is at least two orders of magnitude higher than the upper limit from the derived planetesimal destruction rate. Thus, the limit on CO gas is not stringent enough to test different scenarios for the production of gas by planetesimal collisions.
4.2 HD 20794
For HD 20794 we first consider the SED, and then show what the non-detection of excess at mid-IR wavelengths implies for the radial location of the dust detected by near-IR interferometry. We then turn to the images and consider the disc spatial structure.
4.2.1 SED
We follow the same procedure described above to model the HD 20794 spectrum, shown in Fig. 9. The photospheric prediction in the far-IR is well constrained by the IRAS and AKARI observations. We find a stellar effective temperature of K, and a disc temperature of K. The disc temperature is very poorly constrained due to the lack of disc detections over a range of wavelengths and because the disc is fairly faint. Despite the large temperature uncertainty, the disc fractional luminosity is reasonably well constrained to between and , because disc models that fit the disc spectrum have similar integrated luminosities. The lower end of this range is only an order of magnitude above the Solar System level of (Vitense et al., 2012).
Based on the disc temperature, the blackbody disc radius is about 10 au, or 3″ in diameter, though the uncertainty is very large because the blackbody radius is proportional to the inverse square of the temperature. This size prediction suggests however that the disc may be resolved, as was also suggested by the images in Fig. 4. We now consider the location of dust detected with near-IR interferometry, and then turn to a more detailed consideration of the PACS images to test whether the disc is indeed resolved, and if so, whether its properties can be constrained further.
4.2.2 Location of the hot dust
A near-IR excess at 1.65 m (-band), with a disc/star flux ratio of percent, was recently detected around HD 20794 by Ertel et al. (2014). Such excesses are fairly common and are thought to arise from hot dust located very near to the parent star (e.g. Defrère et al., 2011; Absil et al., 2013; Lebreton et al., 2013). Their origin remains a mystery; dust should be removed by radiation forces on orbital timescales, and local planetesimal populations that resupply the dust would be rapidly depleted to undetectable levels by collisions. There is also no support for a non-local origin, in particular because the hot dust brightness does not correlate with other system properties such as the presence of outer dust belts (but may correlate positively with stellar age, Absil et al., 2013; Ertel et al., 2014). It may be that the phenomenon is more closely related to stellar astrophysics, for example being very small dust trapped by the stellar magnetic field (Su et al., 2013), though in such a scenario the dust may still be supplied by known debris disc processes.
Among the systems detected by Ertel et al. (2014), the spectral slopes seen across the -band (1.55 to 1.75 m) are relatively flat compared to the stellar flux. In the case of HD 20794 dust cooler than about 500 K could be ruled out, and while hot dust remains a possibility, the spectrum is also consistent with arising from scattered starlight. This latter possibility means that the dust could lie anywhere within the 400 mas PIONIER field of view, and for a given surface area of dust therefore extend farther from the star than if the emission is thermal, perhaps even into the habitable zone. No excess was seen at 24m for HD 20794, so the upper limit on the dust seen at this wavelength provides useful constraints on where the hot dust lies. Deriving this constraint however requires exploration of the grain properties, in particular the albedo and the emission or scattering efficiencies at -band relative to the emission efficiency at 24 m.
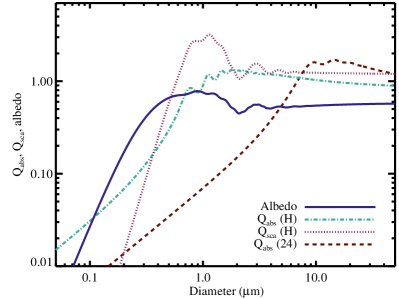
The grain scattering () and emission/absorption () efficiencies are shown in Fig. 10 (the emission and absorption efficiencies are equal). Lines show these values as a function of grain diameter for non-porous grains composed of 1/3 silicates and 2/3 organics (Augereau et al., 1999) at H-band and 24 m. The albedo, at H-band, is also shown. For small grains the albedo becomes very small because grains absorb better than they scatter, and the maximum ratio between the H-band albedo and the 24 m emission efficiency is reached for grains about 0.5 m in size. These properties set limits on the grain size if the PIONIER emission originates in scattered light, because no more than 100% of the starlight can be intercepted by the dust. That is, assuming isotropic scattering the fraction of starlight intercepted by the dust so from Fig. 10 the grains must be larger than about 0.1 m for the assumed composition. As an example the locus of possible dust locations for grains 0.5 m in size is shown as the solid line in Fig. 11. Without further constraints, the dust could lie anywhere along this line, the radius only being restricted by the PIONIER field of view. At each point along this locus however, a corresponding amount of thermal emission is expected, so some locations can be ruled out by an analogous locus derived from the 24 m non-detection.
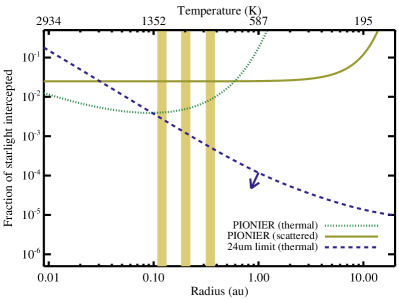
A constraint on the hot dust location based on the 24 m non-detection is shown as the dashed line in Fig. 11. This line was computed using equation (11) from Wyatt (2008), but the dust temperature and () were calculated self-consistently for 0.5 m grains. The dust must lie below the dashed line, so if the PIONIER emission originates in light scattered off 0.5 m dust with our assumed composition it lies within 0.03 au. For smaller dust the albedo becomes smaller faster than the decrease in 24 m emission efficiency, so the radial constraint becomes stronger. For larger dust the 24 m emission efficiency increases faster than the albedo so again the radial constraint is stronger.
An additional issue for a scattered light origin is forward (or backward) scattering, which could be relevant here as we infer particle sizes similar to or larger than the PIONIER-observed wavelength of 1.65 m. For a near edge-on disc the total flux can exceed that from isotropically scattering dust, and thus the solid line may be overestimated in Fig. 10. The enhancement in the disc flux required to alter our conclusions is large however; the solid line would need to move down by two orders of magnitude for the dust location to be allowed near 1 au. To make a simple estimate, we computed the integrated emission from a circular dust ring using the Henyey & Greenstein (1941) phase function. For the emission to exceed that compared to isotropic scattering by an order of magnitude requires very strong forward scattering () from a near-perfectly edge-on disc. In this case however, almost all of the emission originates from a ten-degree arc in the ring. This kind of emission would mimic the off-centre point-like emission from a companion, rather than that of a centro-symmetric disc, and the former has already been ruled out for HD 20794 (Marion et al., 2014). This illustration is of course very basic, but shows that forward scattering is very unlikely to result in a brightness enhancement that is both consistent with the PIONIER observations, and results in a much smaller fraction of starlight intercepted by the dust compared to what would be inferred assuming isotropic scattering. We therefore conclude that our constraints on the dust location (if it originates in scattered light) are robust.
The green dotted line in Fig. 11 shows the location of the hot dust if it originates in thermal emission, computed in the same way as at 24 m. Inside about 0.5 au the line lies below that for scattered light, so the same signature can be created from thermal emission but with several times less surface area in dust. The 24 m constraint still applies, so for thermal emission from 0.5 m grains the dust lies within 0.1 au. This constraint is similar for smaller grains; Fig. 10 shows that the ratio of at H-band and at 24 m is similar for grains smaller than 1 m, and thus for smaller dust both lines move upwards in concert. For larger grains the lines move downwards slightly and the radial constraint moves inwards until , and the constraints then do not change with increasing grain size (i.e. they behave as black bodies above about 10 m in size). These radial constraints on the dust location are similar for other compositions, for example the possibility that the grains contain carbon is motivated by the higher sublimation temperature (Lebreton et al., 2013). The constraint moves inwards somewhat for compositions where at 24 m relative to H-band becomes larger than the example here (e.g. due to a strong spectral feature for small silicate grains).
If the dust is long-lived, which is suggested by the relatively common detection of such dust around other stars, it would be unlikely to reside near the planets, which would rapidly accrete or scatter the dust (and any parent planetesimals that could act as a local mass reservoir). The 24 m limits rule out significant H-band emission beyond the planets, so the dust most likely lies interior to them. Thus, our analysis based on non-detection of excess emission with MIPS at 24 m suggests that the hot dust seen around HD 20794 with PIONIER lies within 0.1 au of the star (20 Solar radii).
4.2.3 Resolved models
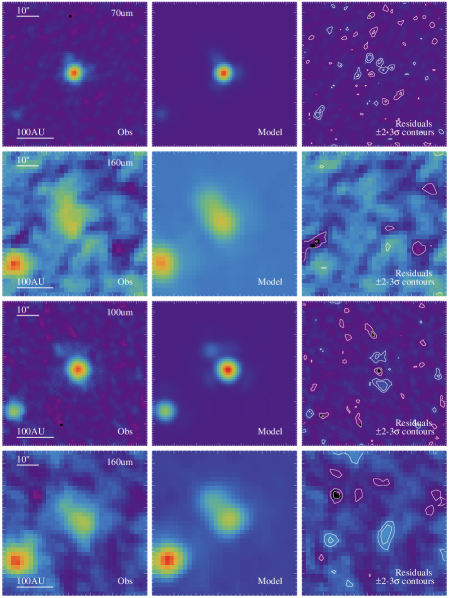
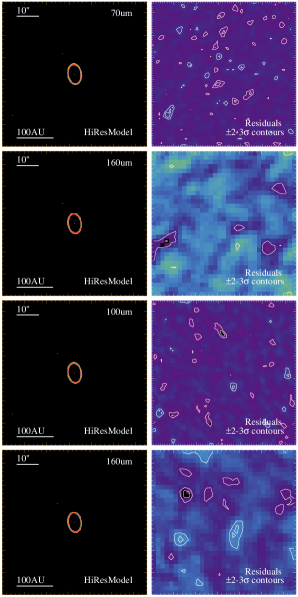
Returning to the PACS images of HD 20794, we first test whether the disc is resolved by constructing a point source model of disc emission. The components of this model are a source at the star location, the NE background source, and the bright SE background source. As in Fig. 4, we take the motion of the star between the 100 and 70 m epochs into account. The point source at the star location represents the star plus an unresolved disc. This is in fact the PSF fitting method used to derive the point source fluxes quoted in section 3.2, and the left three columns in Fig. 12 show the results of this model.
The left column shows the observations, the second column the point source model (convolved with the PACS beam), and the third column the residuals after subtracting this model from the observations. The best-fit point source fluxes (after subtraction of the stellar flux) are 10.9, 12.3, and 8.9 mJy at 70, 100 and 160 m, where the uncertainties are the same as the point source uncertainties of 5, 3, and 3 mJy given in section 3.2. In general the model is very good, finding significant fluxes (i.e. an excess), but notably leaves residuals on either side of the star at 100 m, which is the deepest image.
We therefore allow the disc component to be resolved, modelling it as a simple narrow ring of width 5 au with free parameters of disc radius, inclination, and position angle. The best fitting resolved disc model is shown in the two rightmost columns of Fig. 12, where the fourth column shows the disc model at high resolution, and the fifth column shows the residuals for this model. The model has a radius of 24 au, an inclination of 50∘, and a position angle of 8∘ E of N.
This resolved model accounts for the residual flux that was present on either side of the star for the point source model, but given that this difference lies in only a few pixels that were about 3 outliers, the extra complication added by a resolved model is only marginally warranted, and therefore uncertainties on the disc parameters are moot. Despite this issue, it seems likely that the disc is resolved with a high inclination, with a diameter of around 50 au (10″), and as one of the nearest Sun-like stars with a disc and planets is a high priority for future observations.
Given that both 61 Vir and HD 38858 host discs with significant radial extent, we can consider what the observations rule out for such extended discs around HD 20794. By analogy with the two-belt model for HD 38858, we added a second 5 au wide belt at a radius of 50 au to the resolved HD 20794 model. To remain undetected the optical depth in this belt must be less than about half the value in the inner belt. For HD 38858 the outer belt has three times greater optical depth than the inner, and for 61 Vir the two belts have similar optical depths. A basic conclusion is therefore that the material in the disc around HD 20794 is the most centrally concentrated of the three.
5 Planetary system structure
We now discuss our results within the context of the wider planetary system structure. We begin by presenting a brief update on the radial velocity (RV)-discovered planet around HD 38858, and then RV limits on undiscovered planets around HD 20794, 61 Vir (HD 115617), HD 69830, and HD 38858. A detailed analysis of the High Accuracy Radial velocity Planet Searcher (HARPS, Mayor et al., 2003) results for these systems will be presented in Marmier et al. (in preparation). We then go on to discuss possible relations between the disc structure and known and unknown planets around these stars.
HD 38858b was announced by Mayor et al. (2011), as a planet with a minimum mass of 30.55 orbiting at 1 au, using 52 RV measurements taken over eight years. With additional data it has become clear that this signal was spurious and arises due to an alias of the magnetic cycle of the star, which has a period of 2930 days. The additional data (now 96 measurements with several years more coverage) have however revealed a planetary signal with a period of days (0.64 au) and minimum mass of .
5.1 Limits on undiscovered planets
To consider the structure of the planetary systems in light of our results, we now present the limits on undiscovered planets set by HARPS data. The limits depend primarily on the RV precision ( in m s-1) and the time span over which the observations were made. The limits are therefore approximately in units of Earth masses (with in units of and in au) for orbital periods less than the span of observations, and increase very steeply for longer orbital periods (roughly as ).
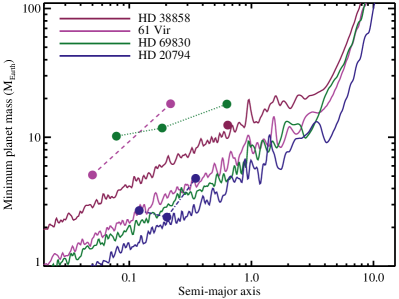
Fig. 13 shows the limits on unseen planets derived from an analysis of the HARPS RV data. In each case the planetary signals (and stellar signals where necessary) were first subtracted from the time series. Then, for each point in the mass-period diagram, a corresponding circular orbit is added to the residuals, with 20 phase values (spaced equidistantly between 0 and 2). For each phase, this process is repeated 1000 times with the residuals randomly permuted, and we consider that the synthetic planet is detected only if we see a signal in the resulting periodogram that is higher than the 1 per cent false alarm probability limit at all phases.
All four systems have been observed for a time span of about 10 years, which is reflected in the planet sensitivity in terms of semi-major axes. The differences in mass sensitivity () are almost entirely due to differences in the number of measurements, with 96 for HD 38858, 239 for HD 69830, 209 for 61 Vir, and 461 for HD 20794. Fig. 13 shows that planets interior to HD 38858b with masses greater than about 10 could have been detected in this system. Thus, while 61 Vir or HD 69830-like planetary systems can be ruled out around HD 38858, lower mass planets (as seen around HD 20794) may still be present in this system. In all cases Saturn-mass planets within about 10 au could have been detected.
5.2 Radial structure and history
Combining the RV limits, our above disc modelling results, those for 61 Vir from Wyatt et al. (2012), and those for HD 69830 from Lisse et al. (2007), Fig. 14 shows cartoon depictions of the radial structure in each system. As in Fig. 13, planet masses and the limits on undetected planets are shown. The disc extents are derived from the Herschel images, or constrained by mid-IR imaging and modelling of the disc spectrum in the case of HD 69830 (Lisse et al., 2007; Smith et al., 2009). The hatched regions cover the approximate radial locations where the dust is seen, with the solid regions for 61 Vir and HD 38858 showing the location of the two-belt models. We have not included the hot dust seen around HD 20794 (Ertel et al., 2014) as the origin of this phenomenon is unknown, and may be more related to stellar physics than planetary systems.
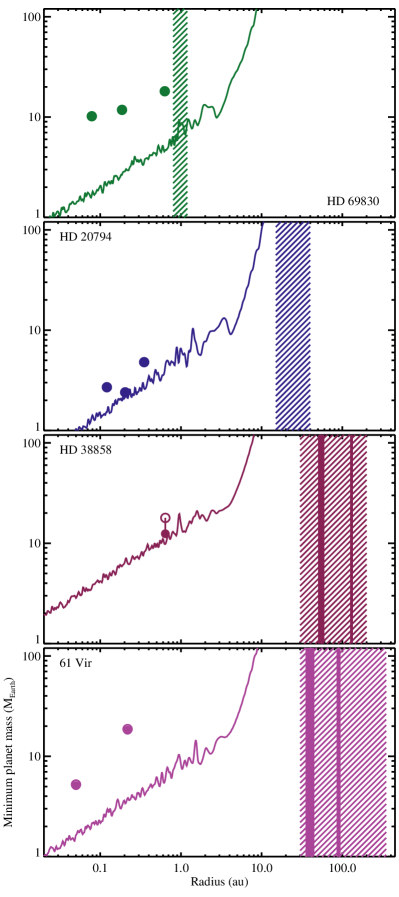
Contrasting the four systems, most notable is that HD 69830 does not possess a significant level of cool dust (Marshall et al., 2014), suggesting that this system evolved in a different way to the other three, and that the dust at 1 au is perhaps short-lived and directly linked to one or more of the three planets. This system has been discussed extensively elsewhere (e.g. Beichman et al., 2005; Alibert et al., 2006; Lisse et al., 2007; Wyatt et al., 2007a; Payne et al., 2009; Smith et al., 2009; Beichman et al., 2011), so here we focus on the remaining three.
Our main goal is to explore links between the planets and the disc structure, whether these links provide potentially useful information about the system histories, and which observations are needed to distinguish among different possibilities. We first highlight some relevant similarities and differences among these three systems: The discs around HD 20794, 61 Vir, and HD 38858 have similar inner radii of around 20-30 au, and (assuming that the minimum masses are similar to the true planet masses) the planets around 61 Vir and HD 38858 are more massive than those around HD 20794. The discs around 61 Vir and HD 38858 extend to large radii (100 au), and while the constraints are much poorer, the above modelling shows that the HD 20794 disc is at least relatively depleted outside 30 au. From the SEDs and images of 61 Vir and HD 38858 we can also be confident that the regions inside 30 au are significantly depleted of debris compared to the levels seen between 30-200 au. Being very faint and marginally resolved at best, the relative constraints for HD 20794 on the regions inside the detected belt at 20 au are poor.
Ideally we would like to link the properties of the known planets with the observed disc structure, thus avoiding the invocation of unseen planets with uncertain properties. Secular perturbations provide one way that planets can reach over large radial distances and affect planetesimal belts (e.g. Mustill & Wyatt, 2009). However, the secular perturbation timescale for the outermost planet to affect the disc inner edge is 10 Gyr for all three systems, so such a link is not possible given the current orbits of the known planets.
In the absence of strong effects from secular perturbations, we can still make a speculative link between the masses of the known planets and the radial width of the discs, which are larger for the two discs in systems with more massive planets. Super-Earths may have difficulty forming in situ (e.g. Zhou et al., 2005; Alibert et al., 2006; Raymond & Cossou, 2014; Inamdar & Schlichting, 2014), so could have formed farther out where the discs are observed (i.e. near 20 au), imprinted some structure on the disc, and then migrated inwards to their observed locations. In this kind of scenario the planet mass dependence of the disc radial width arises because more massive planets excite planetesimals to greater eccentricities. That is, at least the outer planets around HD 20794, 61 Vir, and HD 38858 all formed near the observed inner disc edges, but the 10 outer planets around 61 Vir and HD 38858 were better able to scatter planetesimals onto eccentric orbits compared to the 10 planets around HD 20794. The depletion of disc material between the current planet and disc locations is explained in this scenario by i) the use of this material to form the observed planets, and/or ii) the shepherding of this material inwards as the super-Earths migrated towards the star (e.g. Zhou et al., 2005; Kennedy & Kenyon, 2008; Izidoro et al., 2014).
By analogy with the Solar System, the radial width of the discs around 61 Vir and HD 38858 would therefore be interpreted as arising from “scattered disc”-like populations of planetesimals on eccentric orbits. A prediction of this scenario is that the radial width of the disc as observed in small dust with Herschel is a property inherited from the larger planetesimals, and therefore that the disc extent should also appear to be wide when larger grains that are less affected by radiation forces are imaged at mm wavelengths. This appearance would be in contrast to discs such as Pic and AU Mic, where the planetesimals occupy a relatively narrow “birth ring” and the small grains that are strongly affected by radiation forces reside in a wider halo (Strubbe & Chiang, 2006).
While this scenario is convenient in that it does not require undetected planets at larger semi-major axes, it is by no means unique and the sensitivity limits in Figs. 13 and 14 show that the constraints allow 10-20 planets beyond about 5 au, and Saturn-mass planets beyond 10 au.333Being old stars, these systems are not high-priority targets for high-contrast direct imaging surveys because the sensitivity to Gyr-old giant planets is poor; only HD 69830 has been observed recently, and was targeted based on the presence of the disc (Janson et al., 2013). Given the total mass of solids in a “typical” planet-forming disc is roughly 10-100 , and the gas mass 100 times greater (e.g. Weidenschilling, 1977; Andrews & Williams, 2005), the existence of more planets is certainly possible given the mass budget. Another possible scenario is therefore that the known planets formed closer to the star, or at least from material that originated closer to the star (e.g. Hansen & Murray, 2012), and that extra planets may (or may not) exist in the regions where the RV limits are poor. In this case any links between the masses of the known super-Earths and the disc structure would be far more tenuous, and likely non-existent. An obvious question is then whether undetectable planets are responsible for the different radial widths and the disc depletion inside 20 au, and which signatures can distinguish planet formation and/or planet clearing from other depletion scenarios.
Firstly, planets are not necessarily needed to clear the inner disc regions. Most simply it may be that planetesimal formation was less efficient in the 5-20 au region than elsewhere and that these regions are naturally empty. In the event that planetesimals did form in this region, Wyatt et al. (2012) show that the disc around 61 Vir may simply be collisionally depleted from the inside out, and given the uncertain stellar ages, the same argument can be applied to HD 20794 and HD 38858. This scenario predicts a characteristic slope for the brightness of the disc inner edge (Wyatt, 2008; Kennedy & Wyatt, 2010). The main prediction if the inner disc edges are instead truncated by unseen planets is that the edge should be sharper than for collisional depletion (Quillen, 2006; Mustill & Wyatt, 2012), and that any relation between the known planet masses and the disc extent is coincidental. The best way to tell how the inner disc regions were depleted is therefore to resolve the inner disc edge, a task best suited to high resolution optical or interferometric mm imaging (e.g. Kalas et al., 2005; Boley et al., 2012). The radial disc extent may of course also be related to the masses of these unseen planets, but unless these planets are detected or inferred to exist there is little power to tell whether their influence on the width was significant. However, their possible presence highlights other scenarios. The scattered disc component of the Kuiper belt formed as planetesimals were scattered by the outward migration of Neptune (Duncan & Levison, 1997), providing an alternative explanation for the wider extent of the discs around 61 Vir and HD 38858 noted above, but no reason (aside from lower planet masses or the lack of such a process) for the narrower belt around HD 20794. The additional planets required in this scenario would be very difficult to detect, so a key signature that would distinguish among these scenarios is that outward migration captures planetesimals in mean motion resonances (Wyatt, 2003), with the resultant clumpy structures expected to be detectable in high resolution sub-mm images (Ertel et al., 2012).
In summary, the greater disc radial widths and planet masses around 61 Vir and HD 38858 compared to HD 20794 are suggestive of a link between the two; the wider extent may be a signature of a scattered disc population of planetesimals that was excited by the planets before they migrated to their current locations. Being based on three systems this scenario is clearly speculative and other scenarios are of course also possible, so such ideas provide general motivation for further characterisation of these and other systems. In particular, high resolution observations that measure the shape of the inner disc edges and any azimuthal asymmetries will provide the best constraints on the structure and origins of these systems.
6 Conclusions
We present Herschel and JCMT observations of the debris discs in the Sun-like planet hosting systems HD 38858 and HD 20794. The HD 38858 disc is well resolved and spans a wide range of radii, from approximately 30-50 au to 130-200 au depending on whether the dust lies in two narrow rings or a wide continuous belt. We present a probable 850 m imaging detection of the disc and set an upper limit on the level of CO J=2-1 emission. The HD 20794 disc appears robust photometrically, but is marginally resolved at best. The disc has a probable radius of a few tens of au and is among the faintest known, with dust levels roughly one order of magnitude above the Edgeworth-Kuiper belt in the Solar System (e.g. Vitense et al., 2012). Using the non-detection of excess emission at 24 m we show that the hot dust seen with near-IR interferometry probably lies interior to the innermost planet at 0.1 au.
With the addition of 61 Vir and HD 69830, we consider the sample of four nearby G-type stars with low-mass planets and debris disc detections. We present new limits on undiscovered planets in these systems using HARPS radial velocity data, showing that regions beyond about 5 au may contain undiscovered 30 planets. With the exception of HD 69830, the detected disc components lie well beyond the known planets in these systems and various different scenarios can explain the observed system structure. A scenario that does not invoke additional planets is that the extent of the observed discs around HD 20794, 61 Vir, and HD 38858 is related to the mass of the planets, which are greater around the latter two stars. Other scenarios are possible however, and high resolution imaging that can determine the shape of the disc inner edges, and the extent of the parent planetesimals, will help distinguish among them.
Acknowledgments
We thank the referee for a thoughtful review. This work was supported by the European Union through ERC grant number 279973 (GMK, LM, & MCW). LM also acknowledges support by both STFC and ESO through graduate studentships. MM, CL, FP, & SU acknowledge the Swiss National Science Foundation (SNSF) for the continuous support of the radial-velocity research programmes.
References
- Absil et al. (2013) Absil, O., Defrère, D., Coudé du Foresto, V., Di Folco, E., Mérand, A., Augereau, J.-C., Ertel, S., Hanot, C., Kervella, P., Mollier, B., Scott, N., Che, X., Monnier, J. D., Thureau, N., Tuthill, P. G., ten Brummelaar, T. A., McAlister, H. A., Sturmann, J., Sturmann, L., & Turner, N. 2013, A&A, 555, A104
- Alibert et al. (2006) Alibert, Y., Baraffe, I., Benz, W., Chabrier, G., Mordasini, C., Lovis, C., Mayor, M., Pepe, F., Bouchy, F., Queloz, D., & Udry, S. 2006, A&A, 455, L25
- Andrews & Williams (2005) Andrews, S. M. & Williams, J. P. 2005, ApJ, 631, 1134
- Augereau et al. (1999) Augereau, J. C., Lagrange, A. M., Mouillet, D., Papaloizou, J. C. B., & Grorod, P. A. 1999, A&A, 348, 557
- Aumann et al. (1984) Aumann, H. H., Beichman, C. A., Gillett, F. C., de Jong, T., Houck, J. R., Low, F. J., Neugebauer, G., Walker, R. G., & Wesselius, P. R. 1984, ApJ, 278, L23
- Backman & Paresce (1993) Backman, D. E. & Paresce, F. 1993, in Protostars and Planets III, ed. E. H. Levy & J. I. Lunine, 1253–1304
- Beichman et al. (2005) Beichman, C. A., Bryden, G., Gautier, T. N., Stapelfeldt, K. R., Werner, M. W., Misselt, K., Rieke, G., Stansberry, J., & Trilling, D. 2005, ApJ, 626, 1061
- Beichman et al. (2011) Beichman, C. A., Lisse, C. M., Tanner, A. M., Bryden, G., Akeson, R. L., Ciardi, D. R., Boden, A. F., Dodson-Robinson, S. E., Salyk, C., & Wyatt, M. C. 2011, ApJ, 743, 85
- Beichman et al. (2006) Beichman, C. A. et al. 2006, ApJ, 652, 1674
- Blain et al. (1999) Blain, A. W., Kneib, J.-P., Ivison, R. J., & Smail, I. 1999, ApJ, 512, L87
- Boley et al. (2012) Boley, A. C., Payne, M. J., Corder, S., Dent, W. R. F., Ford, E. B., & Shabram, M. 2012, ApJ, 750, L21
- Brott & Hauschildt (2005) Brott, I. & Hauschildt, P. H. 2005, in ESA Special Publication, Vol. 576, The Three-Dimensional Universe with Gaia, ed. C. Turon, K. S. O’Flaherty, & M. A. C. Perryman, 565
- Bryden et al. (2009) Bryden, G., Beichman, C. A., Carpenter, J. M., Rieke, G. H., Stapelfeldt, K. R., Werner, M. W., Tanner, A. M., Lawler, S. M., Wyatt, M. C., Trilling, D. E., Su, K. Y. L., Blaylock, M., & Stansberry, J. A. 2009, ApJ, 705, 1226
- Casagrande et al. (2011) Casagrande, L., Schönrich, R., Asplund, M., Cassisi, S., Ramírez, I., Meléndez, J., Bensby, T., & Feltzing, S. 2011, A&A, 530, A138
- Cavanagh et al. (2008) Cavanagh, B., Jenness, T., Economou, F., & Currie, M. J. 2008, Astronomische Nachrichten, 329, 295
- Chapin et al. (2013) Chapin, E. L., Berry, D. S., Gibb, A. G., Jenness, T., Scott, D., Tilanus, R. P. J., Economou, F., & Holland, W. S. 2013, MNRAS, 430, 2545
- Defrère et al. (2011) Defrère, D., Absil, O., Augereau, J.-C., di Folco, E., Berger, J.-P., Coudé Du Foresto, V., Kervella, P., Le Bouquin, J.-B., Lebreton, J., Millan-Gabet, R., Monnier, J. D., Olofsson, J., & Traub, W. 2011, A&A, 534, A5
- Duncan & Levison (1997) Duncan, M. J. & Levison, H. F. 1997, Science, 276, 1670
- Ertel et al. (2014) Ertel, S., Absil, O., Defrère, D., Le Bouquin, J.-B., Augereau, J.-C., Marion, L., Blind, N., Bonsor, A., Bryden, G., Lebreton, J., & Milli, J. 2014, A&A, 570, A128
- Ertel et al. (2012) Ertel, S., Wolf, S., & Rodmann, J. 2012, A&A, 544, A61
- Fernández et al. (2006) Fernández, R., Brandeker, A., & Wu, Y. 2006, ApJ, 643, 509
- Fitzgerald et al. (2007) Fitzgerald, M. P., Kalas, P. G., Duchêne, G., Pinte, C., & Graham, J. R. 2007, ApJ, 670, 536
- Gáspár et al. (2013) Gáspár, A., Rieke, G. H., & Balog, Z. 2013, ApJ, 768, 25
- Hansen & Murray (2012) Hansen, B. M. S. & Murray, N. 2012, ApJ, 751, 158
- Hauck & Mermilliod (1998) Hauck, B. & Mermilliod, M. 1998, A&AS, 129, 431
- Henyey & Greenstein (1941) Henyey, L. G. & Greenstein, J. L. 1941, ApJ, 93, 70
- Høg et al. (2000) Høg, E., Fabricius, C., Makarov, V. V., Urban, S., Corbin, T., Wycoff, G., Bastian, U., Schwekendiek, P., & Wicenec, A. 2000, A&A, 355, L27
- Holland et al. (2013) Holland, W. S., Bintley, D., Chapin, E. L., Chrysostomou, A., Davis, G. R., Dempsey, J. T., Duncan, W. D., Fich, M., Friberg, P., Halpern, M., Irwin, K. D., Jenness, T., Kelly, B. D., MacIntosh, M. J., Robson, E. I., Scott, D., Ade, P. A. R., Atad-Ettedgui, E., Berry, D. S., Craig, S. C., Gao, X., Gibb, A. G., Hilton, G. C., Hollister, M. I., Kycia, J. B., Lunney, D. W., McGregor, H., Montgomery, D., Parkes, W., Tilanus, R. P. J., Ullom, J. N., Walther, C. A., Walton, A. J., Woodcraft, A. L., Amiri, M., Atkinson, D., Burger, B., Chuter, T., Coulson, I. M., Doriese, W. B., Dunare, C., Economou, F., Niemack, M. D., Parsons, H. A. L., Reintsema, C. D., Sibthorpe, B., Smail, I., Sudiwala, R., & Thomas, H. S. 2013, MNRAS, 430, 2513
- Holmberg et al. (2009) Holmberg, J., Nordström, B., & Andersen, J. 2009, A&A, 501, 941
- Inamdar & Schlichting (2014) Inamdar, N. K. & Schlichting, H. E. 2014, ArXiv e-prints
- Ishihara et al. (2010) Ishihara, D. et al. 2010, A&A, 514, A1
- Izidoro et al. (2014) Izidoro, A., Morbidelli, A., & Raymond, S. N. 2014, ApJ, 794, 11
- Janson et al. (2013) Janson, M., Brandt, T. D., Moro-Martín, A., Usuda, T., Thalmann, C., Carson, J. C., Goto, M., Currie, T., McElwain, M. W., Itoh, Y., Fukagawa, M., Crepp, J., Kuzuhara, M., Hashimoto, J., Kudo, T., Kusakabe, N., Abe, L., Brandner, W., Egner, S., Feldt, M., Grady, C. A., Guyon, O., Hayano, Y., Hayashi, M., Hayashi, S., Henning, T., Hodapp, K. W., Ishii, M., Iye, M., Kandori, R., Knapp, G. R., Kwon, J., Matsuo, T., Miyama, S., Morino, J.-I., Nishimura, T., Pyo, T.-S., Serabyn, E., Suenaga, T., Suto, H., Suzuki, R., Takahashi, Y., Takami, M., Takato, N., Terada, H., Tomono, D., Turner, E. L., Watanabe, M., Wisniewski, J., Yamada, T., Takami, H., & Tamura, M. 2013, ApJ, 773, 73
- Kains et al. (2011) Kains, N., Wyatt, M. C., & Greaves, J. S. 2011, MNRAS, 414, 2486
- Kalas et al. (2005) Kalas, P., Graham, J. R., & Clampin, M. 2005, Nature, 435, 1067
- Kennedy & Kenyon (2008) Kennedy, G. M. & Kenyon, S. J. 2008, ApJ, 682, 1264
- Kennedy & Wyatt (2010) Kennedy, G. M. & Wyatt, M. C. 2010, MNRAS, 405, 1253
- Kennedy & Wyatt (2012) —. 2012, MNRAS, 426, 91
- Kennedy et al. (2013) Kennedy, G. M., Wyatt, M. C., Bryden, G., Wittenmyer, R., & Sibthorpe, B. 2013, MNRAS, 436, 898
- Kóspál et al. (2009) Kóspál, Á., Ardila, D. R., Moór, A., & Ábrahám, P. 2009, ApJ, 700, L73
- Krist et al. (2012) Krist, J. E., Stapelfeldt, K. R., Bryden, G., & Plavchan, P. 2012, AJ, 144, 45
- Krist et al. (2010) Krist, J. E., Stapelfeldt, K. R., Bryden, G., Rieke, G. H., Su, K. Y. L., Chen, C. C., Beichman, C. A., Hines, D. C., Rebull, L. M., Tanner, A., Trilling, D. E., Clampin, M., & Gáspár, A. 2010, AJ, 140, 1051
- Lawler et al. (2009) Lawler, S. M., Beichman, C. A., Bryden, G., Ciardi, D. R., Tanner, A. M., Su, K. Y. L., Stapelfeldt, K. R., Lisse, C. M., & Harker, D. E. 2009, ApJ, 705, 89
- Le Bouquin et al. (2011) Le Bouquin, J.-B., Berger, J.-P., Lazareff, B., Zins, G., Haguenauer, P., Jocou, L., Kern, P., Millan-Gabet, R., Traub, W., Absil, O., Augereau, J.-C., Benisty, M., Blind, N., Bonfils, X., Bourget, P., Delboulbe, A., Feautrier, P., Germain, M., Gitton, P., Gillier, D., Kiekebusch, M., Kluska, J., Knudstrup, J., Labeye, P., Lizon, J.-L., Monin, J.-L., Magnard, Y., Malbet, F., Maurel, D., Ménard, F., Micallef, M., Michaud, L., Montagnier, G., Morel, S., Moulin, T., Perraut, K., Popovic, D., Rabou, P., Rochat, S., Rojas, C., Roussel, F., Roux, A., Stadler, E., Stefl, S., Tatulli, E., & Ventura, N. 2011, A&A, 535, A67
- Lebouteiller et al. (2011) Lebouteiller, V., Barry, D. J., Spoon, H. W. W., Bernard-Salas, J., Sloan, G. C., Houck, J. R., & Weedman, D. W. 2011, ApJS, 196, 8
- Lebreton et al. (2013) Lebreton, J., van Lieshout, R., Augereau, J.-C., Absil, O., Mennesson, B., Kama, M., Dominik, C., Bonsor, A., Vandeportal, J., Beust, H., Defrère, D., Ertel, S., Faramaz, V., Hinz, P., Kral, Q., Lagrange, A.-M., Liu, W., & Thébault, P. 2013, A&A, 555, A146
- Lisse et al. (2007) Lisse, C. M., Beichman, C. A., Bryden, G., & Wyatt, M. C. 2007, ApJ, 658, 584
- Marion et al. (2014) Marion, L., Absil, O., Ertel, S., Le Bouquin, J.-B., Augereau, J.-C., Blind, N., Defrère, D., Lebreton, J., & Milli, J. 2014, A&A, 570, A127
- Marshall et al. (2014) Marshall, J. P., Moro-Martín, A., Eiroa, C., Kennedy, G., Mora, A., Sibthorpe, B., Lestrade, J.-F., Maldonado, J., Sanz-Forcada, J., Wyatt, M. C., Matthews, B., Horner, J., Montesinos, B., Bryden, G., del Burgo, C., Greaves, J. S., Ivison, R. J., Meeus, G., Olofsson, G., Pilbratt, G. L., & White, G. J. 2014, A&A, 565, A15
- Matrà et al. (2015) Matrà, L., Panić, O., Wyatt, M. C., & Dent, W. R. F. 2015, MNRAS, 447, 3936
- Mayor et al. (2011) Mayor, M., Marmier, M., Lovis, C., Udry, S., Ségransan, D., Pepe, F., Benz, W., Bertaux, J. ., Bouchy, F., Dumusque, X., Lo Curto, G., Mordasini, C., Queloz, D., & Santos, N. C. 2011, ArXiv e-prints
- Mayor et al. (2003) Mayor, M., Pepe, F., Queloz, D., Bouchy, F., Rupprecht, G., Lo Curto, G., Avila, G., Benz, W., Bertaux, J.-L., Bonfils, X., Dall, T., Dekker, H., Delabre, B., Eckert, W., Fleury, M., Gilliotte, A., Gojak, D., Guzman, J. C., Kohler, D., Lizon, J.-L., Longinotti, A., Lovis, C., Megevand, D., Pasquini, L., Reyes, J., Sivan, J.-P., Sosnowska, D., Soto, R., Udry, S., van Kesteren, A., Weber, L., & Weilenmann, U. 2003, The Messenger, 114, 20
- Mermilliod (2006) Mermilliod, J. C. 2006, VizieR Online Data Catalog, 2168, 0
- Min et al. (2010) Min, M., Kama, M., Dominik, C., & Waters, L. B. F. M. 2010, A&A, 509, L6
- Moór et al. (2011) Moór, A., Ábrahám, P., Juhász, A., Kiss, C., Pascucci, I., Kóspál, Á., Apai, D., Henning, T., Csengeri, T., & Grady, C. 2011, ApJ, 740, L7
- Morales et al. (2012) Morales, F. Y., Padgett, D. L., Bryden, G., Werner, M. W., & Furlan, E. 2012, ApJ, 757, 7
- Mulders et al. (2013) Mulders, G. D., Min, M., Dominik, C., Debes, J. H., & Schneider, G. 2013, A&A, 549, A112
- Mumma & Charnley (2011) Mumma, M. J. & Charnley, S. B. 2011, ARA&A, 49, 471
- Mustill & Wyatt (2009) Mustill, A. J. & Wyatt, M. C. 2009, MNRAS, 399, 1403
- Mustill & Wyatt (2012) —. 2012, MNRAS, 419, 3074
- Neugebauer et al. (1984) Neugebauer, G., Habing, H. J., van Duinen, R., Aumann, H. H., Baud, B., Beichman, C. A., Beintema, D. A., Boggess, N., Clegg, P. E., de Jong, T., Emerson, J. P., Gautier, T. N., Gillett, F. C., Harris, S., Hauser, M. G., Houck, J. R., Jennings, R. E., Low, F. J., Marsden, P. L., Miley, G., Olnon, F. M., Pottasch, S. R., Raimond, E., Rowan-Robinson, M., Soifer, B. T., Walker, R. G., Wesselius, P. R., & Young, E. 1984, ApJ, 278, L1
- Nidever et al. (2002) Nidever, D. L., Marcy, G. W., Butler, R. P., Fischer, D. A., & Vogt, S. S. 2002, ApJS, 141, 503
- Panić et al. (2013) Panić, O., Holland, W. S., Wyatt, M. C., Kennedy, G. M., Matthews, B. C., Lestrade, J. F., Sibthorpe, B., Greaves, J. S., Marshall, J. P., Phillips, N. M., & Tottle, J. 2013, MNRAS, 435, 1037
- Payne et al. (2009) Payne, M. J., Ford, E. B., Wyatt, M. C., & Booth, M. 2009, MNRAS, 393, 1219
- Pepe et al. (2011) Pepe, F., Lovis, C., Ségransan, D., Benz, W., Bouchy, F., Dumusque, X., Mayor, M., Queloz, D., Santos, N. C., & Udry, S. 2011, A&A, 534, A58
- Phillips et al. (2010) Phillips, N. M., Greaves, J. S., Dent, W. R. F., Matthews, B. C., Holland, W. S., Wyatt, M. C., & Sibthorpe, B. 2010, MNRAS, 403, 1089
- Pilbratt et al. (2010) Pilbratt, G. L. et al. 2010, A&A, 518, L1
- Poglitsch et al. (2010) Poglitsch, A. et al. 2010, A&A, 518, L2
- Quillen (2006) Quillen, A. C. 2006, MNRAS, 372, L14
- Raymond & Cossou (2014) Raymond, S. N. & Cossou, C. 2014, MNRAS, 440, L11
- Roberge et al. (2000) Roberge, A., Feldman, P. D., Lagrange, A. M., Vidal-Madjar, A., Ferlet, R., Jolly, A., Lemaire, J. L., & Rostas, F. 2000, ApJ, 538, 904
- Smith & Terrile (1984) Smith, B. A. & Terrile, R. J. 1984, Science, 226, 1421
- Smith et al. (2009) Smith, R., Wyatt, M. C., & Haniff, C. A. 2009, A&A, 503, 265
- Sousa et al. (2010) Sousa, S. G., Fernandes, J., Israelian, G., & Santos, N. C. 2010, A&A, 512, L5
- Strubbe & Chiang (2006) Strubbe, L. E. & Chiang, E. I. 2006, ApJ, 648, 652
- Su et al. (2013) Su, K. Y. L. et al. 2013, ApJ, 763, 118
- Takeda et al. (2007) Takeda, G., Ford, E. B., Sills, A., Rasio, F. A., Fischer, D. A., & Valenti, J. A. 2007, ApJS, 168, 297
- Trilling et al. (2008) Trilling, D. E., Bryden, G., Beichman, C. A., Rieke, G. H., Su, K. Y. L., Stansberry, J. A., Blaylock, M., Stapelfeldt, K. R., Beeman, J. W., & Haller, E. E. 2008, ApJ, 674, 1086
- van Leeuwen (2007) van Leeuwen, F. 2007, A&A, 474, 653
- Vican (2012) Vican, L. 2012, AJ, 143, 135
- Vitense et al. (2012) Vitense, C., Krivov, A. V., Kobayashi, H., & Löhne, T. 2012, A&A, 540, A30
- Weidenschilling (1977) Weidenschilling, S. J. 1977, Ap&SS, 51, 153
- Werner et al. (2004) Werner, M. W. et al. 2004, ApJS, 154, 1
- Wilson et al. (2005) Wilson, B. A., Dame, T. M., Masheder, M. R. W., & Thaddeus, P. 2005, A&A, 430, 523
- Wright et al. (2010) Wright, E. L. et al. 2010, AJ, 140, 1868
- Wyatt (2003) Wyatt, M. C. 2003, ApJ, 598, 1321
- Wyatt (2008) —. 2008, ARA&A, 46, 339
- Wyatt et al. (2007a) Wyatt, M. C., Smith, R., Greaves, J. S., Beichman, C. A., Bryden, G., & Lisse, C. M. 2007a, ApJ, 658, 569
- Wyatt et al. (2007b) Wyatt, M. C., Smith, R., Su, K. Y. L., Rieke, G. H., Greaves, J. S., Beichman, C. A., & Bryden, G. 2007b, ApJ, 663, 365
- Wyatt et al. (2012) Wyatt, M. C. et al. 2012, MNRAS, 424, 1206
- Zhou et al. (2005) Zhou, J.-L., Aarseth, S. J., Lin, D. N. C., & Nagasawa, M. 2005, ApJ, 631, L85
- Zuckerman et al. (1995) Zuckerman, B., Forveille, T., & Kastner, J. H. 1995, Nature, 373, 494
- Zuckerman & Song (2012) Zuckerman, B. & Song, I. 2012, ApJ, 758, 77