Cosmogenic-neutron activation of TeO2 and implications for
neutrinoless double-beta decay experiments
Abstract
Flux-averaged cross sections for cosmogenic-neutron activation of natural tellurium were measured using a neutron beam containing neutrons of kinetic energies up to 800 MeV, and having an energy spectrum similar to that of cosmic-ray neutrons at sea-level. Analysis of the radioisotopes produced reveals that 110mAg will be a dominant contributor to the cosmogenic-activation background in experiments searching for neutrinoless double-beta decay of 130Te, such as CUORE and SNO. An estimate of the cosmogenic-activation background in the CUORE experiment has been obtained using the results of this measurement and cross-section measurements of proton activation of tellurium. Additionally, the measured cross sections in this work are also compared with results from semi-empirical cross-section calculations.
pacs:
I Introduction
Neutrinoless double-beta () decay Avignone III et al. (2008); Rodejohann (2011); Bilenky and Giunti (2012) is a long sought-after second-order weak process in which a nucleus (A,Z) transitions to a nucleus (A,Z+2) through the emission of two electrons. This process is hypothesized to occur only if neutrinos are Majorana particles. Observation of decay would not only establish that neutrinos are Majorana fermions, but may also constrain the neutrino-mass scale and hierarchy, and demonstrate that total lepton number is not conserved.
In experiments searching for decay, the signature of interest is a peak at the double-beta decay Q value (Q). As decay would be a rare process, minimizing the background rate around Q is essential for improving the experimental sensitivity. Therefore, a detailed characterization of all potential sources of background is important, as any event that can mimic or obscure the -decay peak is problematic and must be well-understood and, if possible, eliminated.
To miminize external backgrounds, -decay experiments operate in underground laboratories, where large overburdens decrease the flux of cosmic rays by orders of magnitude relative to the flux above ground Aglietta et al. (1998). Further reduction of the remaining cosmic-ray background can be achieved with muon-veto detectors, and backgrounds from natural radioactivity in the laboratory environment can be alleviated with proper shielding.
Radioactivity present within the detector itself can provide a source of background that is difficult to eliminate. -decay experiments devote a great deal of effort into making ultraclean and ultrapure detector materials free of primordial radioisotopes. However, no matter how clean or purely produced the materials are, cosmogenic activation will generate some radioactivity while the materials are at or above the Earth’s surface during storage, production, or transportation Cebrián et al. (2006); Elliott et al. (2010); Lozza and Petzoldt (2014). The background contribution from this radioactivity can be minimized by ensuring detector materials spend as little time above ground as possible and by avoiding air transportation, as the cosmic-ray flux increases significantly at higher altitudes Hess et al. (1959); Goldhagen et al. (2004). At sea-level, activation is primarily caused by the hadronic component of the cosmic-ray flux, which is dominated by neutrons Heusser (1995).
This work investigates the backgrounds associated with cosmogenic activation of tellurium, which are important to understand for experiments such as the Cryogenic Underground Observatory for Rare Events (CUORE) Arnaboldi et al. (2004) and the Sudbury Neutrino Observatory Plus (SNO) Hartnell (2012) that are searching for the decay of 130Te, but to date are poorly characterized due to a lack of data. As -decay experiments run for several years, typically only long-lived cosmogenic isotopes (i.e., that have half-lives of order a year or longer) with Q values near or greater than the 130Te Q of 2528 keV Redshaw et al. (2009); Scielzo et al. (2009); Rahaman et al. (2011); Nesterenko et al. (2012) will be potential sources of background at the -decay peak.
Determining the resulting cosmogenic-activation background contribution to a -decay experiment requires estimating the production rates of the radioisotopes in tellurium. Activation cross sections that span a wide range of neutron energies, from thermal up to several GeV, are therefore needed; however, experimentally-measured cross-section data is currently sparse. For neutron energies above 800 MeV, cross sections for neutron activation are expected to be approximately equal to those for proton activation, and can be estimated from existing experimental data for proton energies 800 MeV – 23 GeV Bardayan et al. (1997); Norman et al. (2005); Barghouty et al. (2013). In these proton measurements, two long-lived radioisotopes were observed that have the potential to contribute background at the -decay peak: 110mAg and 60Co. Below 800 MeV, experimental data exists for activation of natural tellurium by 1–180 MeV neutrons Hansmann (2010) and activation of individual tellurium isotopes by thermal to 15 MeV neutrons Otuka et al. (2014); however, only a few reactions were measured, and no cross sections were reported for the production of 60Co and 110mAg. To deal with the lack of experimental data, the background from cosmogenic activation has been estimated in the past (as in Ref. Lozza and Petzoldt (2014)) using a combination of the aforementioned neutron and proton measurements and codes that either implement the semi-empirical formulae by Silberberg and Tsao (S&T) Silberberg and Tsao (1973a, b); Silberberg et al. (1998) (e.g., YIELDX Silberberg and Tsao (1973a, b); Silberberg et al. (1998), ACTIVIA Back and Ramachers (2008)), or are based on Monte Carlo (MC) methods (e.g., CEM03 Mashnik et al. (2006), HMS-ALICE Blann (1996), GEANT4 Agostinelli et al. (2003); Allison et al. (2006)).
These estimates can be greatly improved with additional neutron-activation cross-section measurements below 800 MeV, which can also be used to benchmark the S&T and MC codes. A sample of natural-TeO2 powder was irradiated at the Los Alamos Neutron Science Center (LANSCE) with a neutron beam containing neutrons with kinetic energies up to 800 MeV, and having an energy distribution that resembles the cosmic-ray neutron flux at sea-level. Following exposure, the rays emitted from the sample were measured in a low-background environment with a high-purity-germanium (HPGe) detector to determine the radioisotopes present. Based on these results, flux-averaged cross sections were obtained for several dozen isotopes.
The cross sections are used to investigate the impact cosmogenic activation will have on CUORE, a next-generation -decay experiment that will use an array of 988 high-resolution, low-background natural-TeO2 bolometers to search for the decay of 130Te. In addition, the measured cross sections are compared with cross sections calculated using the ACTIVIA code. Details of this measurement and subsequent analysis are discussed below.
II Experimental method and data analysis
II.1 Target
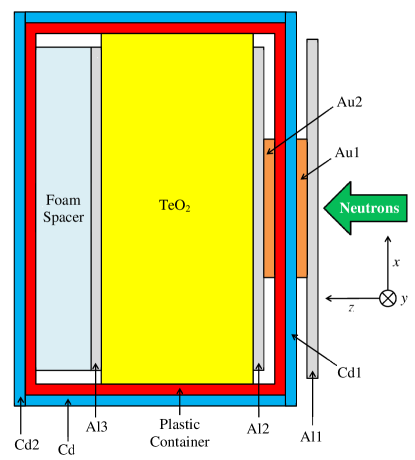
The target consisted of 272 g of natural-TeO2 powder held within a cylindrical plastic container wrapped on all sides with 0.05 cm of cadmium to remove thermal neutrons. The front and back cadmium-layers were also used to monitor the neutron flux on either side of the target. Circular aluminum and gold foils were placed throughout the target to monitor the neutron flux as well. The target geometry is illustrated in Figure 1, and the details of each target component are listed in Table 1.
| Component | Material | Mass | Purpose | ||
|---|---|---|---|---|---|
| (cm) | (cm) | (g) | |||
| TeO2 | TeO2 powder | 2.79 | 6.43 | 271.56 | Target |
| Al1 | Al | 0.0813 | 6.22 | 6.68 | Neutron-flux monitor |
| Al2 | Al | 0.0813 | 5.93 | 6.06 | Neutron-flux monitor |
| Al3 | Al | 0.0813 | 5.93 | 6.06 | Neutron-flux monitor |
| Au1 | Au | 0.00515 | 2.54 | 0.504 | Neutron-flux monitor |
| Au2 | Au | 0.00512 | 2.54 | 0.500 | Neutron-flux monitor |
| Cd1 | Cd | 0.05 | 6.7 | 16.3 | Neutron-flux monitor |
| Thermal-neutron absorber | |||||
| Cd2 | Cd | 0.05 | 7.3 | 19.9 | Neutron-flux monitor |
| Thermal-neutron absorber | |||||
| Cd | Cd | 0.05 | — | — | Thermal-neutron absorber |
| Plastic Container | Polystyrene | 0.2 | — | — | Target holder |
II.2 Neutron irradiation
The target was irradiated with neutrons from the LANSCE 30R beam line for 43 hours during February 25–27, 2012. At LANSCE, neutrons are generated from spallation reactions induced by an 800 MeV pulsed proton beam incident on a tungsten target. The 30R beam line, which is 30∘ to the right of the proton beam, has a neutron-energy spectrum that closely resembles the cosmic-ray neutron spectrum at sea-level, but has an intensity times larger, as shown in Figure 2. A beam collimation width of 8.26 cm was used, which resulted in a beam-spot diameter of 8.41 cm at the target.

The proton beam used to generate the neutrons consisted of 625-s-long macropulses occuring at a rate of 40 Hz. Each macropulse contained micropulses spaced 1.8 s apart. The neutron time-of-flight was obtained by measuring the time between the arrival of the proton macropulse at the tungsten target and the generation of a fission signal in a 238U-fission ionization chamber Wender et al. (1993) located 25.4 cm upstream of the TeO2 target. The ionization chamber was only able to detect neutrons with energies above the 238U-fission threshold, which is approximately 1.25 MeV. The average neutron flux above 1.25 MeV at the TeO2 target was determined to be neutrons/(cm2s), with an estimated uncertainty of 10% Wang (2014) based on uncertainties in the geometry and efficiency of the ionization chamber.
II.3 Gamma-ray analysis of the irradiated target
Approximately one week after the neutron irradiation, the TeO2 target was dismantled, and each component was analyzed using -ray spectroscopy at the Lawrence Berkeley National Laboratory Low Background Facility Thomas et al. (2013); BLB . The TeO2 powder, cadmium foils, and aluminum foils were measured using an upright, -relative-efficiency, n-type HPGe detector, and the gold foils were measured with a horizontal, -relative-efficiency, p-type HPGe detector. Each detector was surrounded by a copper inner shield encased in a lead outer shield. The gold foils were highly activated and could be counted at a distance of 12 cm from the detector. The cadmium and aluminum foils had low levels of activity and were therefore measured directly on top of the detector to maximize the detection efficiency. For the TeO2 powder, the -ray measurements needed to be highly sensitive to long-lived radioisotopes, which had low levels of activity inside the powder. To maximize the detection efficiency, the TeO2 powder was mixed thoroughly and counted in a Marinelli beaker positioned over the top of the detector (Figure 3). A plastic insert was placed inside the beaker to decrease the thickness and increase the height of the powder, which in turn increased the solid angle of the detector seen by the powder and decreased the self-attenuation of rays from decays within the powder. The thickness and average height of the TeO2 powder were 3.8 mm and 5.6 cm, respectively. The TeO2 was counted in this configuration periodically for six months to enable the observation of long-lived activation products after the short-lived ones decayed away. Figure 4 shows a -ray spectrum for the TeO2 powder collected four months after the irradiation.


Each peak in the -ray spectra was fit with a Gaussian summed with a quadratic background function to determine the energy and net counts. For peaks with higher intensity, a smoothed step function was also added to the fitting function. The -ray energies were used to identify the radioisotopes produced in the TeO2 powder. For -ray lines that could come from the decay of more than one isotope, the contributors were identified from the decay half-life of the line.
A list of the radioisotopes observed in the TeO2 powder is provided in Table 2. Since -ray measurements started one week after the neutron irradiation ended, only activated isotopes with half-lives greater than 1 day remained. Therefore, any observed isotope with a shorter half-life was a decay daughter of a longer-lived isotope. For example, the presence of 127Te (9.35-hour half-life) and 129Te (69.6-minute half-life) was due to the decays of the longer-lived metastable states 127mTe and 129mTe, respectively.
| Isotope | Half-life | ( C.L.) | S&T | Decay Q value |
|---|---|---|---|---|
| (mb) | (mb) | (MeV) | ||
| 126I111This isotope was produced by interactions with spallation protons created in the target during the neutron irradiation. Therefore, no cross sections are provided. | 12.93 d | |||
| 131I1 | 8.025 d | |||
| 118Te | 6.00 d | 9.80 | ||
| 119mTe | 4.7 d | 13.0 | 2.554 () | |
| 121Te222This isotope had a high probability of being produced by interactions with -MeV neutrons. Therefore, no cross sections are given. | 19.17 d | |||
| 121mTe | 164.2 d | 25.2 | ||
| 123mTe | 119.2 d | 8.6 | ||
| 125mTe | 57.4 d | 17.0 | ||
| 127Te | 9.35 h | |||
| 127mTe | 106.1 d | 25.3 | ||
| 129Te | 69.6 m | |||
| 129mTe | 33.6 d | (cu) | 22.4 (cu) | |
| 131Te | 25 m | |||
| 131mTe2 | 33.25 h | |||
| 131mXe1 | 11.84 d | |||
| 118Sb | 3.6 m | 3.657 () | ||
| 119Sb333A flux-averaged cross section could not be obtained for 119Sb because the strongest -ray line at 24 keV overlapped with x-rays emitted by other activated isotopes. | 38.19 h | |||
| 120mSb | 5.76 d | 10.2 | () | |
| 122Sb | 2.7238 d | (cu) | 15.4 (cu) | |
| 124Sb | 60.2 d | (cu) | 19.1 (cu) | 2.904 () |
| 125Sb | 2.759 y | (cu) | 18.8 (cu) | |
| 126Sb | 12.35 d | (cu) | 26.4 (cu) | 3.673 () |
| 127Sb | 3.85 d | (cu) | 9.8 (cu) | |
| 113Sn | 115.1 d | (cu) | 3.0 (cu) | |
| 117mSn | 14 d | 0.63 | ||
| 111In | 2.805 d | (cu) | 2.1 (cu) | |
| 114mIn | 49.51 d | 0.31 | ||
| 105Ag | 41.29 d | (cu) | 0.45 (cu) | |
| 106mAg | 8.28 d | 0.39 | 3.055 () | |
| 110Ag | 24.56 s | 2.893 () | ||
| 110mAg | 249.83 d | 0.054 | 3.010 () | |
| 111Ag | 7.45 d | (cu) | 0.030 (cu) | |
| 101Rh | 3.3 y | (cu) | 0.24 (cu) | |
| 101mRh | 4.34 d | (cu) | 0.24 (cu) | |
| 102mRh | 3.742 y | 0.12 | ||
| 60Co44460Co was not conclusively observed in the -ray spectra due to 102mRh and 110mAg peaks being present where the 60Co peaks were expected. Therefore the cross section quoted for 60Co is an upper limit. | 5.27 y | (cu) | 0.0013 (cu) | 2.823 () |
| 7Be5557Be was produced almost exclusively by neutron interactions with oxygen. The cross sections given correspond to these interactions. | 53.24 d | 2.5 |
II.4 Photopeak efficiencies
The -ray measurements of the TeO2 powder needed to be highly sensitive to long-lived radioisotopes, which had low levels of activity inside the powder. To maximize the detection efficiency, the powder was counted immediately next to the detector (Figure 3). Determination of the photopeak efficiencies for the TeO2 powder from calibration measurements alone was impractical due to the complexity of the counting geometry and the effects of true-coincidence summing, which can be significant at such close range. Therefore, the efficiencies were obtained by running simulations with the Geometry and Tracking 4 (GEANT4) code, version 4.9.4.p02, which were benchmarked against experimental measurements of various point and extended -ray sources (Table 3) that covered a wide range of -ray energies.
For the benchmarking measurements, the 57Co and 54Mn point sources were each counted at the center of the detector face and at four positions along the side of the detector that were spaced 2 cm apart and spanned the length of the HPGe crystal. The uranium source was counted on the side of the detector as well. Following the natural-source method Perillo Isaac et al. (1997), the two extended sources, ES1 and ES2, were constructed from powders that contained elements with naturally-occurring long-lived radioisotopes. ES1 was designed to mimic the geometry of the irradiated TeO2 powder during the -ray measurements, and ES2 was designed to mimic both the geometry and density of the powder. Photopeak efficiencies were obtained for all the rays listed in Table 3. In addition, the total efficiency, which is needed to determine summing corrections, was obtained for the two 57Co rays (122.06 keV and 136.47 keV) and the 54Mn ray (834.85-keV).
| Source | Composition | Dimensions | -ray | Branching Ratio |
| (keV) | (%) | |||
| Co-57 | Co-57 | Point source | 122.06 | |
| 136.47 | ||||
| Mn-54 | Mn-54 | Point source | 834.85 | |
| Uranium666All isotopes in the source were assumed to be in secular equilibrium. | Natural uranium ore (0.1176 g) | Diameter = 4.76 cm | 185.72 (235U) | |
| mixed with epoxy | Thickness = 3.175 mm | 46.54 (210Pb) | ||
| 186.21 (226Ra) | ||||
| 242.00 (214Pb) | ||||
| 295.22 (214Pb) | ||||
| 1764.49 (214Bi) | ||||
| 2204.06 (214Bi) | ||||
| ES1777Due to a small 227Ac contamination in the La2O3, ES1 and ES2 also contained 227Ac and its daughter isotopes, which were assumed to be in secular equilibrium with each other. -rays from the 227Ac chain are also listed in the table. | La2O3 powder (89 g), | Inner radius = 5.06 cm | 201.83 (176Lu) | |
| Lu2O3 powder (2 g), | Outer radius = 5.443 cm | 306.78 (176Lu) | ||
| KCl powder (4 g) | Average height = 5.75 cm | 788.74 (138La) | ||
| 1435.80 (138La) | ||||
| 1460.82 (40K) | ||||
| 269.46 (223Ra) | ||||
| 271.23 (219Rn) | ||||
| 832.01 (211Pb) | ||||
| 351.07 (211Bi) | ||||
| ES27 | (Unirradiated) TeO2 powder (228 g), | Inner radius = 5.06 cm | Note: All rays used | |
| La2O3 powder (23 g), | Outer radius = 5.443 cm | to analyze ES1 were also | ||
| Lu2O3 powder (6 g), | Average height = 6.5 cm | used to analyze ES2. | ||
| K2SO4 powder (14 g) |
The benchmarking measurements were simulated using GEANT4. Each simulation included the HPGe detector, the -ray source, and the lead and copper shielding. For each ray of interest, the entire decay scheme of the parent nucleus was simulated. Angular correlations between coincident rays were not taken into account; however at close distances to the detector, the effects on the photopeak efficiencies are largely averaged out and are thus small.
Each simulated photopeak or total efficiency () was compared with the measured value (), and the percent difference was determined:
| (1) |
Using the manufacturer’s detector specifications in the simulations resulted in values that ranged from approximately -10% to -35%, with the agreement between simulation and measurement worsening at lower -ray energies. This kind of disagreement, especially overestimation by the simulation, has been seen in other studies that model the -ray efficiencies of HPGe detectors using the geometry provided by the manufacturer (e.g., Refs. Boson et al. (2008); Huy et al. (2007); Helmer et al. (2003); Wang et al. (2002)). Typically, the discrepancies have been attributed to physical characteristics of the detector (crystal location, Li-diffused-contact thickness, etc.) that are difficult for the manufacturer to precisely specify. When the source is counted close to the detector, small uncertainties in the detector’s parameters can have significant effects on the -ray efficiencies.
The adjustments listed in Table 4 were applied to the detector geometry in GEANT4 to make the efficiencies from the simulations more closely match those from the benchmarking measurements. The larger disagreement at low energies between the simulated and measured efficiencies pointed to additional, unspecified attenuating material that was present in the actual detector. To address this, the thickness of the aluminum mounting cup that immediately surrounds the HPGe crystal was increased by 2.25 mm to achieve closer agreement between the simulations and measurements.
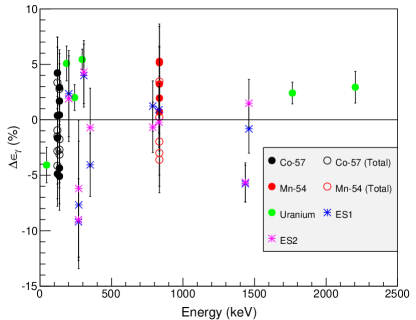
Figure 5 shows the values of obtained after the adjustments to the detector geometry were made in the GEANT4 simulations. The uncertainties in take into account the statistical uncertainties in the measurements and the simulations, as well as the uncertainties in the source activities and branching ratios of the rays. The total uncertainty in the simulated efficiencies was estimated to be , which is slighly larger than the standard deviation of .
The photopeak efficiencies of the rays used to identify the isotopes in Table 2 were obtained for the irradiated TeO2 powder by performing GEANT4 simulations using the adjusted detector values in Table 4. Simulations indicate that summing could have as much as a 40% effect for certain photopeak efficiencies. Figure 5 gives confidence that the GEANT4 simulations could model summing correctly and provide photopeak efficiencies for the irradiated TeO2 powder with around 5% uncertainty.
| Parameter | Nominal Value | Adjusted Value |
|---|---|---|
| (mm) | (mm) | |
| Length of HPGe crystal | 85.5 | 80.5888The effects of shortening the crystal in the simulation could also be reproduced by using the nominal length of the crystal and adding a 1.85-mm-thick, 3.5-cm-long copper ring around the aluminum mounting-cup, 8 cm below the top of the detector endcap. Since the presence of such a ring was not specified by the manufacturer and the corresponding simulations provided equivalent results to the shortened crystal geometry, the simulated efficiencies for the 80.5-mm-long crystal were used in the cross-section analysis. |
| Distance between HPGe crystal and detector window | 0 | 2 |
| Thickness of aluminum mounting-cup | 0.5 | 2.75 |
| Thickness of internal dead layer (lithium contact) | 1 | 2 |
II.5 Neutron transmission during neutron irradiation
Following the neutron irradiation, the aluminum and cadmium foils located in front of and behind the TeO2 powder were measured with an HPGe detector, as was described in Section II.3. The total neutron transmission, , through the TeO2 powder was estimated by comparing the activities of the activation products in the front foils (Al1 and Cd1) with the activities in the back foils (Al3 and Cd2). The values of obtained by analyzing the activation products are given in Table 5, and the uncertainties quoted are statistical. To account for the variation in the results, was taken to be , which spans the range of values given in Table 5 along with their uncertainties. The average neutron transmission, , through the TeO2 powder was then estimated to be
| (2) |
| Reaction | |
|---|---|
| 27Al(n,X)22Na | |
| Cd(n,X)105Ag | |
| Cd(n,X)110mAg |
II.6 Isotope-production rates
The production rate for each isotope can be determined using data from the -ray spectra collected for the irradiated TeO2 powder. In most cases, the isotope produced in the powder is not fed by other isotopes during or after the neutron irradiation. Under this condition, the production rate, , can be obtained using:
| (3) |
where is the decay constant of the isotope, is the number of counts in the -ray peak of interest corrected for the growth and decay of the isotope during the irradiation and the decay of the isotope after the irradiation, is the branching ratio of the ray, and is the photopeak efficiency of detecting the ray. The production rates for 125mTe and 127mTe were described by more complex growth-and-decay relations and were obtained using the appropriate modifications to Equation 3.
II.7 Flux-averaged cross sections
The flux-averaged cross section, , for neutron activating an isotope in the irradiated TeO2 powder is determined from
| (4) |
where is the cross section for producing the isotope with neutrons of kinetic energy , is the differential neutron flux hitting the front of the target in units of [neutrons/(cm2sMeV)], and and are respectively the lowest and highest neutron energies hitting the TeO2 powder.
The isotope-production rate can also be expressed as
| (5) |
where is the number of tellurium nuclei in the powder (except for the production of 7Be, where is the number of oxygen nuclei in the powder).
The total neutron flux below 1.25 MeV during the irradiation was determined to be nonnegligible from the amount of 198Au created by (n,) reactions in the gold foils. Therefore, cross sections could be obtained only for isotopes produced soley (or primarily) by interactions with neutrons of energy MeV, and in these cases, and from Equation 5 could be set to 1.25 MeV and 800 MeV, respectively.
III Comparing measured and calculated cross sections
Isotope-production cross sections for tellurium were also obtained by using the ACTIVIA code to perform calculations based on the S&T semi-empirical formulae. These formulae were originally developed to describe proton-nucleus interactions, but they are assumed to be applicable to neutron-nucleus interactions as well. The calculated cross sections are reported in Table 2. Although the formulae are only valid for proton and neutron energies MeV and they do not distinguish between ground and metastable states in product nuclei, the calculated and measured cross sections agree reasonably well, within a factor of 3 on average. One should note that the cross section calculated for 110mAg was underestimated by approximately a factor of 5.
IV Cosmogenic-activation background in the CUORE experiment
The CUORE experiment will use an array of 988 high-resolution, low-background TeO2 bolometers to search for the decay of 130Te. Each bolometer is comprised of a 555 cm3 natural-TeO2 crystal that serves as both a source and a detector of the decay. CUORE is aiming for a background rate of counts/(keVkg y) at the 130Te Q value of 2528 keV, which would allow the experiment to reach a half-life sensitivity of years ( C.L.), assuming a live time of 5 years and a full-width-at-half-maximum energy resolution of 5 keV Alessandria et al. (2011).
Using the results of the neutron-activation measurement discussed in this work and the proton-activation measurements of Ref. Barghouty et al. (2013), one can determine the background contribution to CUORE from the cosmogenic activation of the TeO2 crystals that occurs during sea transportation from the crystal-production site in Shanghai, China to LNGS in Italy. The results of both this work and Ref. Barghouty et al. (2013) indicate that 110mAg and 60Co are the only two long-lived radioisotopes that will contribute meaningfully to the background at the -decay peak due to their Q values being greater than Q. 110Ag will also contribute a small amount to the background because 110mAg decays to it 1.33% of the time.
The production rates, , of 110mAg and 60Co were each estimated to be
| (6) |
where is the isotope-production cross section assigned to energy bin , and is the differential cosmic-ray neutron flux at sea-level integrated over energy bin . The energy bins, integrated fluxes, and values are given in Table 6. The cosmic-ray neutron flux determined by Gordon et al. Gordon et al. (2004) was used in this analysis, with the parameter from Ref. Gordon et al. (2004) taken to be Wang (2014) for the route used to ship the TeO2 crystals. 80% of the 110mAg and as much as 37% of the 60Co were produced by 1.25–800 MeV neutrons.
The fraction of 110mAg, 110Ag, and 60Co decays that deposit energy in a 60 keV-wide region-of-interest (ROI) surrounding the -decay peak was estimated using GEANT4 simulations of a single 555 cm3 TeO2 crystal. The values obtained were , , and for 110mAg, 110Ag, and 60Co decays, respectively. In the full CUORE array, the presence of nearby crystals would often lead to energy being deposited in more than one crystal. As most -decays would deposit all of their energy in a single crystal, the background can be reduced by rejecting events in which energy was deposited in more than one crystal. Simulations of a TeO2-crystal array indicate that rejecting multi-crystal events can suppress the 110mAg contribution to the ROI by a factor of 2, while the contributions from 110Ag and 60Co will be minimally affected.
To estimate the background rate at Q from cosmogenic activation of TeO2, the following assumptions were made: (1) each crystal spends 3 months at sea level, (2) no 110mAg, 110Ag, and 60Co were present at the beginning of shipment due to their removal during the crystal-growth process, and (3) crystals were delivered to LNGS and stored underground at a constant rate from early 2009 to late 2013 Wang (2014). The resulting contamination levels for 110mAg+110Ag and 60Co when CUORE begins operation in late 2015 will be Bq/kg and Bq/kg, respectively, which correspond to background rates of counts/(keVkg y) and counts/(keVkg y), respectively. After 5 years of running, the contamination levels will decrease to Bq/kg for 110mAg+110Ag and Bq/kg for 60Co, which correspond to background rates of counts/(keVkg y) and counts/(keVkg y), respectively. The contamination levels given here are lower than those predicted in Ref. Lozza and Petzoldt (2014) due to Lozza et al. assuming a longer exposure time of 1 year and a shorter overall cooling time underground of 2 years. Rejecting multi-site events should decrease the 110mAg+110Ag background rates by a factor of 2. Although the background rates in the ROI are at least two orders of magnitude lower than the current CUORE goal background of counts/(keVkg y), for future experiments striving for essentially zero background, cosmogenic activation may have to be addressed more stringently.
| Bin | Bin Range | Integrated Neutron Flux | Cross section | Contribution to | ||
|---|---|---|---|---|---|---|
| (s-1cm2) | (mb) | (s-1) | ||||
| 110mAg | 60Co | 110mAg | 60Co | |||
| 1 | 1.25 MeV – 800 MeV | |||||
| (80%) | (%) | |||||
| 2 | 800 MeV – 1.4 GeV | 999The value of this cross section was reported incorrectly in Ref. Barghouty et al. (2013), but correctly in Ref. Quiter (2005). Quiter (2005) | Barghouty et al. (2013) | |||
| (16%) | (%) | |||||
| 3 | 1.4 GeV – 23 GeV | Barghouty et al. (2013) | Barghouty et al. (2013) | |||
| (3.9%) | (%) | |||||
| 4 | 23 GeV – 150 GeV | Barghouty et al. (2013) | Barghouty et al. (2013) | |||
| (0.01%) | (%) | |||||
V Conclusions
Flux-averaged cross-sections for cosmogenic-neutron activation of radioisotopes in natural tellurium were measured by irradiating TeO2 powder with a neutron beam containing neutrons of kinetic energies up to 800 MeV, and having an energy spectrum similar to that of cosmic-ray neutrons at sea-level. The cross sections obtained for 110mAg and 60Co, the two isotopes which have both half-lives of order a year or longer and Q values larger than the Q of 130Te, were combined with results from tellurium activation measurements with 800 MeV – 23 GeV protons to estimate the background in the CUORE experiment from cosmogenic activation of the TeO2 crystals. The anticipated 110mAg+110Ag and 60Co background rates in [counts/(keVkg y)] at the -decay peak were determined to be and , respectively, at the beginning of counting and and , respectively, after 5 years of counting. The 110mAg+110Ag rates should decrease by a factor of 2 if multi-crystal events are efficiently rejected. These rates are at least two orders of magnitude lower than the goal background for the CUORE experiment.
VI Acknowledgements
We gratefully acknowledge the many valuable discussions with Maura Pavan and Silvia Capelli from the CUORE Collaboration. This work was supported by Lawrence Livermore National Laboratory under Contract DE-AC52-07NA27344, Los Alamos National Laboratory under Contract DE-AC52-06NA25396, Lawrence Berkeley National Laboratory under Contract DE-AC02-05CH11231, the U.S. Department of Energy Office of Defense Nuclear Nonproliferation (NA-22), the U.S. Department of Energy National Nuclear Security Administration under Award Number DE-NA0000979, and the Nuclear Forensics Graduate Fellowship from the U.S. Department of Homeland Security under Grant Award Number 2012-DN-130-NF0001-02. The views and conclusions contained in this document are those of the authors and should not be interpreted as necessarily representing the official policies, either expressed or implied, of the U.S. Department of Homeland Security.
References
- Avignone III et al. (2008) F. T. Avignone III, S. R. Elliot, and J. Engel, Reviews of Modern Physics 80, 481 (2008).
- Rodejohann (2011) W. Rodejohann, International Journal of Modern Physics E 20, 1833 (2011).
- Bilenky and Giunti (2012) S. M. Bilenky and C. Giunti, Modern Physics Letters A 27, 1230015 (2012).
- Aglietta et al. (1998) M. Aglietta, B. Alpat, E. D. Alyea, P. Antonioli, G. Badino, G. Bari, M. Basile, V. S. Berezinsky, F. Bersani, M. Bertaina, R. Bertoni, G. Bonoli, A. Bosco, G. Bruni, G. Cara Romeo, C. Castagnoli, A. Castellina, A. Chiavassa, J. A. Chinellato, L. Cifarelli, F. Cindolo, G. Conforto, A. Contin, V. L. Dadykin, A. De Silva, M. Deutsch, P. Dominici, L. G. Dos Santos, L. Emaldi, R. I. Enikeev, F. L. Fabbri, W. Fulgione, P. Galeotti, C. Ghetti, P. Ghia, P. Giusti, R. Granella, F. Grianti, G. Guidi, E. S. Hafen, P. Haridas, G. Iacobucci, N. Inoue, E. Kemp, F. F. Khalchukov, E. V. Korolkova, P. V. Korchaguin, V. B. Korchaguin, V. A. Kudryavtsev, K. Lau, M. Luvisetto, G. Maccarone, A. S. Malguin, R. Mantovani, T. Massam, B. Mayes, A. Megna, C. Melagrana, N. Mengotti Silva, C. Morello, J. Moromisato, R. Nania, G. Navarra, L. Panaro, L. Periale, A. Pesci, P. Picchi, L. Pinsky, I. A. Pless, J. Pyrlik, V. G. Ryasny, O. G. Ryazhskaya, O. Saavedra, K. Saitoh, S. Santini, G. Sartorelli, M. Selvi, N. Taborgna, V. P. Talochkin, J. Tang, G. C. Trinchero, S. Tsuji, A. Turtelli, I. Uman, P. Vallania, G. Van Buren, S. Vernetto, F. Vetrano, C. Vigorito, E. von Goeler, L. Votano, T. Wada, R. Weinstein, M. Widgoff, V. F. Yakushev, I. Yamamoto, G. T. Zatsepin, and A. Zichichi, Physical Review D 58, 092005 (1998).
- Cebrián et al. (2006) S. Cebrián, J. Amaré, B. Beltrán, J. M. Carmona, E. García, H. Gómez, I. G. Irastorza, G. Luzón, M. Martínez, J. Morales, A. O. D. Solórzano, C. Pobes, J. Puimedón, A. Rodríguez, J. Ruz, M. L. Sarsa, L. Torres, and J. A. Villar, Journal of Physics: Conference Series 39, 344 (2006).
- Elliott et al. (2010) S. R. Elliott, V. E. Guiseppe, B. H. Laroque, R. a. Johnson, and S. G. Mashnik, Physical Review C 82, 1 (2010), arXiv:0912.3748 .
- Lozza and Petzoldt (2014) V. Lozza and J. Petzoldt, (2014), arXiv:1411.5947 .
- Hess et al. (1959) W. N. Hess, H. Wade Patterson, and R. Wallace, Physical Review 116, 445 (1959).
- Goldhagen et al. (2004) P. Goldhagen, J. M. Clem, and J. W. Wilson, Radiation protection dosimetry 110, 387 (2004).
- Heusser (1995) G. Heusser, Annual Review of Nuclear and Particle Science 45, 543 (1995).
- Arnaboldi et al. (2004) C. Arnaboldi, F. Avignone III, J. Beeman, M. Barucci, M. Balata, C. Brofferio, C. Bucci, S. Cebrian, R. Creswick, S. Capelli, L. Carbone, O. Cremonesi, A. de Ward, E. Fiorini, H. Farach, G. Frossati, A. Giuliani, D. Giugni, P. Gorla, E. Haller, I. Irastorza, R. McDonald, A. Morales, E. Norman, P. Negri, A. Nucciotti, M. Pedretti, C. Pobes, V. Palmieri, M. Pavan, G. Pessina, S. Pirro, E. Previtali, C. Rosenfeld, A. Smith, M. Sisti, G. Ventura, M. Vanzini, and L. Zanotti, Nuclear Instruments and Methods in Physics Research Section A 518, 775 (2004).
- Hartnell (2012) J. Hartnell, Journal of Physics: Conference Series 375 (2012), arXiv:1742-6596/375/4/042015 [doi:10.1088] .
- Redshaw et al. (2009) M. Redshaw, B. Mount, E. Myers, and F. Avignone, Physical Review Letters 102, 212502 (2009).
- Scielzo et al. (2009) N. D. Scielzo, S. Caldwell, G. Savard, J. A. Clark, C. M. Deibel, J. Fallis, S. Gulick, D. Lascar, A. F. Levand, G. Li, J. Mintz, E. B. Norman, K. S. Sharma, M. Sternberg, T. Sun, and J. Van Schelt, Physical Review C 80, 025501 (2009).
- Rahaman et al. (2011) S. Rahaman, V.-V. Elomaa, T. Eronen, J. Hakala, A. Jokinen, A. Kankainen, J. Rissanen, J. Suhonen, C. Weber, and J. Äystö, Physics Letters B 703, 412 (2011).
- Nesterenko et al. (2012) D. A. Nesterenko, K. Blaum, M. Block, C. Droese, S. Eliseev, F. Herfurth, E. Minaya Ramirez, Y. N. Novikov, L. Schweikhard, V. M. Shabaev, M. V. Smirnov, I. I. Tupitsyn, K. Zuber, and N. A. Zubova, Physical Review C 86, 1 (2012).
- Bardayan et al. (1997) D. W. Bardayan, M. T. F. da Cruz, M. M. Hindi, A. F. Barghouty, Y. D. Chan, A. Garcia, R.-M. Larimer, K. T. Lesko, E. B. Norman, D. F. Rossi, F. E. Wietfeldt, and I. Zlimen, Physical Review C 55, 820 (1997).
- Norman et al. (2005) E. Norman, A. Smith, A. Barghouty, R. Haight, and S. Wender, Nuclear Physics B - Proceedings Supplements 143, 508 (2005).
- Barghouty et al. (2013) A. F. Barghouty, C. Brofferio, and S. Capelli, Nuclear Instruments and Methods in Physics Research B 295, 16 (2013).
- Hansmann (2010) D. Hansmann, About the Production of Residual Nuclides by Neutron-Induced Reactions up to 180 MeV, Ph.D. thesis, Gottfried Wilhelm Leibniz Universitat Hannover (2010).
- Otuka et al. (2014) N. Otuka, E. Dupont, V. Semkova, B. Pritychenko, A. Blokhin, M. Aikawa, S. Babykina, M. Bossant, G. Chen, S. Dunaeva, R. Forrest, T. Fukahori, N. Furutachi, S. Ganesan, Z. Ge, O. Gritzay, M. Herman, S. Hlavač, K. Katō, B. Lalremruata, Y. Lee, A. Makinaga, K. Matsumoto, M. Mikhaylyukova, G. Pikulina, V. Pronyaev, A. Saxena, O. Schwerer, S. Simakov, N. Soppera, R. Suzuki, S. Takács, X. Tao, S. Taova, F. Tárkányi, V. Varlamov, J. Wang, S. Yang, V. Zerkin, and Y. Zhuang, Nuclear Data Sheets 120, 272 (2014).
- Silberberg and Tsao (1973a) R. Silberberg and C. H. Tsao, The Astrophysical Journal Supplement Series No. 220(I) 25, 315 (1973a).
- Silberberg and Tsao (1973b) R. Silberberg and C. H. Tsao, The Astrophysical Journal Supplement Series No. 220(II) 25, 335 (1973b).
- Silberberg et al. (1998) R. Silberberg, C. H. Tsao, and A. F. Barghouty, The Astrophysical Journal 501, 911 (1998).
- Back and Ramachers (2008) J. Back and Y. Ramachers, Nuclear Instruments and Methods in Physics Research Section A: Accelerators, Spectrometers, Detectors and Associated Equipment 586, 286 (2008).
- Mashnik et al. (2006) S. G. Mashnik, a. J. Sierk, K. K. Gudima, and M. I. Baznat, Journal of Physics: Conference Series 41, 340 (2006).
- Blann (1996) M. Blann, Physical Review C 54, 1341 (1996).
- Agostinelli et al. (2003) S. Agostinelli, J. Allison, K. Amako, J. Apostolakis, H. Araujo, P. Arce, M. Asai, D. Axen, S. Banerjee, G. Barrand, F. Behner, L. Bellagamba, J. Boudreau, L. Broglia, A. Brunengo, H. Burkhardt, S. Chauvie, J. Chuma, R. Chytracek, G. Cooperman, G. Cosmo, P. Degtyarenko, A. Dell’Acqua, G. Depaola, D. Dietrich, R. Enami, A. Feliciello, C. Ferguson, H. Fesefeldt, G. Folger, F. Foppiano, A. Forti, S. Garelli, S. Giani, R. Giannitrapani, D. Gibin, J. Gómez Cadenas, I. González, G. Gracia Abril, G. Greeniaus, W. Greiner, V. Grichine, A. Grossheim, S. Guatelli, P. Gumplinger, R. Hamatsu, K. Hashimoto, H. Hasui, A. Heikkinen, A. Howard, V. Ivanchenko, A. Johnson, F. Jones, J. Kallenbach, N. Kanaya, M. Kawabata, Y. Kawabata, M. Kawaguti, S. Kelner, P. Kent, A. Kimura, T. Kodama, R. Kokoulin, M. Kossov, H. Kurashige, E. Lamanna, T. Lampén, V. Lara, V. Lefebure, F. Lei, M. Liendl, W. Lockman, F. Longo, S. Magni, M. Maire, E. Medernach, K. Minamimoto, P. Mora de Freitas, Y. Morita, K. Murakami, M. Nagamatu, R. Nartallo, P. Nieminen, T. Nishimura, K. Ohtsubo, M. Okamura, S. O’Neale, Y. Oohata, K. Paech, J. Perl, A. Pfeiffer, M. Pia, F. Ranjard, A. Rybin, S. Sadilov, E. Di Salvo, G. Santin, T. Sasaki, N. Savvas, Y. Sawada, S. Scherer, S. Sei, V. Sirotenko, D. Smith, N. Starkov, H. Stoecker, J. Sulkimo, M. Takahata, S. Tanaka, E. Tcherniaev, E. Safai Tehrani, M. Tropeano, P. Truscott, H. Uno, L. Urban, P. Urban, M. Verderi, A. Walkden, W. Wander, H. Weber, J. Wellisch, T. Wenaus, D. Williams, D. Wright, T. Yamada, H. Yoshida, and D. Zschiesche, Nuclear Instruments and Methods in Physics Research Section A 506, 250 (2003).
- Allison et al. (2006) J. Allison, K. Amako, J. Apostolakis, H. Araujo, P. A. Dubois, M. Asai, G. Barrand, R. Capra, S. Chauvie, R. Chytracek, G. A. P. Cirrone, G. Cooperman, G. Cosmo, G. Cuttone, G. G. Daquino, M. Donszelmann, M. Dressel, G. Folger, F. Foppiano, J. Generowicz, V. Grichine, S. Guatelli, P. Gumplinger, A. Heikkinen, I. Hrivnacova, A. Howard, S. Incerti, V. Ivanchenko, T. Johnson, F. Jones, T. Koi, R. Kokoulin, M. Kossov, H. Kurashige, V. Lara, S. Larsson, F. Lei, O. Link, F. Longo, M. Maire, A. Mantero, B. Mascialino, I. Mclaren, P. M. Lorenzo, K. Minamimoto, K. Murakami, P. Nieminen, L. Pandola, S. Parlati, L. Peralta, J. Perl, A. Pfeiffer, M. G. Pia, A. Ribon, P. Rodrigues, G. Russo, S. Sadilov, G. Santin, T. Sasaki, D. Smith, N. Starkov, S. Tanaka, E. Tcherniaev, B. Tomé, A. Trindade, P. Truscott, L. Urban, M. Verderi, A. Walkden, J. P. Wellisch, D. C. Williams, D. Wright, and H. Yoshida, IEEE Transactions on Nuclear Science 53, 270 (2006).
- (30) “http://wnr.lanl.gov,” .
- Gordon et al. (2004) M. Gordon, P. Goldhagen, K. Rodbell, T. Zabel, H. Tang, J. Clem, and P. Bailey, IEEE Transactions on Nuclear Science 51, 3427 (2004).
- Wender et al. (1993) S. A. Wender, S. Balestrini, A. Brown, R. Haight, C. Laymon, T. Lee, P. Lisowski, W. McCorkle, R. Nelson, W. Parker, and N. Hill, Nuclear Instruments and Methods in Physics Research A 336, 226 (1993).
- Wang (2014) B. S. Wang, Cosmogenic Activation of TeO2 in the Neutrinoless Double-Beta Decay Experiment CUORE, Ph.D. thesis, University of California, Berkeley (2014).
- Thomas et al. (2013) K. J. Thomas, A. R. Smith, Y. D. Chan, E. B. Norman, B. S. Wang, and D. L. Hurley, AIP Conference Proceedings 1549, 20 (2013).
- (35) “http://lbf.lbl.gov,” .
- Perillo Isaac et al. (1997) M. C. Perillo Isaac, D. Hurley, R. J. McDonald, E. B. Norman, and A. R. Smith, Nuclear Instruments and Methods in Physics Research A 397, 310 (1997).
- Boson et al. (2008) J. Boson, G. Å gren, and L. Johansson, Nuclear Instruments and Methods in Physics Research A 587, 304 (2008).
- Huy et al. (2007) N. Huy, D. Binh, and V. An, Nuclear Instruments and Methods in Physics Research Section A 573, 384 (2007).
- Helmer et al. (2003) R. Helmer, J. Hardy, V. Iacob, M. Sanchez-Vega, R. Neilson, and J. Nelson, Nuclear Instruments and Methods in Physics Research A 511, 360 (2003).
- Wang et al. (2002) Z. Wang, B. Kahn, and J. Valentine, IEEE Transactions on Nuclear Science 49, 1925 (2002).
- Alessandria et al. (2011) F. Alessandria, E. Andreotti, R. Ardito, C. Arnaboldi, F. T. A. Iii, M. Balata, and I. Bandac, submitted to Astroparticle Physics (2011), arXiv:arXiv:1109.0494v2 .
- Quiter (2005) B. Quiter, 800 MeV Proton Irradiation of Neutrinoless Double Beta-Important Materials, Masters thesis, University of California, Berkeley (2005).