Microscopic examinations of Co valences and spin states in electron-doped LaCoO3
Abstract
We studied the Co valences and spin states in electron-doped LaCo1-yTeyO3 by measuring x-ray absorption spectra and electron spin resonance. The low-temperature insulating state involves the low-spin Co3+ () and the high-spin Co2+ state, which is described by and . The results, in concurrence with the electron–hole asymmetry confirmed in electrical resistivity, coincide with a spin-blockade phenomenon in this system. Further, we discuss the factor in terms of the strong covalent-bonding nature and consider multiple origins of this phenomenon.
pacs:
75.30.Wx, 78.70.Dm, 76.30.-v, 73.23.HkI Introduction
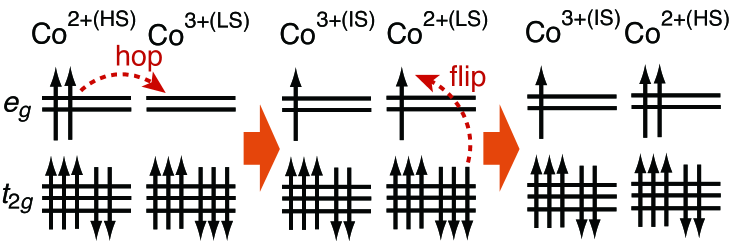
The many-body problem is ubiquitous in a variety of physics fields. In condensed matter physics, correlated electron systems have been shown to exhibit potentially useful phenomena, such as spin-ordered Mott insulation, charge-ordered insulation, magnetoresistance, and superconductivity, Anderson (1972) via spin, charge, orbital, and lattice. Recently, remarkable spin-dependent charge transfer called spin blockade was reported. One type of spin blockade is observed in quantum-dot systems, in which the Pauli exclusion principle forbids electron hopping between two dots with the same spin (Pauli blockade). For example, K. Ono et al. (2002) Another type originates from a prominent concept, the utilization of unique spin-state variability/invariability, as explained below, and is considered to be active in some perovskite-type cobaltites. Maignan et al. (2004); Taskin and Ando (2005); C. F. Chang, Z. Hu, H. Wu, T. Burnus, N. Hollmann, M. Benomar, T. Lorenz, A. Tanaka, H.-J. Lin, H. H. Hsieh, C. T. Chen, and L. H. Tjeng (2009) The fivefold 3 orbitals split to and manifolds in CoO6 octahedra. While Co3+ () may have low-spin (LS, ), high-spin (HS, ), or intermediate-spin (IS, ) states as in LaCoO3, Korotin et al. (1996) Co2+ () is semi-empirically known to prefer an HS state (). Maignan et al. (2004); Sugano et al. (Academic, New York, 1970) Based on this Co character, the electron hopping from Co2+(HS) to Co3+(LS) leads to the unfavorable Co2+(LS) () state accompanied by a simultaneous second process in which the spin state changes to Co2+(HS), as shown in Fig. 1; therefore, the total hopping probability will be considerably suppressed. Maignan et al. (2004) Hereinafter, regardless of its origin, we generally refer to the suppression phenomena of charge transfer between the sites with different spin states as spin-state blockade.
Spin-state blockade was experimentally observed in CoO2 conduction planes. For the ordered oxygen-deficient perovskite semiconductor GdBaCo2O5.5+δ with Co3+(LS)O6 octahedra and Co3+(IS)O5 pyramids, hole doping (Co4+; ) greatly decreases the electrical resistivity, whereas electron doping (Co2+; ) does not. Taskin and Ando (2005) This electron–hole asymmetry confirms the spin-state blockade of electron doping. Taskin and Ando (2005) Further, in the double-perovskite insulator La1.5Sr0.5CoO4, the alternately charge-ordered Co2+ and Co3+ (nominally Co2.5+) have spin states revealed to be HS and LS, respectively, by using soft x-ray absorption spectroscopy, demonstrating that the condition of spin-state blockade is satisfied. C. F. Chang, Z. Hu, H. Wu, T. Burnus, N. Hollmann, M. Benomar, T. Lorenz, A. Tanaka, H.-J. Lin, H. H. Hsieh, C. T. Chen, and L. H. Tjeng (2009) Thus, material designs explicitly utilizing the spin-state blockade could be explored. Maignan et al. (2004); Taskin and Ando (2005); C. F. Chang, Z. Hu, H. Wu, T. Burnus, N. Hollmann, M. Benomar, T. Lorenz, A. Tanaka, H.-J. Lin, H. H. Hsieh, C. T. Chen, and L. H. Tjeng (2009)
Then, one of the intriguing issues is to examine the spin-state blockade phenomena in an electron-doped system with sensitive Co spin-state variability; the best candidate for the matrix is perovskite-type LaCoO3 in its lowest-temperature (LT) range, as mentioned in the conclusion of Ref. [Maignan et al. (2004)]. This material consists of a three-dimensional network of corner-sharing CoO6 octahedra. At room temperature (RT), this system is electrically semiconductive and is magnetically composed of thermally excited Co3+(HS) and possibly Co3+(IS) with a ground state of Co3+(LS). As the temperature decreases, spin crossover (spin-state transition) occurs from approximately 100 K to 30 K, and the system finally enters the highly insulating LT range with only the nonmagnetic ground state of Co3+(LS). Heikes et al. (1964); Bhide et al. (1972); Korotin et al. (1996); M. W. Haverkort, Z. Hu, J. C. Cezar, T. Burnus, H. Hartmann, M. Reuther, C. Zobel, T. Lorenz, A. Tanaka, N. B. Brookes, H. H. Hsieh, H.-J. Lin, C. T. Chen, and L. H. Tjeng (2006) Such a spin-state transition is sensitively induced not only by temperature but also by chemical substitution, magnetic field, and pressure. Sato et al. (2009); Asai et al. (1997); Yamaguchi et al. (1996)
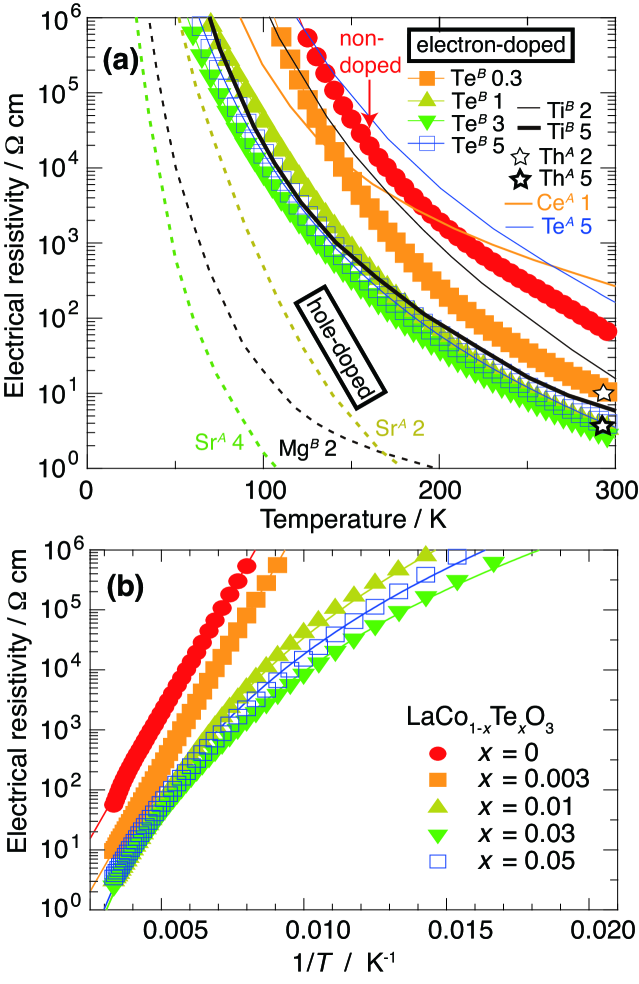
Thus far, spin-state blockade activation has been discussed for various electron-doping elemental substitutions in LaCoO3. In fact, the electron–hole asymmetry in electrical resistivity, the first necessary condition of spin-state blockade, has been reported, for example, in comparisons between electron-doped Th, Ce, and Te substitutions and hole-doped Sr substitution at the La site Gerthsen and Hrdtl (1962); Maignan et al. (2004); Zheng et al. (2008) and comparisons between electron-doped Ti substitutions and hole-doped Mg substitutions at the Co site Jirk et al. (2008). As shown in Fig. 2(a), overall, electron doping does not decrease the electrical resistivity, in contrast to hole doping.
However, the Co3+(LS)–Co2+(HS) coexistence, the second necessary condition of spin-state blockade, remains experimentally uncertain; the spin states of Co3+ and Co2+ have been discussed on the basis of magnetization measurements, which are somewhat confusing and controversial. For example, while Co3+ is interpreted as an LS state, Zheng et al. (2008) a considerable amount of IS and/or HS states are expected to exist. lvarez Serrano et al. (2008); Jirk et al. (2008); Hejtmneka et al. (2008) Further, although the very high stability of Co2+(HS) is often assumed, Maignan et al. (2004); Taskin and Ando (2005); Zheng et al. (2008); C. F. Chang, Z. Hu, H. Wu, T. Burnus, N. Hollmann, M. Benomar, T. Lorenz, A. Tanaka, H.-J. Lin, H. H. Hsieh, C. T. Chen, and L. H. Tjeng (2009) it has been suggested that Co2+(LS) can be realized. Nakatsugawa and Iguchi (1999); Hejtmneka et al. (2008); lvarez Serrano et al. (2008) In addition, there might be charge homogeneity (itinerancy) rather than the Co2+–Co3+ good charge separation. Zheng et al. (2008); Augustinsk et al. (2013) Thus, not only magnetization measurements but also microscopic experiments such as XAS are necessary to determine the Co valences and spin states. C. F. Chang, Z. Hu, H. Wu, T. Burnus, N. Hollmann, M. Benomar, T. Lorenz, A. Tanaka, H.-J. Lin, H. H. Hsieh, C. T. Chen, and L. H. Tjeng (2009) In fact, the understanding of the Co states is quite difficult because of the complex unquenched-orbital angular momenta and strong covalent-bonding nature, in addition to the valence and spin-state degree of freedom. Kanamori (1957); Korotin et al. (1996); Noguchi et al. (2002); Podlesnyak et al. (2006)
Suitable electron-doped LaCoO3 systems are rather limited. A variety of hole-doped La1-xCoO3 systems have been obtained ( Ca, Sr, Ba; ). Kriener et al. (2004); Wu and Leighton (2003); Long et al. (2011) Although the Ce, Th, and Te substitutions are expected to dope an electron with , single-phase Ce is relatively difficult to obtain in bulk, and the radioactivity of Th is difficult to handle. Tabata and Kido (1989); Fuchs et al. (2005); Tabata and Kohiki (1987); Zheng et al. (2008) Moreover, the Co, Ce, Th, and Te valences have not been evaluated using methods such as x-ray absorption spectroscopy (XAS) to evaluate the electron doping. In LaCo1-yO3 systems ( = Ti; ), Nakatsugawa and Iguchi (1999); Cairns et al. (2005); Jirk et al. (2008); Hejtmneka et al. (2008); lvarez Serrano et al. (2008); Robert et al. (2010) XAS spectra showed that the average Co valence decreases from to () Robert et al. (2010) with electron doping using nominal Ti3.5+ (; magnetic) substitution.
An electron-doped system, LaCo1-yTeO3 (Te6+: ; nonmagnetic), is relatively easy to synthesize in a solid-state reaction method and allows us to avoid the complexity with magnetic atoms. Further, the ionic radius of Te6+ has been reported to be between those of Co3+(LS) and Co3+(HS) ( Å, Å, Å), Shannon (1976) suggesting size matching for Co-site substitution to minimize the difficulties accompanying local structural disorder. Pinta et al. (2007) The electrical resistivity () [symbols with lines in Fig. 2(a)] is also consistent with the tendency of electron–hole asymmetry. On the other hand, the valence is expected to give rise to high Coulomb scattering on . Thus, we checked the total disorder effect using the versus analysis [Fig. 2(b)], as performed for LaCo1-xTixO3. Jirk et al. (2008) In the Ti system, as increases, changes from the simple Arrhenius thermal-activation type to a characteristic power-law type – ( to 10) – which is considered to reflect the local disorder effect. Jirk et al. (2008) For LaCo1-yTeyO3, an identical power-law behavior is obtained, as shown in Fig. 2(b). Hence, the total disorder effect on in the Te system will be comparable to that in the Ti system.
In this study, we microscopically show the Co3+(LS)–Co2+(HS) coexistence in LaCo1-yTeyO3 by measuring XAS spectra and electron spin resonance (ESR). First, the Te and Co valences are estimated using XAS at the Te and Co edges in the hard x-ray region. Second, the Co valences and spin states are further revealed using XAS at the Co and O edges in the soft x-ray region. Third, the Co2+ spin state is determined with the factor by using ESR. Last, we discuss several origins of the spin-state blockade.
II Experiments
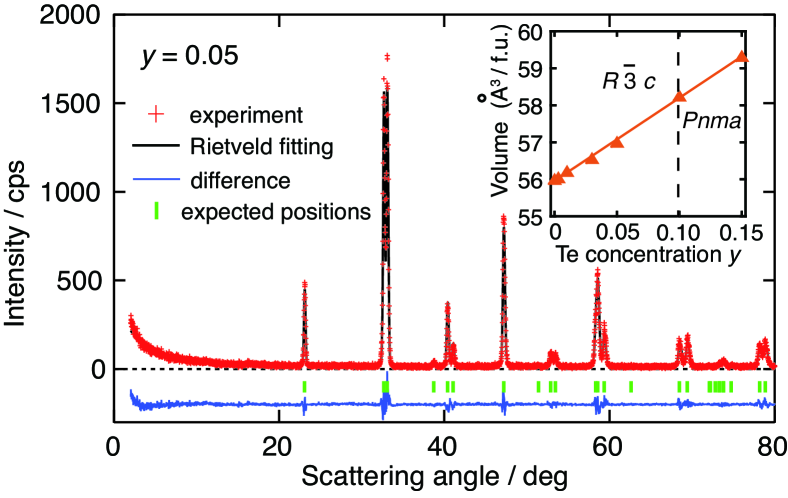
LaCo1-yTeyO3 samples were synthesized by using a stardanrd solid-state reaction method. The starting materials, La2O3 (99.99% purity), Co3O4 (99.9%), and TeO2 (99.9%) powders, were purchased from Kojundo Chemical Laboratory Co.Ltd. Stoichiometric mixtures of them were ground throughly, pelletized, and heated on ZrO2 plates at 1200∘C in air for 12 h twice (24 h in total). No Bragg reflections, other than those of the perovskite structure, were detected from all the samples in the Cu-K x-ray diffraction patterns measured at room temperature. The typical data and Rietveld fitting were shown in Fig. 3. The Rietveld fitting was performed using Z-Rietveld software. Oishi et al. (2009); Oishi-Tomiyasu et al. (2012) The obtained lattice volume is almost the same as the representative reported value at Radaelli and Cheong (2002) and monotonically increases with increasing , as shown in the inset in Fig. 3. The composition ratio LaCo1-yTeyO3 is confirmed together with valences by XAS in the hard x-ray region in the next section [Figs. 4(a)–4(c)].
We remark the La1-xTexCoO3 samples previously reported. Zheng et al. (2008) In the non-substituted LaCoO3, the lattice constants in the previous sample are much larger than the representative values; the former set at room temperature corresponds to the latter one above 600 K. Zheng et al. (2008); Radaelli and Cheong (2002) The reason might be related to the usage of Co2O3 and the rather low-temperature synthesis at 1050∘C, Zheng et al. (2008) which is, however, beyond the scope of this study.
XAS measurements in the hard x-ray region were performed on the BL-3A beamline at the Photon Factory (PF) at KEK in Japan. The data were recorded in the bulk-sensitive fluorescence yield mode with fixed final energies at the Te and Co -absorption edges. For the reference samples, polycrystalline TeO2 (Te4+), Te(OH)6 (Te6+), La2CoO4 (Co2+), La1.5Ba0.5CoO4 (Co2.5+), and LaSrCoO4 (Co3+) were used. XAS measurements in the soft x-ray region were performed on the BL-08B beamline at the National Synchrotron Radiation Research Center (NSRRC) in Taiwan and the BL-19B beamline at PF. Samples were cleaned with diamond files just before inserting them into a vacuum chamber with a base pressure of Torr. The data were also collected in the bulk-sensitive fluorescence yield mode. The surface-sensitive total electron yield data are not used in this study but were consistent with the fluorescence data. CoO was measured for the references of relative energy calibration and Co2+(HS). The energy resolutions were approximately 0.3 eV and 0.2 eV for the Co edges and O edge, respectively. ESR measurements were performed in pulsed magnetic fields at the Institute for Materials Research, Tohoku University. The frequencies are fixed in the range from 190 to 450 GHz. Direct-current magnetization was measured using superconducting quantum interference device (SQUID) magnetometers at the Center for Low Temperature Science, Tohoku University. Direct-current electrical resistivity was measured using the four-probe method.
III Results and discussion
III.1 XAS
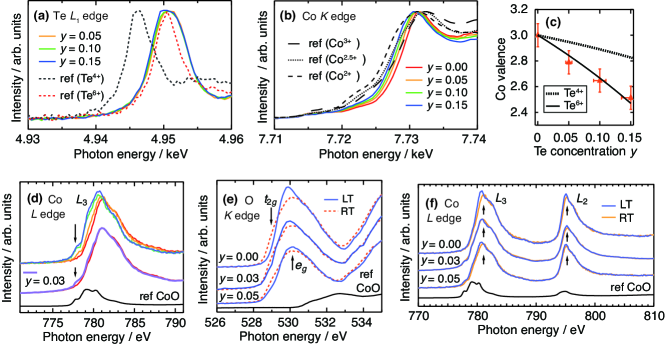
Figures 4(a) and 4(b) show XAS spectra of the LaCo1-yTeyO3 samples and the reference samples in the hard x-ray region. In Fig. 4(a), the Te -edge spectra of LaCo1-yTeyO3 are nearly coincident. Further, the peak positions of the LaCo1-yTeyO3 samples are at much higher energies than that of the Te4+ reference and are nearly equal to that of the Te6+ reference. Thus, the Te valence of the samples is estimated to be nearly . This result is consistent with the fact that a number of perovskite O3 materials with -site Te6+ substitution were reported. Politova and Venevtsev (1975) Meanwhile, the Te valence was previously assumed to be in the -site Te substitution system La1-xTexCoO3 as well as in Mn oxides, Zheng et al. (2008); Tan et al. (2003) which will be therefore attributable to the difference of substitution site. In Fig. 4(b), the Co -edge spectra of LaCo1-yTeyO3 shift to the lower-photon-energy side with increasing and those of references shift similarly on decreasing the average Co valence () from , confirming that proportionally decreases (electron doping) with Te substitution. Further, the shifts are estimated to be eV from to 0.15 and eV from the reference Co3+ to Co2+. The relation of versus , obtained from the shifting degree, is compared to those calculated from the composition formulae LaCoTeO3 and LaCoTeO3 in Fig. 4(c). The experimental relation is in agreement with that for LaCoTeO3, indicating that electron-doped samples described by this composition formula were obtained.
Next, the Co states can be studied using XAS spectra in the soft x-ray region. Figure 4(d) shows the Co -edge XAS spectra. The spectral lines consist of the base lines (matrix Co3+) and the shoulders in the lower-photon-energy side increasing with , as shown by the arrows. The shoulders are identical to the reference CoO line, which is consistent with the existence of Co2+(HS). C. F. Chang, Z. Hu, H. Wu, T. Burnus, N. Hollmann, M. Benomar, T. Lorenz, A. Tanaka, H.-J. Lin, H. H. Hsieh, C. T. Chen, and L. H. Tjeng (2009) Figure 4(e) shows the comparisons of O -edge XAS spectra at RT and LT. This peak is separated from the CoO line in turn, and the lower- and higher-photon-energy parts correspond to the densities of unoccupied Co3+ and states (holes), respectively. Hu et al. (2012) In all the samples, the holes decrease and the holes increase from RT to LT, indicating the Co3+(HS)-to-Co3+(LS) spin-state transition. Furthermore, this transition corresponds to a slight sharpening of Co -edge main peak tops from RT to LT, M. W. Haverkort, Z. Hu, J. C. Cezar, T. Burnus, H. Hartmann, M. Reuther, C. Zobel, T. Lorenz, A. Tanaka, N. B. Brookes, H. H. Hsieh, H.-J. Lin, C. T. Chen, and L. H. Tjeng (2006) which is also observed [Fig. 4(f)]. Thus, these soft x-ray data [Figs. 4(d–f)] comprehensively indicate that the Co2+(HS)–Co3+(LS) coexistence is realized towards LT.
III.2 ESR
To distinguish Co2+(HS) and Co2+(LS) more clearly, we estimated the factor by measuring ESR. The powder-averaged value is both experimentally and theoretically known to be approximately 4.3 for Co2+(HS) () and approximately 2 for Co2+(LS) (); Low (1958); Lines (1963); Dance et al. (1994); Hoffmann et al. (2013) the Co2+ spin state can be determined with this difference. Further, the aforementioned XAS measurements show that Co3+ forms the LS state (; nonmagnetic singlet), which exhibits no ESR signal at the lowest temperature below 20 K without the aid of thermal activation; Noguchi et al. (2002) hence, only Co2+ signals are expected to be observed in the lowest-temperature range.
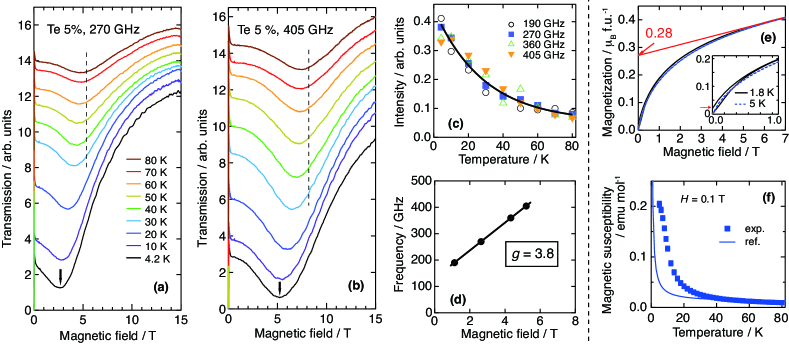
Figures 5(a) and 5(b) show the ESR absorption spectra measured for LaCo0.95Te0.05O3 at typical frequencies. A concave absorption structure is observed in all the data. The absorption intensity is the strongest at the measured lowest temperature (4.2 K) and decreases with increasing temperature up to 80 K, as shown in Fig. 5(c), indicating that the 4.2-K absorption corresponds to Co2+. On the other hand, with increasing the temperature, the absorption bottom position approaches to the dotted vertical lines, corresponding to the bottom positions for the thermally activated Co3+(HS). Noguchi et al. (2002) Hence, the high-temperature spectra will be interpreted as the superposition of the Co2+ component and the thermally activated Co3+(HS) component.
Figure 5(d) shows the magnetic-field dependence of absorption frequencies at 4.2 K. The slope gives the value of 3.8, confirming that the Co2+ forms the HS state, rather than the LS state. We also remark that this Co2+(HS) state differs from the often assumed spin-only model ( and ).
The XAS and ESR combined result is summarized as LaCoCoTeO3 in the lowest temperature range for , in which the Co2+(HS) state is described by and . We compare this result to the magnetization data. (1) Figure 5(e) shows the field dependence of magnetization measured at 1.8 K and 5 K. The paramagnetic Brillouin-like saturating behavior is observed with the maximum value 0.28 per formula unit (f.u.). This value corresponds to the 15% concentration of Co2+(HS), which coincides with the XAS and ESR result. (2) As shown in the inset in Fig. 5(e), tiny finite remanent magnetization is observed at 1.8 K, meaning that a weak ferromagnetic correlation grows in the mainly paramagnetic state below 5 K. In fact, in the temperature dependence of magnetic susceptibility [Fig. 5(f)], as the temperature decreases, the experimental values increase in advance of the calculated reference line obtained for the 15% concentration of Co2+(HS) in the ideally paramagnetic Curie law. Thus, the XAS, ESR, and magnetization results are consistently understood with each other.
We further discuss . This value is smaller than the typical value of 4.3, which is, for example, observed for Co2+(HS) in MgO. Low (1958) Low et al. correlated values to the metal-ligand bonding nature: for the state [Co2+(HS)] and for the state [Fe2+(HS)) and Co3+(HS))], where takes 1 in the ideal ionic-bonding case and decreases from 1 in accordance with the degree of the covalent-bonding nature. Low (1958); Low and Weger (1960) Table 1 gives the values estimated using these relations for some systems. Low and Weger (1960); Noguchi et al. (2002) Among them, interestingly, gives a significantly low , indicating the highly covalent nature of Co2+(HS)–O2- bonding in the electron-doped LaCoO3 system. Indeed, on increasing the ionic radius ratio of doped ions to matrix ions, which is also regarded as an index of chemical pressure and therefore covalency, the value decreases. Thus, the Co2+ ion, squeezed in the Co3+(LS) matrix, forms the HS state but is probably accompanied with a strong covalent-boding nature.
III.3 Discussion of origins of spin-state blockade
Thus far, we showed that the LT insulating range includes Co3+(LS) and Co2+(HS) and exhibits the predominantly high electrical resistivity compared to hole-doped systems. These results demonstrate the emergence of spin-state blockade phenomena. As its origin, first, the rule prohibiting Co2+(LS) is suggested, as mentioned in Introduction. Maignan et al. (2004); Taskin and Ando (2005); C. F. Chang, Z. Hu, H. Wu, T. Burnus, N. Hollmann, M. Benomar, T. Lorenz, A. Tanaka, H.-J. Lin, H. H. Hsieh, C. T. Chen, and L. H. Tjeng (2009) However, in this subsection, we would like to point out that this is not the only origin or interpretation. The discussion is generally applicable to not only this-time LaCo1-yTeyO3 but also BaCo2O5.5+δ (: rare earth), La1.5Sr0.5CoO4, and other LaCoO3-based electron-doped systems.
The second probable origin is the difference of covalent-bonding strength. Goodenough presented the theory, in which the covalent-bonding strength provides a criterion to determine whether the outer electrons are best described by a localized-electron or a band/molecular-electron model. Goodenough (1966) In his theory, LS states generate the extremely covalent *-orbital band connecting interatomic Co 3- and Co 3- through O 2, whereas HS sites are localized. This suggests that the electron transfer from Co2+(HS) to Co3+(LS) is suppressed. Indeed, in turn, Co4+ forms the LS state, or possibly the IS state like in SrCoO3, in hole-doped systems that are much more conductive. Podlesnyak et al. (2008, 2011); Long et al. (2011)
Our ESR study revealed the highly covalent Co2+(HS). Combining with the aforementioned theory, this Co2+(HS) is considered to be very close to the extremely covalent Co2+(LS). Therefore, Co2+(LS) that is very rare in oxides could be realized by a stimulus like pressure in future.
The third possible origin is the large difference of ionic radii. The Co2+(HS) is particularly large compared to the matrix Co3+(LS) and others [ Å, Å, Å, and Å]. Shannon (1976) Hence, the movement of Co2+(HS) in the Co3+(LS) matrix is accompanied by large local lattice deformation, which will costs the high activation energy based on elastic energy. This spin-state-lattice coupling is also expected to suppress the Co2+(HS)–Co3+(LS) charge transfer.
The other related factor may be the local structure around dopants, oxygen defects, and doped electrons. Thus, the spin-state blockade phenomena should be regarded as the total effect of these origins.
IV Conclusions
Electron-doped LaCo1-yTeyO3 was microscopically studied by measuring hard and soft x-ray absorption spectra and electron spin resonance. The LT insulating range includes Co3+(LS) and Co2+(HS), which coincides with the spin-state blockade in combination with the electron–hole asymmetry in electrical resistivity. Further, this Co2+(HS) is considered to be accompanied with a significant covalent-bonding nature. We also discussed several origins of the spin-state blockade. Opportunities could be created for the further studies of electron-doped Co-spin-state physics, the realization of rare Co2+(LS), and the development of materials and devices utilizing the spin-state blockade, such as sensors and gate switches with Co3+(LS) creation/annihilation.
Acknowledgements.
We thank Mr. S. Kayamori for assisting with the sample characterization, Mr. S. Nara and Ms. E. P. Sinaga for assisting with the preliminary sample evaluation, Mr. K. Hashimoto for assisting with the preliminary ESR data analysis, Dr. N. Kimura for assisting with the SQUID measurements, and the NSRRC staff and students for their hospitality and assistance with the XAS measurements. The PF experiments have been performed under the approval of the Photon Factory Program Advisory Committee (Proposal No. 2009S2-008, 2012S2-005, and 2015PF-BL-19B). This study was financially supported by Grants-in-Aid for Young Scientists (B) (22740209 and 26800174) and Scientific Researches (S) (21224008) from MEXT, Japan. H. N. and Y. M. were financially supported by the Funding Program for World-leading Innovative R&D in Science and Technology (FIRST).References
- Anderson (1972) P. W. Anderson, Science 177, 4047 (1972).
- For example, K. Ono et al. (2002) For example, K. Ono, D. G. Austing, Y. Tokura, and S. Tarucha, Science 297, 1313 (2002).
- Maignan et al. (2004) A. Maignan, V. Caignaert, B. Raveau, D. Khomskii, and G. Sawatzky, Phys. Rev. Lett. 93, 026401 (2004).
- Taskin and Ando (2005) A. A. Taskin and Y. Ando, Phys. Rev. Lett. 95, 176603 (2005).
- C. F. Chang, Z. Hu, H. Wu, T. Burnus, N. Hollmann, M. Benomar, T. Lorenz, A. Tanaka, H.-J. Lin, H. H. Hsieh, C. T. Chen, and L. H. Tjeng (2009) C. F. Chang, Z. Hu, H. Wu, T. Burnus, N. Hollmann, M. Benomar, T. Lorenz, A. Tanaka, H.-J. Lin, H. H. Hsieh, C. T. Chen, and L. H. Tjeng, Phys. Rev. Lett. 102, 116401 (2009).
- Korotin et al. (1996) M. A. Korotin, S. Y. Ezhov, I. V. Solovyev, V. I. Anisimov, D. I. Khomskii, and G. A. Sawatzky, Phys. Rev. B 54, 5309 (1996).
- Sugano et al. (Academic, New York, 1970) S. Sugano, Y. Tanabe, and H. Kamimura, Multiplets of Transition-Metal Ions in Crystals (Academic, New York, 1970).
- Heikes et al. (1964) R. R. Heikes, R. C. Miller, and R. Mazelsky, Physica 30, 1600 (1964).
- Bhide et al. (1972) V. G. Bhide, D. S. Rajoria, G. R. Rao, and C. N. R. Rao, Phys. Rev. B 6, 1021 (1972).
- M. W. Haverkort, Z. Hu, J. C. Cezar, T. Burnus, H. Hartmann, M. Reuther, C. Zobel, T. Lorenz, A. Tanaka, N. B. Brookes, H. H. Hsieh, H.-J. Lin, C. T. Chen, and L. H. Tjeng (2006) M. W. Haverkort, Z. Hu, J. C. Cezar, T. Burnus, H. Hartmann, M. Reuther, C. Zobel, T. Lorenz, A. Tanaka, N. B. Brookes, H. H. Hsieh, H.-J. Lin, C. T. Chen, and L. H. Tjeng, Phys. Rev. Lett. 97, 176405 (2006).
- Sato et al. (2009) K. Sato, A. Matsuo, K. Kindo, Y. Kobayashi, and K. Asai, J. Phys. Soc. Jpn 78, 093702 (2009).
- Asai et al. (1997) K. Asai, O. Yokokura, M. Suzuki, T. Naka, T. Matsumoto, H. Takahashi, N. Môri, and K. Kohn, J. Phys. Soc. Jpn 66, 967 (1997).
- Yamaguchi et al. (1996) S. Yamaguchi, Y. Okimoto, H. Taniguchi, and Y. Tokura, Phys. Rev. B 53, R2926 (1996).
- Gerthsen and Hrdtl (1962) V. P. Gerthsen and K. U. Hrdtl, Z. Naturforschg. (German) 17 a, 514 (1962).
- Zheng et al. (2008) G. H. Zheng, X. B. Zhu, W. H. Song, and Y. P. Sun, J. Appl. Phys. 103, 013906 (2008).
- Jirk et al. (2008) Z. Jirk, J. Hejtmnek, K. Knek, and M. Veverka, Phys. Rev. B 78, 014432 (2008).
- lvarez Serrano et al. (2008) I. lvarez Serrano, G. J. Cuello, M. L. Lpez, A. Jimnez-Lpez, C. Pico, E. Rodrguez-Castelln, E. Rodrguez, and M. L. Veiga, J. Phys. D: Appl. Phys. 41, 195001 (2008).
- Hejtmneka et al. (2008) J. Hejtmneka, Z. Jirk, K. Knek, M. Maryko, M. Veverka, and C. Autret, J. Magn. Magn. Mater. 78, 014432 (2008).
- Nakatsugawa and Iguchi (1999) H. Nakatsugawa and E. Iguchi, J. Phys.:Condens. Matter 11, 1711 (1999).
- Augustinsk et al. (2013) P. Augustinsk, V. Kpek, and J. Kune, Phys. Rev. Lett. 110, 267204 (2013).
- Kanamori (1957) J. Kanamori, Prog. Theor. Phys. 17, 177 (1957).
- Noguchi et al. (2002) S. Noguchi, S. Kawamata, K. Okuda, H. Nojiri, and M. Motokawa, Phys. Rev. B 66, 094404 (2002).
- Podlesnyak et al. (2006) A. Podlesnyak, S. Streule, J. Mesot, M. Medarde, E. Pomjakushina, K. Conder, A. Tanaka, M. W. Haverkort, and D. I. Khomskii, Phys. Rev. Lett. 97, 247208 (2006).
- Kriener et al. (2004) M. Kriener, C. Zobel, A. Reichl, J. Baier, M. Cwik, K. Berggold, H. Kierspel, O. Zabara, A. Freimuth, and T. Lorenz, Phys. Rev. B 69, 094417 (2004).
- Wu and Leighton (2003) J. Wu and C. Leighton, Phys. Rev. B 67, 174408 (2003).
- Long et al. (2011) Y. Long, Y. Kaneko, S. Ishiwata, Y. Taguchi, and Y. Tokura, J. Phys.: Condens. Matter 23, 245601 (2011).
- Tabata and Kido (1989) K. Tabata and H. Kido, Phys. Stat. Sol. (a) 111, K105 (1989).
- Fuchs et al. (2005) D. Fuchs, P. Schweiss, P. Adelmann, T. Schwarz, and R. Schneider, Phys. Rev. B 72, 014466 (2005).
- Tabata and Kohiki (1987) K. Tabata and S. Kohiki, J. Mat. Sci. 22, 3781 (1987).
- Cairns et al. (2005) D. L. Cairns, I. M. Reaney, H. Zheng, D. Iddles, and T. Price, J. Euro. Ceramic Soc. 25, 433 (2005).
- Robert et al. (2010) R. Robert, D. Logvinovich, M. H. Aguirre, S. G. Ebbinghaus, L. Bocher, P. Tome, and A. Weidenkaff, Acta Mater. 58, 680 (2010).
- Shannon (1976) R. D. Shannon, Acta Cryst. A32, 751 (1976).
- Pinta et al. (2007) C. Pinta, D. Fuchs, E. Pellegrin, P. Adelmann, S. Mangold, and S. Schuppler, J. Low Temp. Phys. 147, 314 (2007).
- Oishi et al. (2009) R. Oishi, M. Yonemura, Y. Nishimaki, S. Torii, A. Hoshikawa, T. Ishigaki, T. Morishima, K. Mori, and T. Kamiyama, Nucl. Instr. Meth. Phys. Res. A600, 94 (2009).
- Oishi-Tomiyasu et al. (2012) R. Oishi-Tomiyasu, M. Yonemura, T. Morishima, A. Hoshikawa, S. Torii, T. Ishigaki, and T. Kamiyama, J. Appl. Cryst. 45, 299 (2012).
- Radaelli and Cheong (2002) P. G. Radaelli and S.-W. Cheong, Phys. Rev. B 66, 094408 (2002).
- Politova and Venevtsev (1975) E. D. Politova and Y. N. Venevtsev, Mat. Res. Bull. 10, 319 (1975).
- Tan et al. (2003) G. T. Tan, S. Y. Dai, P. Duan, Y. L. Zhou, H. B. Lu, and Z. H. Chen, J. Appl. Phys. 93, 5480 (2003).
- Hu et al. (2012) Z. Hu, H. Wu, T. C. Koethe, S. N. Barilo, S. V. Shiryaev, G. L. Bychkov, C. Schsler-Langeheine, T. Lorenz, A. Tanaka, H. H. Hsieh, et al., New J. Phys. 14, 123025 (2012).
- Low (1958) W. Low, Phys. Rev 109, 256 (1958).
- Lines (1963) M. E. Lines, Phys. Rev 131, 546 (1963).
- Dance et al. (1994) J. M. Dance, A. Boireau, A. L. Lirzin, and B. Lestienne, Solid State Commun. 91, 475 (1994).
- Hoffmann et al. (2013) S. K. Hoffmann, J. Goslar, and S. Lijewski, Appl. Mag. Res. 44, 817 (2013).
- Low and Weger (1960) W. Low and M. Weger, Phys. Rev (1960), 118, 1119; 118, 1130; 120, 2277.
- Goodenough (1966) J. B. Goodenough, J. Appl. Phys. 37, 1415 (1966).
- Podlesnyak et al. (2008) A. Podlesnyak, M. Russina, A. Furrer, A. Alfonsov, E. Vavilova, V. Kataev, B. Büchner, T. Strässle, E. Pomjakushina, K. Conder, et al., Phys. Rev. Lett. 101, 247603 (2008).
- Podlesnyak et al. (2011) A. Podlesnyak, G. Ehlers, M. Frontzek, A. S. Sefat, A. Furrer, T. Strässle, E. Pomjakushina, K. Conder, F. Demmel, and D. I. Khomskii, Phys. Rev. B 83, 134430 (2011).