X-ray Fading and Expansion in the “Miniature Supernova Remnant” of GK Persei
Abstract
We report on a second epoch of Chandra X-ray imaging spectroscopy of the spatially-resolved old nova remnant GK Persei. An ACIS-S3 observation of 97.4 ks was conducted in November 2013 after a lapse of 13.8 years from the last visit in 2000. The X-ray emitting nebula appeared more faint and patchy compared with the first epoch. The flux decline was particularly evident in fainter regions and the mean decline was 30–40% in the 0.5–1.2 keV energy band. A typical expansion of the brightest part of the remnant was 19, which corresponds to an expansion rate of 014 yr-1. The soft X-ray spectra extracted from both the 2000 and 2013 data can be explained by a non-equilibrium ionization collisional plasma model convolved with interstellar absorption, though do not allow us to constrain the origin of the flux evolution. The plasma temperature has not significantly evolved since the 2000 epoch and we conclude that the fading of the X-ray emission is due largely to expansion. This implies that recent expansion has been into a lower density medium, a scenario that is qualitatively consistent with the structure of the circumstellar environment photographed soon after the initial explosion more than a century ago. Fainter areas are fading more quickly than brighter areas, indicating that they are fainter because of a lower ambient medium density and consequently more rapid expansion.
Subject headings:
stars: novae, cataclysmic variables — stars: individual (GK Persei, Nova Persei 1901) — X-rays: stars1. Introduction
Structures resulting from stellar explosions represent space laboratories that elucidate the physics of enormous blasts under extreme conditions, and are of fundamental importance to astrophysics. The representative of this kind of structure is a supernova remnant (SNR). X-ray observations of SNRs have provided wide-ranging insights into their plasma physics, shock phenomena, and into Cosmic-ray origins (e.g., Slane et al. 1999; Uchiyama et al. 2007; Yamaguchi et al. 2009; Katsuda et al. 2013). However, the time history of an individual SNR is generally difficult to track because of the long timescales — comparable to the entirety of human written history — over which typical remnants evolve. With the notable exception of spectacular nearby remnants, such as Cas A (e.g., Fesen et al., 2006; Patnaude & Fesen, 2009), our understanding of remnant expansion and evolution has therefore largely depended on theory, numerical simulations, and systematic snapshot observational assessments of objects sampling different evolutionary phases.
This paper presents a different approach to studying the X-ray evolution of an explosion remnant. We study not a supernova but a “classical” nova resulting from a cataclysmic explosion in an accreting binary system comprising a white dwarf and a red dwarf or giant companion. The released energy and material propagate through the circumstellar environment similar to, but on much smaller scales than, those in supernovae. Classical novae are about 105 times smaller in energy, and typically factors of – times smaller in ejecta mass. The analogy with supernovae renders a nova remnant a miniature SNR with a short life: its full dynamical evolution occurs on a timescale comparable with a human lifetime and can potentially be followed in X-rays by multi-epoch imaging spectroscopy.
Our target is Nova Persei 1901 (hereafter GK Per), which hosts the largest known X-ray emitting nebula centered on a white dwarf binary (Seaquist et al., 1989a). In the following, we start by comparing Chandra Cycle-1 data of GK Per obtained in 2000 with our recent observation in Cycle-15 obtained in 2013. The earlier data have been analyzed in detail by Balman (2005) who characterized the shock conditions, energetics of the remnant, and the shocked mass. Here, we use the second epoch data to examine the remnant expansion, cooling and fading, and discuss the results in the context of the physics of expanding explosion remnants.
2. Target (GK Persei)
GK Per is a magnetic white dwarf binary at the distance of 470 pc (McLaughlin, 1960) that underwent a classical nova outburst on 1901 February 21 (Williams, 1901). Light echoes from the event photographed in 1901 and 1902 illuminated a complex of shell-like structures around the central object (Ritchey, 1902; Perrine, 1902) that Bode et al. (1987) and Bode et al. (2004) interpreted as part of an old planetary nebula. This nebula is also apparent as a vaguely bipolar-shaped structure, elongated in the northwest-southeast direction, in the light of H, [O III] 5007, and the IRAS 100 m band. Schaefer (1988) noted that the lack of the sort of reflection features seen in GK Per around other novae indicates that the grain density around GK Per is unusually high — in keeping with the planetary nebular origin suggested by Bode et al. (1987).
The extended nova remnant and its evolution has been imaged extensively in the optical over several decades (e.g., Seaquist et al., 1989b; Anupama & Prabhu, 1993; Slavin et al., 1995; Lawrence et al., 1995; Shara et al., 2012; Liimets et al., 2012). It has a pronounced asymmetric appearance, with brighter emission to the southwest and a dearth of emission in the east. The limb defined by the extent of optical knots exhibits a decidedly flattened appearance to the northwest and northeast. Hubble Space Telescope (HST) observations in 1995 and 1997 revealed the details of the remnants complex structure comprising a myriad of knots (Shara et al., 2012). Its present-day angular size based on optical images from 2011 December 13 is about 1 in radius, and the knots are observed to be expanding with circular symmetry (Liimets et al., 2012). Anupama & Kantharia (2005) found a possible deceleration of the ejecta after 1950 for the period 1901–2003, suggesting that the remnant is in a transition to an adiabatic phase. A typical expansion rate of the outermost optical knots in 2004–2011 was 03–05 yr-1, corresponding to a velocity of 600–1000 km s-1 (Liimets et al., 2012), which is similar to the 1995–1997 results found by Shara et al. (2012).
The various properties of the remnant were discussed in detail by Seaquist et al. (1989a). The long axis of the bipolar H I and IRAS 100 m map lies in the northwest-southeast direction, and essentially orthogonal to the northeast-southwest axis (of symmetry of the X-ray remnant, see below). Seaquist et al. (1989a) concluded that the nova ejecta are interacting with a cone of this pre-existing ambient medium in the southwest where the remnant appears brightest. This region also corresponds to a particularly bright structure lying at an angular separation of approximately 05–1 from the central star in the 1901 and 1902 images by Ritchey (1902) and Perrine (1902). Seaquist et al. (1989a) suggested this might be a cone of material ejected during the planetary nebular phase suggested by Bode et al. (1987) and that the remnant is being decelerated by interaction with this material. Seaquist et al. (1989a) also showed that the remnant expansion was consistent with an adiabatic evolution in a medium with density declining with the inverse square of the radial distance. Here the Seaquist et al. (1989a) analysis was based on data obtained up until the late 1980’s, and Anupama & Kantharia (2005) discussed subsequent observations made until 2003, presenting evidence that the deceleration of the blast expansion had decreased since 1987. They concluded that the density into which the southwest quadrant was expanding in the later data was lower that in 1987 by a factor of about 7.
Regarding non-optical wavelengths, non-thermal radio emission indicating the presence of accelerated electrons interacting with the remnant magnetic field was detected in the southwest quadrant by Reynolds & Chevalier (1984a), who estimated that a minimum of 1% of the 1045 erg explosion energy has gone into the non-thermal electrons and the magnetic field. In the X-ray regime, GK Per has the only nova remnant for which clumps were spatially resolved. ROSAT discovered the extended nebula for the first time in 1996 (Balman & Ögelman, 1999), finding the bulk of the X-ray emission came from the southwestern quadrant, then Chandra revealed the presence of local X-ray structures in a “lumpy and asymmetric nebula” in 2000 (Balman, 2005). The Chandra ACIS spectrum was dominated by a softer optically-thin thermal plasma component below 1.0–1.2 keV, but a harder non-thermal component was also found by Balman (2005), who concluded that the remnant was still in the adiabatic phase in which the radiated energy loss is still negligible in comparison with the initial explosion energy.
3. Observations and Reduction
Chandra has now visited GK Per twice for imaging spectroscopy using the ACIS-S3 back-illuminated CCD. The first exposure was taken on 2000 February 10 (Obs.ID 650) with a total observing time of 95.3 ks. Our additional observation was obtained on 2013 November 22 (Obs.ID 15741) with an exposure of 97.4 ks (see Table 1 for details). Both data sets were re-processed by the standard pipeline using the Chandra Interactive Analysis of Observations (CIAO) package (Fruscione et al., 2006) with calibration database version 4.6.2.
| Obs.ID | |||
| Par. | Unit | 650 | 15741 |
| tbbfootnotemark: | (d) | 36148.0 | 41182.2 |
| tbbfootnotemark: | (yr) | 99.0 | 112.8 |
| ccfootnotemark: | (UT) | 2000-02-10 | 2013-11-22 |
| 01:15:21 | 20:51:14 | ||
| ccfootnotemark: | (UT) | 2000-02-11 | 2013-11-24 |
| 04:46:38 | 00:44:32 | ||
| ccfootnotemark: | (ks) | 95.3 | 97.4 |
| ddfootnotemark: | (arcmin) | 1.25 | 0.18 |
| SCe,fe,ffootnotemark: | (counts) | 3693 | 793 |
| NRe,fe,ffootnotemark: | (counts s-1) | 3.0610-2 | 5.6810-3 |
| MEe,fe,ffootnotemark: | (keV) | 0.61 | 0.66 |
| HRggfootnotemark: | 0.680.10 | 0.730.10 | |
| (1021 cm-2) | 2.10 (fixed) | 2.10 (fixed) | |
| (keV) | 0.23 | 0.22 | |
| (solar) | 0.31 | 0.16 | |
| (solar) | 2.84 | 1.71 | |
| (109 s cm-3) | 4.82 | 3.77 | |
| hhfootnotemark: | (1054 cm-3) | 1.18 | 1.63 |
| fffootnotemark: | (10-14 ergs s-1 cm-2) | 8.09 | 4.84 |
| f,hf,hfootnotemark: | (1030 ergs s-1) | 9.70 | 5.76 |
| 38.4/28 | 10.7/14 | ||
aStatistical uncertainties indicate 1 confidence ranges.
bElapsed days and years from the discovery of the nova (15436.6 d in modified Julian date) to the middle of each observation.
cStart dates (), end dates (), and exposure times ().
dOff-axis angles () of the white dwarf binary, of which the nova explosion in 1901 caused the surrounding remnant.
eSource counts (SC), net rates (NR), and median energies (ME).
fValues are estimated in the 0.5–1.2 keV energy band.
gHardness ratios (HR) of the remnant spectra. The values were defined as (HS)/(HS), where H and S are photon fluxes in the harder (0.8–1.2 keV) and softer (0.5–0.8 keV) bands, respectively.
hValues are for a distance of 470 pc (McLaughlin, 1960).
4. Analysis
4.1. Diffuse Emission and Comparison
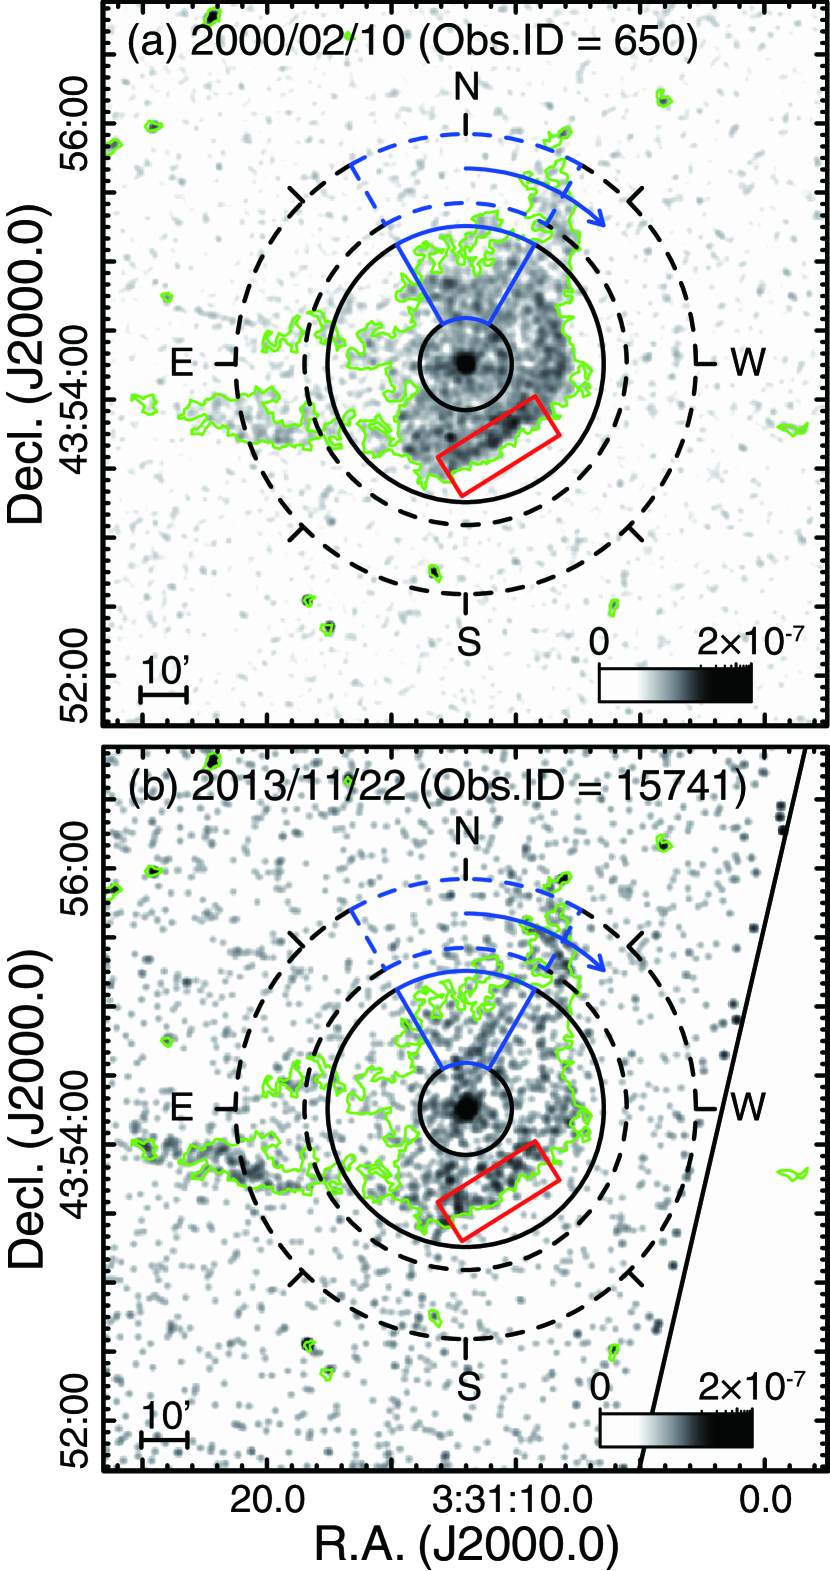
As found by Balman (2005) from the 2000 February data, the latest observation reveals the brightest X-ray emission to lie in the southwest quadrant and to be characterized by a prominent arc with extended “wings” of emission running from the northwest to the southeast. The source is notably fainter than it appeared in 2000.
We limit detailed analysis to soft X-ray events in the 0.5–1.2 keV energy band. At lower energies, the detector efficiency, especially around the carbon K-edge at 0.28 keV, is significantly attenuated by a layer of molecular contamination that appears to be depositing on the instrument filter (Marshall et al., 2004; Chandra X-ray Center, 2010). At higher energies, the source fluxes become comparable to, or lower than, the background levels. The background-subtracted X-ray count rates were estimated to be 3.060.0710-2 and 5.680.3210-3 counts s-1 in 2000 and 2013, respectively, corresponding to a decline of 811%. Based on folding a model fit to the observed spectrum (see below) through the instrument effective areas in the two epochs, a drop of 70% in count rate is expected due to the decline in the detector efficiency at low energies. We attribute the difference between the observed and expected decline to the remnant development over the intervening 13.8 years, indicating an X-ray flux drop of 385%. No large differences in median photon energy or hardness ratio were found between 2000 and 2013 (see also Table 1 for details).
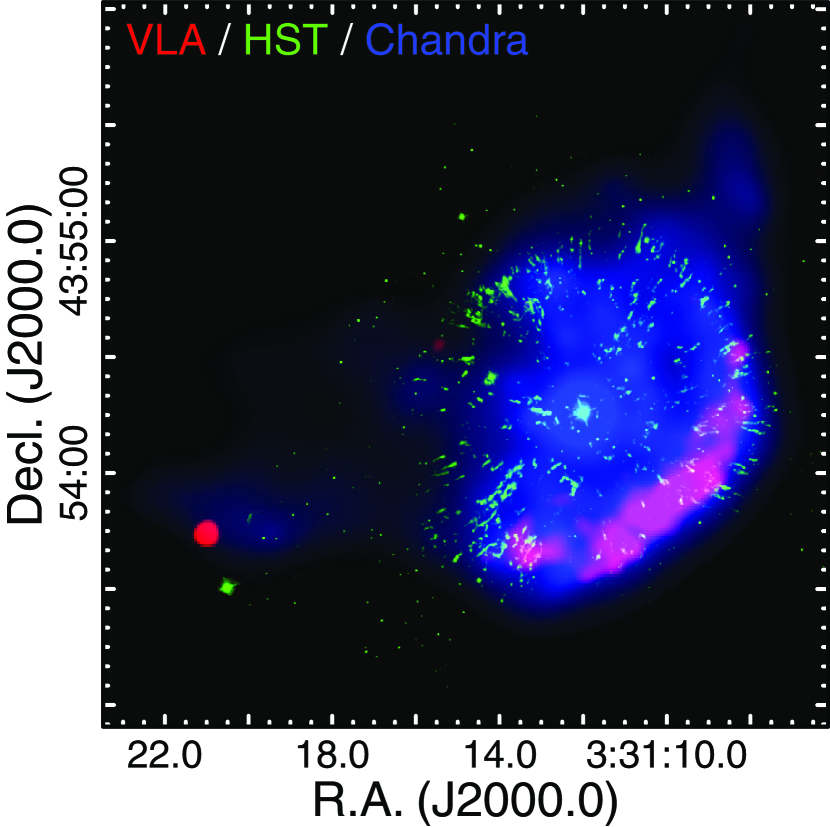
Figure 1 shows 0.5–1.2 keV photon-flux images obtained by Chandra ACIS-S3 in both 2000 and 2013 epochs. Exposure maps used for flat-field correction were computed at 0.6 keV, corresponding to the median detected photon energy, using the fluximage software in CIAO. A sliding cell search for source candidates (celldetect; Harnden et al. 1984) was performed, and astrometry was fixed by matching the observed X-ray positions of three point sources with Two-Micron All Sky Survey (2MASS; Cutri et al. 2003) catalogue positions of their infrared counterparts: J033112014354154 (i.e., the white dwarf binary of GK Per), J033122194356461, and J033108204357503. The celldetect position estimates have precisions better than 02, and the resulting relative astrometric precision between the two epochs based on the three reference sources remains at a similar level. The distribution of diffuse sources was determined from a Voronoi Tessellation and Percolation algorithm (vtpdetect; Ebeling & Wiedenmann 1993) applied to a combined exposure-corrected image in which the two observations in 2000 and 2013 were merged.
We then compared the Chandra X-ray data with the HST optical image and the Very Large Array (VLA) radio observations in Figure 2. The HST data were obtained from the Hubble Legacy Archive, and we retrieved the H[N II] image taken by the Wide Field and Planetary Camera 2 (WFPC2) in 1995 — see Shara et al. (2012) for further details. The VLA observations were discussed by e.g., Reynolds & Chevalier (1984b); Anupama & Kantharia (2005); Balman (2005), and the 1.45 GHz L-band image taken by the B-configuration in 1997 was obtained from the National Radio Astronomy Observatory VLA Archive Survey (NVAS) system (Crossley et al., 2008). We combined the data from the different wavelength regimes using the SAOImage DS9 image analysis tool (Joye, 2011), rendering radio, optical, and X-rays in red, green, and blue, respectively. The conspicuous coincidence of the radio and X-ray emission, concentrated at the bright rim to the southwest, was noted by Balman (2005), who also presented comparisons with optical image contours.
4.2. Limits on Hard X-ray Evolution
Unfortunately, our additional data provide no further insights into the non-thermal hard X-ray signatures reported by Balman (2005) because of the background contamination above about 1 keV. We investigated this non-thermal emission by first fitting the extracted spectra from both epochs in the 1.2–7.0 keV range using an absorbed power-law model and estimating the 1 statistical uncertainties in the power-law normalization. Using these, we calculated count rates in the 0.5–1.2 keV range by extrapolation. The fitted power-law slopes were approximately zero, and the resulting upper limits to the contribution of power-law component to the count rate are 10% and 23% for the first and second observations, respectively. The larger limit from the second epoch results from the larger uncertainty in the fitted slope for those data. However, it is unlikely that the harder component has increased in intensity or hardness while the rest of the remnant has faded significantly. To place a best estimate on the soft X-ray power-law emission contribution, we therefore imposed additional constraints of not allowing either the spectrum to get harder or the normalization to increase from the first epoch to the second. We introduced a lower limit to the power-law slope and an upper limit to the normalization corresponding to the 1 limits derived from the first observation and found a 1 limit of an 18% contribution due to the harder component, although the actual contribution is likely similar to the 10% one of the earlier epoch. Since the power-law spectrum would be essentially flat, it has little influence on the interpretation of the soft X-ray data and we disregard it in the remainder of the analysis.
4.3. Radial Profiles and Remnant Expansion
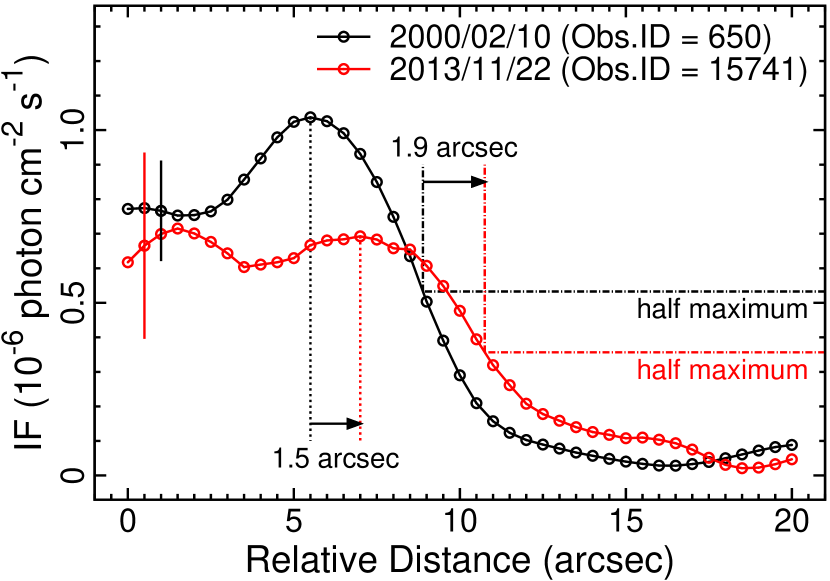
In order to examine the expansion of the remnant between the two Chandra observation epochs, the projected and summed profile of the bright southwest rim was analyzed. A rectangular extraction region was placed on top of, and tangential to, the rim (indicated by the red rectangles lying to the southwest in Figure 1), and X-ray events were extracted and summed in the tangential direction such that the resulting histogram shows the variation of integrated flux (IF) in an approximately radial direction from the nebula center.
Figure 3 illustrates the projection profiles of these brightest regions in the X-ray images of both epochs. Comparing the profiles at their peaks suggests an observed expansion of 15, while at half maxima linear interpolation indicates 19 in 13.8 years. These two estimates are significantly larger than any systematic error in the relative positional accuracy of the two observations. In the following, we adopt the measurement based on the half maxima for discussing the remnant expansion.
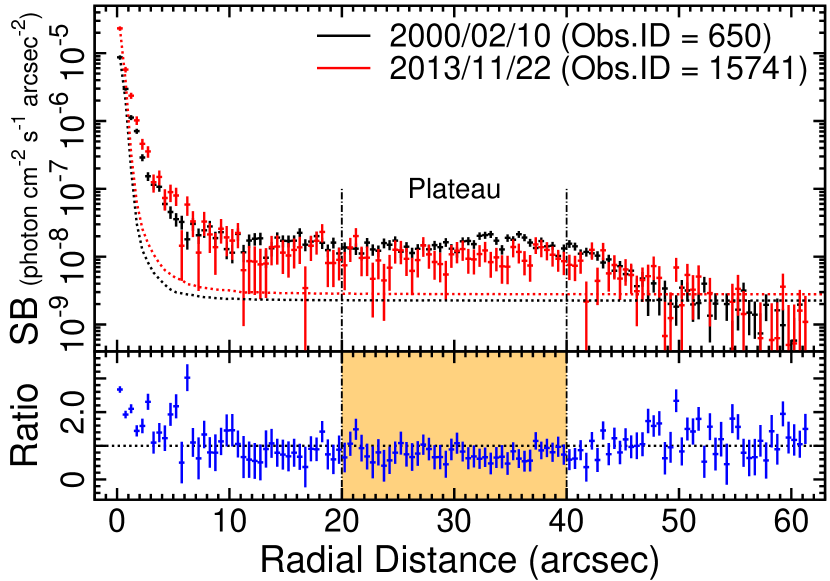
Radial surface brightness (SB) profiles derived by azimuthally summing the observed signal as a function of radial distance from the central binary position, with a 05 step size, are shown in Figure 4. Also shown is a 0.6 keV point spread function (PSF) calculated using the Chandra Ray Tracer tool (Carter et al., 2003). Comparison of the central source counts as a function of radius with the PSF prediction indicates the source is heavily piled up in the center. The excess counts over the PSF model out to about 10 are then expected to arise as a result of the PSF being normalized to the peak counts, although it is possible some of the excess could be extended emission from the remnant.
Plateaus in the SB 20–40 from the center indicate regions where the nebula emission clearly dominates any signal from the central source. Fitting a constant SB level to these segments of the radial profiles resulted in best fits of 1.480.0410-8 and 0.950.0610-8 photons cm-2 s-1 arcsec-2 in 2000 and 2013, respectively, corresponding to a decay of 366% in 13.8 years. The radial profiles decay to the background levels at distances of 50–60. Based on the radial profiles, the remnant signals for further spectral analysis were extracted from annular regions between 20–60, avoiding potential contamination from the PSF wings. Background events were accumulated from the 70–100 annular region, excluding the areas where diffuse emission was detected by the vtpdetect algorithm (see Figure 1 for details), and the background rate was computed by normalizing to the ratio of net source and background extraction regions.
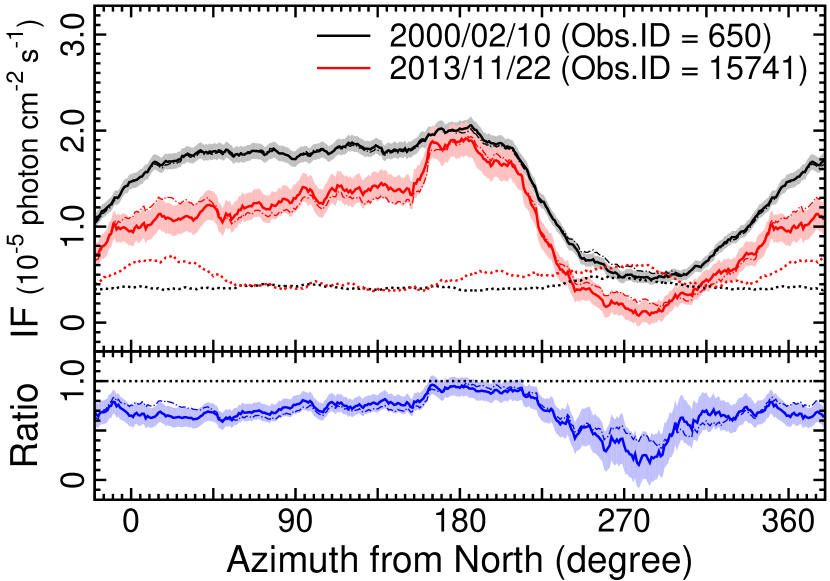
4.4. Azimuthal Dependence and Evolution
The azimuthal dependence of the nebular emission was investigated by assessing the source and background counts in 45 segments of their respective annular extraction regions and rotating these segments in the clockwise direction with a 1 step size. The resulting IFs as a function of azimuth computed using both the rotating background sector and just the average background in the annulus (again with diffuse emission excluded) are illustrated in Figure 5. The results reflect the “by-eye” assessment that the brightest part of the remnant is in the south and the faintest in the east. The ratios between 2000 and 2013 curves indicate that the flux decline is inversely related to X-ray brightness — fainter regions are getting more faint at a faster rate than brighter regions. A simple average of the IF ratios is about 70%, with a maximum ratio of 90% in the bright area to the south, and down to 20% to the northwest.
4.5. Spectral Analysis
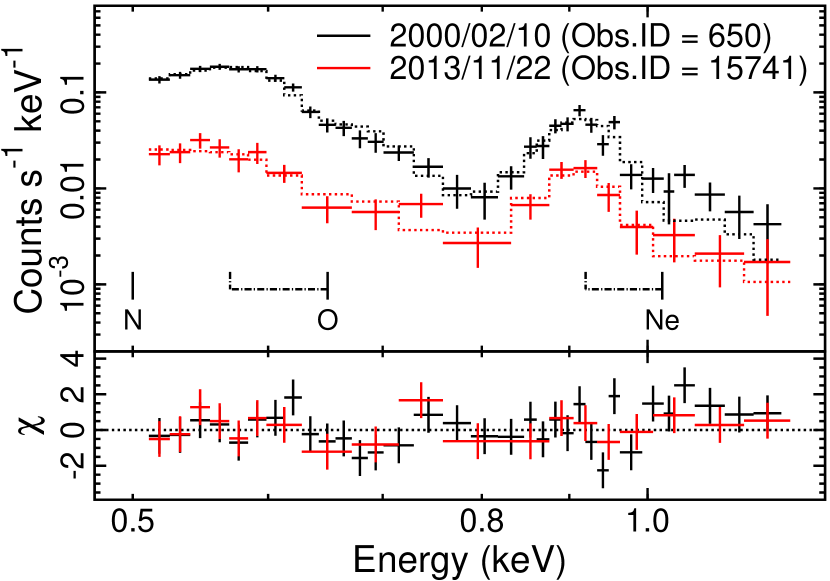
As no significant secular trends, except for background variations, were found in the light curves constructed from the background-subtracted remnant events, spectral analysis proceeded based on the whole of each data set. Background-subtracted X-ray spectra from both epochs are illustrated in Figure 6. Emission from Ne IX K was clearly present in both epochs, while O VII emission is also possibly discernible. We applied a fitting model comprising emission from a non-equilibrium ionization collision-dominated plasma plus photoelectric interstellar absorption (Tüebingen-Boulder absorption; Wilms et al. 2000) with a hydrogen-equivalent column density () fixed at 2.11021 cm-2. The absorption column was not well-constrained by the Chandra data and the latter was estimated from the H I maps of Kalberla et al. (2005) for a 1 cone radius around the GK Per position. Here we experimented first with allowing the plasma abundances of C, N, O, and Ne to vary from their solar values, as might be expected in the shell of a planetary nebula and also in the ejecta of a classical nova. As a result no significant constraint on the C abundance has been given from the spectral fitting. Regarding the N emission, the best-fits and 1 statistical errors suggest an abundance of 0.3–2.7 times the solar value. The reason for such poor constraints is that the energies of the K emission lines from those metals are slightly below the useful low energy cut-off of the X-ray spectra. We confirmed that varying the C and N abundances provides no significant difference on other parameters, and thus the elemental abundances of the emission component were fixed to be solar, except for O and Ne from which the energies of the K lines are in the range of the extracted spectra. For the final spectral fitting, the free parameters were then: (1) plasma temperature (), (2) elemental abundances of O () and Ne (), (3) the non-equilibrium plasma ionization timescale (), and (4) a volume emission measure (). The observed fluxes () and absorption-corrected luminosities () in the 0.5–1.2 keV energy band were also determined. The flux decay between the 2000 and 2013 epochs determined from these spectra amounts to 40%. The spectral properties and the best-fit parameters producing minima in the test statistic defined by Gehrels (1986) are summarized in Table 1. The results for the 2000 epoch are broadly consistent with the results of Balman (2005), and the fitted temperature for both epochs of 0.2 keV is similar to the 2106 K temperature derived from the 1992 ROSAT observation by Balman & Ögelman (1999). Independent spectral analysis of different regions of the nebular was investigated but not pursued due to insufficient signal-to-noise ratio.
5. Discussion
5.1. Energetics
We start with an overview of the energetics of the explosion that lead to the GK Per remnant. First, assuming the angular radius 1 corresponds to 0.14 pc at a distance of 470 pc, the upper limit to the remnant volume assuming a spherical shape is 3.41053 cm3. The geometry of the emission is instead presumably a thin shell with thickness , as expected for a compression ratio of 4 for a strong shock, which suggests a plasma emitting volume of 7.81052 cm3. Here, the observed volume emission measures, , where and are electron and ion number densities, respectively, are 1–21054 cm-3 at the distance 470 pc. The larger uncertainties on the fitted values result from degeneracy with the weakly-constrained Ne and O abundances. Further assuming solar abundances, the electron to ion ratio is 1.18, and so 4 cm-3, which corresponds to the pre-shock total number density of 1 cm-3. The swept-up mass is 210-4 , where is a hydrogen mass.
If the remnant is in an adiabatic stage (Seaquist et al., 1989a; Balman, 2005; Anupama & Kantharia, 2005), in which radiating energy loss is still negligible compared with the initial explosion, the plasma state can be compared with the Sedov-Taylor solution (Sedov, 1959) represented by the following three equations,
| (1) | |||||
| (2) | |||||
| (3) |
Here, the simultaneous equations consist of the six parameters: the radial distance to the outer shock , the blast-wave velocity , the shock temperature , the elapsed time , the total explosion energy , and the total number density . The velocity is 500 km s-1 with 1 and 112.8 years, and similarly the temperature is 1.810 0.28 keV. The radial distance is then 0.31 pc, which can be converted to the explosion energy 21045 ergs using 1 cm-3. This distance is fairly insensitive to the exact particle density assumed, The observed electron temperature of 0.2–0.3 keV is almost consistent with the Sedov-Taylor estimates, suggesting that the electrons and ions are near equilibration. All these estimates lie within typical ranges for nova explosions obtained from both observations and theory (e.g., Prialnik & Kovetz, 1995; Starrfield et al., 2009; Metzger et al., 2014).
5.2. Proper Motion
The observed expansion of the X-ray brightest part of the remnant in the 13.8 years separating the Chandra observations derived from the radial-profile comparisons is 19, corresponding to an expansion rate of 014 yr-1. Assuming a distance of 470 pc, the velocity of the outermost X-ray emitting region is 300 km s-1. This is slightly lower than that the 600–1000 km s-1 of optical knots moving in a similar direction (Shara et al., 2012; Liimets et al., 2012, see also Duerbeck 1987), as well as the Sedov-Taylor estimate of 500 km s-1. The velocity inconsistencies might imply that the shock speed was faster than the estimate from the apparent X-ray advance and that this measurement is not representative of the advance of the shock front itself. Further, as we discuss in Sect. 5.3, the expansion of the blast wave must have been non-uniform.
5.3. Cooling or Thinning?
The flux estimates based on radial profiles, the IF azimuthal dependence, and the spectral fitting all indicate that the 0.5–1.2 keV brightness has been reduced on average to 60–70% of its value in 13.8 years, corresponding to a decline rate of about 3% yr-1. This is very similar to the flux decay rate of the optical knots in the remnant of 2.6% yr-1 (Liimets et al., 2012), and to the annual secular decrease of 2.1% in the flux density at 1.4 and 4.9 GHz between 1984 and 1997 found by Anupama & Kantharia (2005). There is no obvious significant X-ray spectral evolution accompanying this decay, and all the fitted spectral model parameters for the two epochs were statistically consistent (see Table 1).
For an emitting plasma with cosmic abundances, the observed temperature of 0.2–0.3 keV implies a total cooling coefficient of order 10-22–10-23 erg cm3 s-1 (e.g., Gehrels & Williams 1993). Here, the dominant cooling occurs from the line emission of Fe (Boehringer & Hensler, 1989). Since the shocked circumstellar environment is likely to have a chemical composition more like that of typical planetary nebulae, the actual cooling coefficient could differ from this value — the tendency of the Fe depletion in galactic planetary nebulae (Delgado Inglada et al., 2009; Delgado-Inglada & Rodríguez, 2014) suggests that the plasma cooling becomes less effective also in the GK Per remnant. The cooling timescale is therefore orders of magnitude longer than the present lifetime of the remnant. As the temperature was almost constant during 2000–2013 as expected, the radiated energy integrated over 13.8 years is of order 1039–1041 ergs or lower. This strongly suggests that radiative cooling is negligible in comparison with the explosion energy of order 1045 ergs, and supports earlier conclusions that the remnant is in the adiabatic phase (Seaquist et al., 1989a; Anupama & Kantharia, 2005; Balman, 2005).
We thus conclude that the most plausible cause of the 30–40% decline in emission between 2000–2013 is not the plasma cooling but just the thinning and expansion of the emitting nebula. Assuming the blast velocity of 500 km s-1, the emitting volume increased 20% in 13.8 years. Were the blast wave expanding into a medium of uniform density, the increase in swept-up mass combined with an increase in the shocked gas volume in the expression for the emission measure, means the X-ray emission should increase with the cube of the remnant radius. In the Sedov phase, since , the emission measure should increase with time as . That this is definitely not the case indicates that the medium into which the GK Per remnant has been recently expanding must be non-uniform. Indeed, as discussed in Sect. 2, the complex non-uniform nature of the circumbinary medium of GK Per has been evident for more than a century. The observed decline in X-ray emission corresponds best to the case of negligible swept-up mass during 2000–2013 and therefore a number density at the shock front in the later epoch much lower than at earlier times. The later volume emission measure would then be about 80% of the 2000 value.
The inverse relation between the X-ray brightness and the decline rate found in the azimuthally-dependent data indicates that the currently fainter regions are fainter because they have dimmed more rapidly, and continue to do so. This is especially prominent to the east, at an azimuthal angle of around 270. These regions might be fading faster because they are expanding more rapidly, although the X-ray data are insufficient to test this.
Asymmetric expansion is not see in the optical knots (Liimets et al., 2012) which actually experienced a recent brightening in the east. Such divergent behaviors are not unrealistic since optical knots are probably dominated by shocked ejecta and we expect the X-ray emission to instead originate largely from the shocked medium. Comparison of the X-ray and optical emission in the multi-wavelength image in Figure 2 reveals that some optical knots precede the X-ray emitting shock front. Similar behavior has been seen in optical knots of the Cas A supernova remnant (Hammell & Fesen, 2008). The main shell of the brightest knots is quasi-spherical, and close inspection of the X-ray emission indicates that it is co-spatial with knots. This indicates that the knots are likely not the same material as the X-ray emitting plasma that has condensed and cooled, and is consistent with the knots being shocked ejecta (e.g., Bode et al., 2004; Liimets et al., 2012; Shara et al., 2012).
The most obvious departure of optical and X-ray morphology is in the X-ray “wings” pointing to the north and east that extend well beyond the optical knots. Balman (2005) noted that the expansion rate for these wing regions must be about 2600–2800 km s-1 — more than twice the rate of the optical knots and the bright emission in the southwest — and drew comparison to the “cone” of earlier ejected material proposed in the planetary nebula scenario by Seaquist et al. (1989a). The implication would be that we are still seeing largely the shocked medium, but that the density experienced by the blast in these wing directions up until encountering the denser material must have been much lower than in the southwest direction to permit the more rapid expansion.
6. Conclusions
Comparison of Chandra X-ray imaging spectroscopy observations of the remnant of the GK Per classical nova event of 1901 obtained in 2000 and 2013 has revealed the following results.
-
1.
The remnant faded significantly in the interval between the two observations, with a mean flux decline of 30–40%. The rate of fading is spatially dependent, with more rapid fading generally coinciding with regions of lower surface brightness.
-
2.
Comparison of X-ray and optical data confirms qualitatively the very different morphology of cool knots and hot gas. The highly asymmetric X-ray remnant contrasts with a quasi-spherical shell of complex knots. Some optical knots appear to be slightly ahead of the X-ray emitting shock front, and also appear X-ray dark.
-
3.
The expansion of the remnant deduced from the difference in the bright rim of X-ray mission to the southwest in the two different epochs is 19, or an expansion rate of 014 yr-1. This corresponds to velocity of approximately 300 km s-1 for a distance to GK Per of 470 pc.
-
4.
Assuming the X-ray emission arises from a relatively thin shell of shocked plasma, the swept-up mass is approximately 210-4 and the ion density is 4 cm-3. A Sedov-Taylor solution yields an explosion energy of 21045 ergs, and electrons and ions are close to temperature equilibration.
-
5.
Since the radiative cooling time of the shock-heated gas is much longer than the age of the remnant, we conclude that the X-ray fading is a result of adiabatic expansion at a rate of about 3% per year in the southwest rim. The more drastic fading in regions of low surface brightness, such as in the east of the remnant, is then expected to be caused by more rapid expansion into a lower-density medium.
-
6.
The general evolution of the remnant is qualitatively consistent with expectations based on early post-explosion photographs of pre-existing nebulosity, with a highly-structured and inhomogeneous shell-like morphology. The fading observed between 2000 and 2013 is then caused by the recent expansion of the remnant into regions of much lower density. This is consistent with a planetary nebula origin for the pre-blast circumstellar material illuminated by light echoes from the explosion itself.
References
- Anupama & Kantharia (2005) Anupama, G. C. & Kantharia, N. G. 2005, A&A, 435, 167
- Anupama & Prabhu (1993) Anupama, G. C. & Prabhu, T. P. 1993, MNRAS, 263, 335
- Balman (2005) Balman, Ş. 2005, ApJ, 627, 933
- Balman & Ögelman (1999) Balman, Ş. & Ögelman, H. B. 1999, ApJ, 518, L111
- Bode et al. (2004) Bode, M. F., O’Brien, T. J., & Simpson, M. 2004, ApJ, 600, L63
- Bode et al. (1987) Bode, M. F., Roberts, J. A., Whittet, D. C. B., Seaquist, E. R., & Frail, D. A. 1987, Nature, 329, 519
- Boehringer & Hensler (1989) Boehringer, H. & Hensler, G. 1989, A&A, 215, 147
- Carter et al. (2003) Carter, C., Karovska, M., Jerius, D., Glotfelty, K., & Beikman, S. 2003, in Astronomical Society of the Pacific Conference Series, Vol. 295, Astronomical Data Analysis Software and Systems XII, ed. H. E. Payne, R. I. Jedrzejewski, & R. N. Hook, 477
- Chandra X-ray Center (2010) Chandra X-ray Center. 2010, Chandra Technical Information
- Crossley et al. (2008) Crossley, J. H., Sjouwerman, L. O., Fomalont, E. B., & Radziwill, N. M. 2008, in Society of Photo-Optical Instrumentation Engineers (SPIE) Conference Series, Vol. 7016, Society of Photo-Optical Instrumentation Engineers (SPIE) Conference Series, 0
- Cutri et al. (2003) Cutri, R. M., Skrutskie, M. F., van Dyk, S., et al. 2003, VizieR Online Data Catalog, 2246, 0
- Delgado-Inglada & Rodríguez (2014) Delgado-Inglada, G. & Rodríguez, M. 2014, ApJ, 784, 173
- Delgado Inglada et al. (2009) Delgado Inglada, G., Rodríguez, M., Mampaso, A., & Viironen, K. 2009, ApJ, 694, 1335
- Duerbeck (1987) Duerbeck, H. W. 1987, Ap&SS, 131, 461
- Ebeling & Wiedenmann (1993) Ebeling, H. & Wiedenmann, G. 1993, Phys. Rev. E, 47, 704
- Fesen et al. (2006) Fesen, R. A., Hammell, M. C., Morse, J., et al. 2006, ApJ, 645, 283
- Fruscione et al. (2006) Fruscione, A., McDowell, J. C., Allen, G. E., et al. 2006, in SPIE Conference Series, Vol. 6270, SPIE Conference Series
- Gehrels (1986) Gehrels, N. 1986, ApJ, 303, 336
- Gehrels & Williams (1993) Gehrels, N. & Williams, E. D. 1993, ApJ, 418, L25
- Hammell & Fesen (2008) Hammell, M. C. & Fesen, R. A. 2008, ApJS, 179, 195
- Harnden et al. (1984) Harnden, Jr., F. R., Fabricant, D. G., Harris, D. E., & Schwarz, J. 1984, SAO Special Report, 393
- Joye (2011) Joye, W. 2011, in Astronomical Society of the Pacific Conference Series, Vol. 442, Astronomical Data Analysis Software and Systems XX, ed. I. N. Evans, A. Accomazzi, D. J. Mink, & A. H. Rots, 633
- Kalberla et al. (2005) Kalberla, P. M. W., Burton, W. B., Hartmann, D., et al. 2005, A&A, 440, 775
- Katsuda et al. (2013) Katsuda, S., Long, K. S., Petre, R., et al. 2013, ApJ, 763, 85
- Lawrence et al. (1995) Lawrence, S. S., MacAlpine, G. M., Uomoto, A., et al. 1995, AJ, 109, 2635
- Liimets et al. (2012) Liimets, T., Corradi, R. L. M., Santander-García, M., et al. 2012, ApJ, 761, 34
- Marshall et al. (2004) Marshall, H. L., Tennant, A., Grant, C. E., et al. 2004, in Society of Photo-Optical Instrumentation Engineers (SPIE) Conference Series, Vol. 5165, X-Ray and Gamma-Ray Instrumentation for Astronomy XIII, ed. K. A. Flanagan & O. H. W. Siegmund, 497–508
- McLaughlin (1960) McLaughlin, D. B. 1960, in Stellar Atmospheres, ed. J. L. Greenstein, 585
- Metzger et al. (2014) Metzger, B. D., Hascoët, R., Vurm, I., et al. 2014, MNRAS, 442, 713
- Patnaude & Fesen (2009) Patnaude, D. J. & Fesen, R. A. 2009, ApJ, 697, 535
- Perrine (1902) Perrine, C. D. 1902, PASP, 14, 151
- Prialnik & Kovetz (1995) Prialnik, D. & Kovetz, A. 1995, ApJ, 445, 789
- Reynolds & Chevalier (1984a) Reynolds, S. P. & Chevalier, R. A. 1984a, ApJ, 281, L33
- Reynolds & Chevalier (1984b) Reynolds, S. P. & Chevalier, R. A. 1984b, ApJ, 281, L33
- Ritchey (1902) Ritchey, G. W. 1902, ApJ, 15, 129
- Schaefer (1988) Schaefer, B. E. 1988, ApJ, 327, 347
- Seaquist et al. (1989a) Seaquist, E. R., Bode, M. F., Frail, D. A., et al. 1989a, ApJ, 344, 805
- Seaquist et al. (1989b) Seaquist, E. R., Bode, M. F., Frail, D. A., et al. 1989b, ApJ, 344, 805
- Sedov (1959) Sedov, L. I. 1959, Similarity and Dimensional Methods in Mechanics
- Shara et al. (2012) Shara, M. M., Zurek, D., De Marco, O., et al. 2012, AJ, 143, 143
- Slane et al. (1999) Slane, P., Gaensler, B. M., Dame, T. M., et al. 1999, ApJ, 525, 357
- Slavin et al. (1995) Slavin, A. J., O’Brien, T. J., & Dunlop, J. S. 1995, MNRAS, 276, 353
- Starrfield et al. (2009) Starrfield, S., Iliadis, C., Hix, W. R., Timmes, F. X., & Sparks, W. M. 2009, ApJ, 692, 1532
- Uchiyama et al. (2007) Uchiyama, Y., Aharonian, F. A., Tanaka, T., Takahashi, T., & Maeda, Y. 2007, Nature, 449, 576
- Williams (1901) Williams, A. S. 1901, MNRAS, 61, 337
- Wilms et al. (2000) Wilms, J., Allen, A., & McCray, R. 2000, ApJ, 542, 914
- Yamaguchi et al. (2009) Yamaguchi, H., Ozawa, M., Koyama, K., et al. 2009, ApJ, 705, L6