Van der Waals density-functional theory study for bulk solids with BCC, FCC, and diamond structures
Abstract
Proper inclusion of van der Waals (vdW) interactions in theoretical simulations based on standard density functional theory (DFT) is crucial to describe the physics and chemistry of systems such as organic and layered materials. Many encouraging approaches have been proposed to combine vdW interactions with standard approximate DFT calculations. Despite many vdW studies, there is no consensus on the reliability of vdW methods. To help further development of vdW methods, we have assessed various vdW functionals through the calculation of structural properties at equilibrium, such as lattice constants, bulk moduli, and cohesive energies, for bulk solids, including alkali, alkali-earth, and transition metals, with BCC, FCC, and diamond structures as the ground state structure. These results provide important information for the vdW-related materials research, which is essential for designing and optimizing materials systems for desired physical and chemical properties.
keywords:
Van der Waals interactions , Density functional theory , Bulk solids , Lattice constant , Bulk modulus , Cohesive energy1 Introduction
The development of approximate density functional theory (DFT) [1, 2] methods that are able to account for van der Waals (vdW) interactions has attracted a great deal of interest due to its importance in the theoretical description of organic or layered materials as well as that of physical, chemical, and biological processes [3, 4, 5, 6, 7, 8, 9]. Many encouraging schemes and algorithms have been proposed to include vdW interactions in theoretical simulations based on standard DFT. One of the promising vdW approaches is the vdW density functional (vdW-DF) method, which does not depend on external input parameters and is based directly on the electron density [10]. In the vdW-DF method, the exchange-correlation (XC) energy is given as
| (1) |
where is the generalized gradient approximation (GGA) to the exchange energy, is the local density approximation (LDA) to the correlation energy, and is the nonlocal electron correlation energy. In the case of the vdW-DF approach, the computational time increases by 50% compared to standard DFT calculations such as the LDA and the GGA calculations [11]. Depending on the selection of the exchange functional, there are many vdW-DF methods. Here we consider the five vdW-DF functionals; revPBE-vdW [10], rPW86-vdW2 [12, 13], optPBE-vdW [14], optB88-vdW [14], and optB86b-vdW [15]. In addition, there is another widely used vdW approach, the so-called dispersion-corrected DFT-D in which an atom-pairwise potential is added to a standard DFT result. In the original DFT-D scheme [16], the predetermined constant dispersion coefficients are assigned to an element irrespective of its environment. To improve this, the dispersion coefficients are further modified to vary with the environment of an element. In contrast to the vdW-DF schemes, the DFT-D schemes do not add a significant computational cost compared to the standard DFT calculations. In the DFT-D schemes, we consider the five vdW functionals; DFT-D2 [17], DFT-D3 [18], DFT-D3(BJ) [19], DFT-TS [20], and DFT-TS-SCS [21, 22]. The environment-dependent DFT-D3 scheme has zero damping for small interatomic distances, whereas the DFT-D3(BJ) scheme has rational damping to finite values (BJ-damping) as Becke and Johnson proposed. Grimme et al. suggested that the DFT-D3(BJ) performed slightly better than the DFT-D3 for noncovalently-bonded materials systems [19]. In the DFT-TS scheme, the dispersion coefficients are determined by employing the partitioning of the electron density [20]. The DFT-TS scheme can be further modified by incorporating self-consistent long-range screening effects [21, 22]. This modified scheme is herein called the DFT-TS-SCS functional. Tkatchenko et al. report that the DFT-TS-SCS functional performs better than the DFT-TS functional [21, 22]. However, despite many vdW studies, the assessment of the performance of the vdW functionals on a broad range of material systems is lacking.
In the present work, we have investigated structural properties (lattice constants, bulk moduli, and cohesive energies) at equilibrium for bulk solids with body centered cubic (BCC), face centered cubic (FCC), and diamond (DIA) structures, to assess the performance of various vdW functionals based on the DFT. We herein consider the ten vdW functionals implemented in the Vienna Ab-initio Simulation Package (VASP) code [23, 24, 25, 26]; revPBE-vdW, rPW86-vdW2, optPBE-vdW, optB88-vdW, optB86b-vdW, DFT-D2, DFT-D3, DFT-D3(BJ), DFT-TS, and DFT-TS-SCS functionals. For comparison, the LDA and GGA calculations were also performed. Our calculations show that the five vdW functionals of optB86b-vdW, optB88-vdW, optPBE-vdW, DFT-D3, and DFT-D3(BJ) give better performance compared to the other vdW functionals. Differences among the results from the five vdW functionals are also discussed. These results provide important information for further development of vdW methods to improve the description of a wide range of materials systems.
2 Computation method
We employed the VASP code to perform the DFT calculations, including spin effects for magnetic elements, with various vdW functionals [23, 24, 25, 26]. In this work, we considered ten vdW functionals implemented in the VASP; revPBE-vdW [10], rPW86-vdW2 [12, 13], optPBE-vdW [14], optB88-vdW [14], optB86b-vdW [15], DFT-D2 [17], DFT-D3 [18], DFT-D3(BJ) of Becke-Jonson [19], DFT-TS [20], and DFT-TS-SCS [21, 22]. For comparison, LDA and GGA calculations were also performed using the Ceperley-Alder [27] and the Perdew-Burke-Ernzerhof (PBE) [28] expressions, respectively, for the exchange-correlation functional. In the case of the DFT-D schemes [DFT-D2, DFT-D3, DFT-D3(BJ), DFT-TS, and DFT-TS-SCS], we used the PBE parameterization of the GGA for the exchange-correlational functional. For electron-ion interactions, the projector augmented-wave (PAW) method [29, 30] was used. We considered 29 elements with BCC, FCC, and diamond structures as the ground state in the bulk phase. In the calculations, the electronic wave functions were expanded by plane waves with an energy cutoff of 700 eV. The k-space integration was performed using a -centered 121212 mesh in the Brillouin zone (BZ) of the primitive cell. The tetrahedron method with Blöchl corrections [31, 32] was used to improve the computational convergence. We performed total energy calculations to obtain the ground state properties such as the equilibrium lattice constant, the bulk modulus, and the cohesive (atomization) energy. The ground state properties were determined by fitting the calculated total energy as a function of the volume to the Birch-Murnaghan equation of state [33, 34, 35]. In the fitting, a set of eleven different volumes around the experimental equilibrium volume corresponding to the equilibrium lattice constant was used.
3 Results and discussion
3.1 Lattice constant
Solid Crystal revPBE rPW86 optB86b optB88 optPBE DFT DFT DFT DFT DFT PAW PAW Expt. structure vdW vdW2 vdW vdW vdW D2 D3 D3(BJ) TS TS-SCS LDA GGA Li BCC 3.453 3.393 3.457 3.435 3.442 3.270 3.374 3.329 2.607 3.122 3.367 3.439 3.449∗ C DIA 3.599 3.605 3.570 3.575 3.584 3.564 3.565 3.558 3.553 3.564 3.535 3.573 3.543∗ Na BCC 4.214 4.135 4.176 4.152 4.178 3.980 4.161 4.078 4.131 3.852 4.055 4.193 4.210∗ Al FCC 4.084 4.087 4.034 4.054 4.058 4.010 4.007 3.982 3.921 4.002 3.984 4.040 4.020∗ Si DIA 5.513 5.540 5.456 5.469 5.484 5.412 5.453 5.420 5.446 5.438 5.403 5.469 5.416∗ K BCC 5.289 5.174 5.198 5.162 5.222 5.156 5.226 5.163 4.345 4.943 5.043 5.284 5.212∗ Ca FCC 5.553 5.493 5.464 5.450 5.501 5.381 5.498 5.441 5.169 5.301 5.338 5.532 5.553∗ V BCC 3.007 3.026 2.958 2.969 2.982 2.970 2.938 2.932 2.917 2.954 2.912 2.978 3.030 Cr BCC 2.866 2.887 2.821 2.833 2.843 2.815 2.809 2.809 2.770 2.808 2.779 2.836 2.880 Fe BCC 2.873 2.889 2.806 2.821 2.838 2.802 2.805 2.806 2.779 2.812 2.749 2.832 2.870 Ni FCC 3.572 3.609 3.488 3.511 3.529 3.459 3.476 3.477 3.424 3.489 3.422 3.518 3.520 Cu FCC 3.705 3.750 3.601 3.629 3.651 3.571 3.568 3.568 3.547 3.607 3.524 3.635 3.595∗ Ge DIA 5.895 5.973 5.764 5.798 5.828 5.666 5.760 5.723 5.749 5.730 5.647 5.783 5.640∗ Rb BCC 5.666 5.545 5.535 5.501 5.578 5.443 5.615 5.551 5.666 5.666 5.374 5.668 5.576∗ Sr FCC 6.057 6.004 5.921 5.911 5.980 5.760 5.985 5.924 6.306 5.731 5.788 6.026 6.045∗ Nb BCC 3.340 3.377 3.288 3.303 3.314 3.308 3.265 3.264 3.214 3.269 3.247 3.308 3.300 Mo BCC 3.183 3.219 3.139 3.154 3.161 3.145 3.124 3.122 3.084 3.123 3.106 3.151 3.150 Rh FCC 3.879 3.942 3.803 3.829 3.841 3.773 3.786 3.788 3.767 3.806 3.752 3.824 3.793∗ Pd FCC 4.012 4.083 3.905 3.938 3.957 3.888 3.886 3.889 3.912 3.921 3.841 3.942 3.875∗ Ag FCC 4.242 4.313 4.091 4.130 4.163 4.131 4.073 4.072 4.068 4.117 4.003 4.147 4.056∗ Sn DIA 6.764 6.876 6.593 6.637 6.677 6.505 6.612 6.571 6.538 6.577 6.478 6.652 6.490 Cs BCC 6.134 5.989 5.942 5.899 6.014 4.235 6.111 6.039 4.382 5.809 5.760 6.161 6.039∗ Ba BCC 5.073 5.057 4.904 4.915 4.986 4.203 4.974 4.935 5.021 4.724 4.768 5.030 4.995∗ Ta BCC 3.340 3.375 3.292 3.306 3.317 3.260 3.273 3.276 3.235 3.281 3.248 3.309 3.300 W BCC 3.203 3.239 3.163 3.178 3.184 3.106 3.147 3.148 3.123 3.154 3.129 3.172 3.160 Ir FCC 3.923 3.986 3.861 3.886 3.892 3.767 3.838 3.843 3.844 3.862 3.819 3.873 3.840 Pt FCC 4.032 4.110 3.949 3.980 3.990 3.839 3.918 3.926 3.934 3.952 3.897 3.968 3.920 Au FCC 4.245 4.338 4.122 4.161 4.181 3.996 4.099 4.101 4.113 4.134 4.052 4.157 4.080 Pb FCC 5.134 5.233 4.972 5.018 5.053 5.072 4.971 4.948 4.949 4.997 4.875 5.031 4.902∗
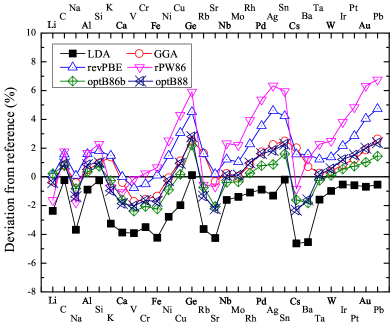
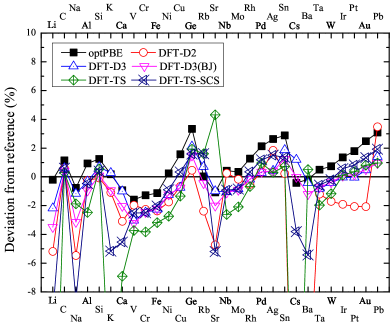
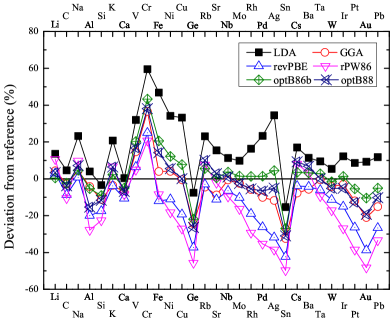
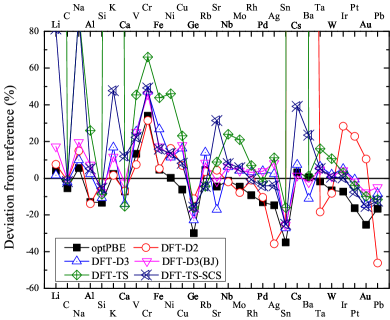
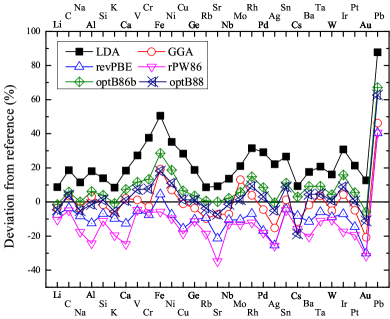
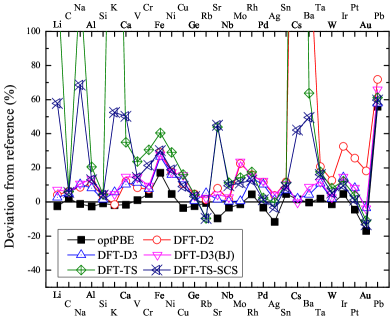
The equilibrium lattice constants calculated with the ten vdW functionals are summarized in Table 1, and the relative errors in the equilibrium lattice constants with respect to the experimental values are shown in Fig. 1. For comparison, we also present the results of the standard DFT functionals of LDA and GGA. The standard GGA functional gives the relative errors in the range of , while the standard DFT functional of LDA shows shorter equilibrium lattice constants than those from the other functionals, indicating the well known overbinding of atoms in the LDA approach [38, 39]. In the case of the vdW functionals, optB86b-vdW, optB88-vdW, optPBE-vdW, and DFT-D3 show the relative errors in the range of . The DFT-D3(BJ) functional shows the relative errors in the range from to for all elements except for Li. The DFT-TS and DFT-TS-SCS functionals give results comparable to the other vdW functionals, except for the alkali (Li, Na, K, Cs) and alkali-earth (Ca, Sr, Ba) metals. For these two vdW functionals, the DFT-TS-SCS scheme with the self-consistent screening (SCS) effects shows better performance than the DFT-TS scheme without the SCS effects [21, 22]. In the case of revPBE-vdW and rPW86-vdW2, the relative errors range from to . The relative errors are observed to be more scattered compared to those from the vdW functionals of optPBE-vdW, optB88-vdW, optB86b-vdW, DFT-D3, and DFT-D3(BJ). This behavior becomes more significant with the increase of the atomic number.
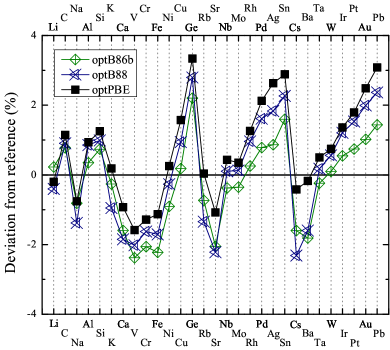
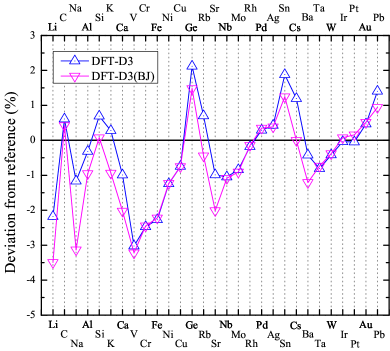
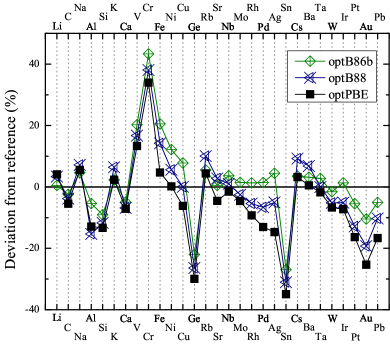
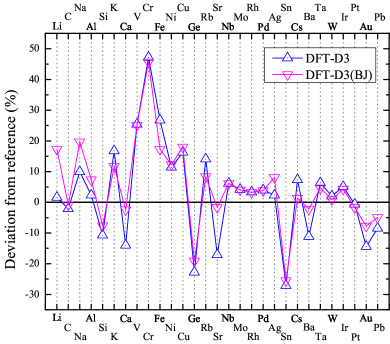
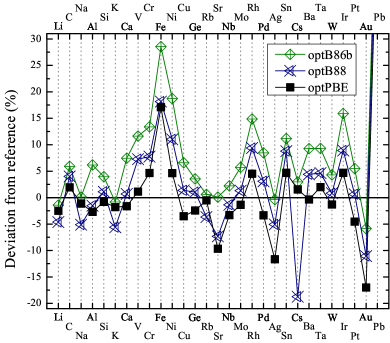
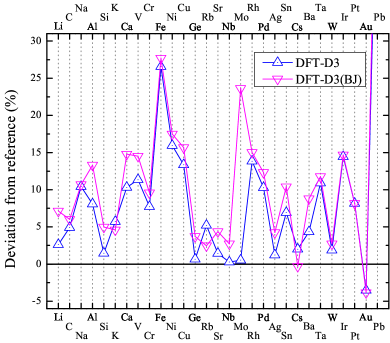
To further aid our understanding, we discuss the differences among the five vdW results of optPBE-vdW, optB88-vdW, optB86b-vdW, DFT-D3, and DFT-D3(BJ). In the case of DFT-D3, and DFT-D3(BJ), Grimme et al. [19] reported that the DFT-D3(BJ) vdW functional with rational damping to finite values for small interatomic distances performed slightly better than the DFT-D3 functional with zero damping when used for noncovalently-bonded systems. Our calculations show that both schemes give very similar results (see Fig. 2). For alkali and alkali-earth metals, however, the DFT-D3 functional gives much better performance than the DFT-D3(BJ) functional (see Fig. 2). In the case of the vdW-DF functionals of optPBE-vdW, optB88-vdW, and optB86b-vdW, the optB86b-vdW functional gives either better or comparable performance in equilibrium lattice constants compared to the optPBE-vdW and optB88-vdW functionals (see Fig. 2).
3.2 Bulk modulus
Solid Crystal revPBE rPW86 optB86b optB88 optPBE DFT DFT DFT DFT DFT PAW PAW Expt. structure vdW vdW2 vdW vdW vdW D2 D3 D3(BJ) TS TS-SCS LDA GGA Li BCC 13.694 14.724 13.365 13.748 13.845 14.315 13.513 15.596 187.631 24.117 15.108 13.885 13.3∗ C DIA 404.522 396.193 432.393 426.121 418.944 437.501 433.770 439.529 439.442 434.991 463.489 430.649 443.0 Na BCC 7.558 8.230 7.845 8.039 7.917 8.621 8.244 8.975 14.229 14.219 9.240 7.826 7.5∗ Al FCC 63.500 57.305 75.135 67.233 69.153 68.368 81.233 85.247 100.028 83.527 82.568 76.049 79.4∗ Si DIA 81.566 76.461 89.842 87.250 85.647 96.468 88.212 91.276 90.158 93.356 95.410 87.711 98.8 K BCC 3.558 3.947 3.784 3.936 3.787 3.761 4.320 4.132 70.613 5.463 4.470 3.567 3.7∗ Ca FCC 16.444 16.833 17.489 17.138 17.098 17.105 15.826 17.963 15.586 20.594 18.463 17.086 18.4∗ V BCC 172.466 169.806 194.718 188.971 183.512 173.953 203.049 202.604 235.407 198.016 213.713 185.675 161.9 Cr BCC 237.579 229.519 272.448 262.464 254.717 249.959 279.851 277.020 315.618 283.531 303.323 259.661 190.1 Fe BCC 147.968 154.123 202.889 192.267 176.236 177.166 213.305 197.352 242.121 194.995 247.046 174.999 168.3 Ni FCC 165.299 152.039 208.651 196.380 186.375 216.252 207.194 208.723 271.665 211.216 249.627 193.570 186.0 Cu FCC 110.545 99.879 147.659 137.055 128.539 146.506 159.282 161.663 168.634 148.152 182.498 136.340 137.0 Ge DIA 48.428 41.953 60.226 56.816 54.096 68.543 59.596 62.472 64.857 65.049 71.363 58.379 77.2 Rb BCC 2.812 3.119 3.060 3.192 3.028 3.004 3.308 3.143 2.772 2.772 3.570 2.770 2.9∗ Sr FCC 11.014 12.123 12.461 12.744 11.840 12.945 10.281 12.195 13.501 16.295 14.315 11.312 12.4∗ Nb BCC 159.232 153.666 176.423 171.920 167.693 166.781 180.698 180.745 210.983 183.804 189.481 169.206 170.2 Mo BCC 244.495 227.582 276.592 265.651 259.989 251.293 283.879 283.494 329.543 288.041 299.116 265.888 272.5 Rh FCC 219.171 191.033 273.980 255.757 245.384 267.614 279.428 279.135 289.154 268.524 314.511 254.550 270.4 Pd FCC 133.434 116.972 183.377 168.781 157.180 162.033 187.936 187.733 177.399 173.192 222.962 162.581 180.8 Ag FCC 68.730 61.864 105.174 95.643 85.884 64.765 103.017 108.873 111.938 96.729 135.435 88.903 100.7 Sn DIA 30.578 26.675 38.707 36.573 34.487 39.692 38.626 39.488 44.543 39.704 44.872 35.827 53.0 Cs BCC 2.019 2.268 2.173 2.294 2.167 79.424 2.254 2.128 82.969 2.921 2.458 1.937 2.1∗ Ba BCC 8.906 9.597 9.595 9.933 9.349 84.987 8.264 9.097 9.425 11.487 10.361 8.768 9.3∗ Ta BCC 187.810 181.116 205.534 199.998 196.462 163.345 212.634 209.379 232.166 210.435 218.981 198.963 200.0 W BCC 286.450 267.864 318.164 306.480 301.692 296.696 329.641 326.147 357.702 325.181 340.697 309.646 323.2 Ir FCC 301.726 259.177 359.776 336.899 329.294 455.665 373.098 370.375 365.836 355.695 398.543 344.228 355.0 Pt FCC 205.013 171.114 263.095 242.600 232.858 341.923 276.529 273.512 267.401 257.178 302.235 244.982 278.3 Au FCC 106.016 89.683 155.099 139.849 129.370 191.343 148.255 159.795 156.150 146.611 189.275 136.817 173.2 Pb FCC 34.303 31.164 44.442 41.991 39.015 25.185 42.843 44.497 41.383 40.978 52.294 39.735 46.8∗
The bulk moduli calculated with the ten vdW functionals are presented in Table 2, and the relative errors in the calculated bulk moduli with respect to the experimental values are shown in Fig. 3. In general, the trend of the bulk moduli is adequately reflected in the behavior of equilibrium lattice constants. Fig. 3 clearly shows that the smaller equilibrium lattice constants lead to larger values of bulk moduli. As expected in the calculated equilibrium lattice constants, the DFT-TS and DFT-TS-SCS vdW functionals show worse results for alkali metals (Li, Na, K, Cs), and the DFT-D2 functional gives a relative error even over 100% for Cs and Ba. In the case of the vdW-DF methods, for most of elements considered herein, the revPBE-vdW and rPW86-vdW2 give worse results than the other vdW-DF functionals (optB86b-vdW, optB88-vdW, and optPBE-vdW).
Next we discuss the differences among the five vdW results of optB86b-vdW, optB88-vdW, optPBE, DFT-D3, and DFT-D3(BJ). In the case of the DFT-D3 and DFT-D3(BJ) functionals, as expected from the calculated equilibrium lattice constants, the DFT-D3 functional shows either comparable or better results than the DFT-D3(BJ) functional (see Fig. 4). Better performance of DFT-D3 is observed for alkali and alkali-earth metals. In the case of the optB86b-vdW, optB88-vdW, and optPBE-vdW, the calculated results show very similar behavior, and the optB86b-vdW functional performs better for elements with large atomic number (see Fig. 4).
3.3 Cohesive energy
Solid Crystal revPBE rPW86 optB86b optB88 optPBE DFT DFT DFT DFT DFT PAW PAW Expt. structure vdW vdW2 vdW vdW vdW D2 D3 D3(BJ) TS TS-SCS LDA GGA Li BCC 1.540 1.490 1.640 1.586 1.622 1.732 1.707 1.782 3.873 2.625 1.808 1.605 1.663 C DIA 7.323 7.208 8.034 7.891 7.732 8.065 7.959 8.043 8.053 8.012 8.998 7.851 7.586 Na BCC 1.035 0.929 1.130 1.070 1.115 1.225 1.246 1.249 2.576 1.902 1.258 1.088 1.128 Al FCC 3.004 2.596 3.643 3.379 3.339 3.800 3.709 3.888 4.137 3.879 4.052 3.544 3.431 Si DIA 4.369 4.167 4.878 4.744 4.656 4.839 4.761 4.926 4.899 4.880 5.344 4.614 4.693 K BCC 0.851 0.758 0.935 0.890 0.926 0.929 0.997 0.986 4.196 1.438 1.022 0.869 0.943 Ca FCC 1.627 1.402 2.001 1.875 1.832 2.086 2.054 2.137 2.514 2.798 2.204 1.903 1.862 V BCC 5.075 5.094 5.969 5.736 5.407 5.795 5.954 6.123 6.613 6.113 6.809 5.413 5.347 Cr BCC 3.845 3.906 4.717 4.483 4.355 4.471 4.482 4.559 5.436 5.054 5.728 4.050 4.161 Fe BCC 4.521 4.074 5.560 5.111 5.065 5.585 5.474 5.524 6.075 5.628 6.511 5.161 4.326 Ni FCC 4.154 4.050 5.324 4.978 4.691 5.275 5.199 5.268 5.788 5.332 6.063 4.797 4.484 Cu FCC 2.975 2.868 3.755 3.572 3.399 3.901 3.994 4.075 4.092 3.840 4.521 3.485 3.523 Ge DIA 3.483 3.444 4.018 3.921 3.787 4.061 3.906 4.025 4.047 4.006 4.611 3.742 3.881 Rb BCC 0.778 0.698 0.862 0.826 0.853 0.868 0.902 0.879 0.775 0.775 0.931 0.774 0.857 Sr FCC 1.364 1.130 1.736 1.607 1.566 1.873 1.759 1.810 2.495 2.515 1.894 1.609 1.734 Nb BCC 6.797 6.613 7.767 7.494 7.345 7.697 7.617 7.804 8.458 8.322 8.636 7.056 7.597 Mo BCC 6.148 5.966 7.257 6.954 6.770 8.411 6.900 8.487 7.845 7.630 8.310 7.763 6.864 Rh FCC 5.400 5.093 6.657 6.341 6.057 6.720 6.598 6.667 6.818 6.528 7.622 6.021 5.797 Pd FCC 3.254 3.209 4.248 4.038 3.785 4.371 4.319 4.399 4.009 3.967 5.058 3.743 3.917 Ag FCC 2.216 2.206 2.960 2.821 2.625 3.084 3.008 3.098 2.966 2.876 3.631 2.519 2.972 Sn DIA 3.025 3.007 3.512 3.437 3.307 3.529 3.378 3.488 3.515 3.428 4.001 3.199 3.159 Cs BCC 0.743 0.679 0.832 0.656 0.820 4.009 0.824 0.805 5.375 1.148 0.883 0.715 0.808 Ba BCC 1.689 1.520 2.087 1.995 1.904 4.881 1.994 2.079 3.130 2.858 2.248 1.876 1.911 Ta BCC 7.645 7.220 8.878 8.499 8.285 9.809 9.008 9.080 9.562 9.424 9.807 8.411 8.123 W BCC 8.152 8.002 9.322 9.013 8.822 10.067 9.107 9.182 9.662 9.412 10.381 8.483 8.939 Ir FCC 6.489 5.767 8.091 7.602 7.309 9.257 7.990 8.006 7.838 7.639 9.132 7.282 6.981 Pt FCC 5.006 4.729 6.185 5.900 5.597 7.373 6.342 6.342 6.078 5.929 7.112 5.578 5.863 Au FCC 2.673 2.619 3.601 3.403 3.175 4.523 3.691 3.679 3.408 3.319 4.309 3.035 3.826 Pb FCC 2.866 2.868 3.410 3.319 3.180 3.507 3.219 3.384 3.288 3.259 3.831 2.984 2.040
The cohesive energies calculated with the ten vdW functionals are summarized in Table 3, and the relative errors in the cohesive energies with respect to the experimental values are presented in Fig. 5. The cohesive energies are calculated using the following equation:
| (2) |
where and are the total energy of the system for atoms in the primitive unit cell at equilibrium and an isolated (free) spin-polarized atom, respectively, and is the number of atoms in the primitive unit cell. The experimental cohesive energies were corrected by the zero-point vibration energy calculated using the Debye temperature , [37].
For Pb, the relative errors in the calculated cohesive energies are as large as over 40% for all the vdW functionals. In the case of the DFT-TS and DFT-TS-SCS functionals, poor performance is observed for alkali metals (Li, Na, K, Cs). The DFT-D2 functional shows poor performance for Cs and Ba. In the case of the vdW-DF functionals, the revPBE-vdW and rPW86-vdW2 functionals give lower cohesive energies than the other vdW-DF functionals.
Next we discuss the differences among the five vdW results of optB86b-vdW, optB88-vdW, optPBE, DFT-D3, and DFT-D3(BJ). The DFT-D3 functional shows either comparable or better performance compared to the DFT-D3(BJ) (see Fig. 6). In the case of the vdW-DF functionals, the optB86b-vdW, optB88-vdW, and optPBE-vdW functionals show very similar results, although the optB86b-vdW functional gives higher cohesive energies than the optB88-vdW and optPBE-vdW functionals (see Fig. 6).
4 Summary
In summary, we have investigated the lattice constants, the bulk moduli, and the cohesive energies for the bulk solids of 29 elements at equilibrium, using various vdW functionals based on the DFT in the VASP code. The assessed vdW functionals are classified into two groups. One is the vdW-DF functionals made by a proper choice of exchange functional, and the other is the vdW functionals of a dispersion-corrected DFT-D approach in which an atom-pairwise potential is added to a standard DFT result. The DFT-TS and DFT-TS-SCS functionals showed relatively poor performance for alkali and alkali-earth metals. Note that in the case of the DFT-TS and DFT-TS-SCS functionals, effective atomic volumes are used to calculate the dispersion coefficients. For the calculations, the partitioning of the electron density for each atom in a molecule or solid is performed and its result is then used to scale the dispersion coefficient with reference to the corresponding value for a free atom. Our calculations suggest that the partitioning of the electron density for effective atomic volumes may not be sufficiently accurate for delocalized alkali and alkali-earth metals. We obtained a general trend that the vdW functionals (optB86b-vdW, optB88-vdW, and optPBE-vdW) with optimized exchange functionals and the DFT-D vdW functionals [DFT-D3 and DFT-D3(BJ)] give better results than the original revPBE-vdW and rPW86-vdW2 functionals. To further aid in our understanding, we also discussed the differences among the vdW results of optB86b-vdW, optB88-vdW, optPBE-vdW, DFT-D3, and DFT-D3(BJ). These five vdW functionals showed very similar results. The DFT-D3 functional with zero damping gave either comparable or better performance compared to the DFT-D3(BJ) with damping. In the case of the vdW functionals with optimized exchange functionals, the optB86b-vdW showed slightly better performance in the equilibrium lattice constants and the bulk moduli compared to the other vdW functionals of optB88-vdW and optPBE-vdW. For the cohesive energies, the vdW functionals of optB86b-vdW, optB88-vdW, and optPBE-vdW functionals showed very similar results with smaller variation compared to the original vdW-DF methods of revPBE-vdW and rPW86-vdW2 and the standard LDA method. The results we present in this study provide fundamental information on how the various vdW functionals perform for the selected solid elements, including alkali, alkali-earth, and transition metals, with BCC, FCC, and diamond structures as the ground state structure.
5 Acknowledgments
This research was supported by Nano Material Technology Development Program (2012M3A7B4049888) through the National Research Foundation of Korea (NRF) funded by the Ministry of Science, ICT and Future Planning (MSIP), and Priority Research Center Program (2010-0020207) through NRF funded by the Ministry of Education (MOE). Calculations were performed by using the supercomputing resources (KSC-2014-C1-002) of the Korea Institute of Science and Technology Information (KISTI) and Korea Research Environment Open NETwork (KREONET), and the Partnership & Leadership for the nationwide Supercomputing Infrastructure (PLSI).
References
- [1] P. Hohenberg, W. Kohn, Inhomogeneous electron gas, Phys. Rev. 136 (1964) B864–B871. doi:10.1103/PhysRev.136.B864.
- [2] W. Kohn, L. J. Sham, Self-consistent equations including exchange and correlation effects, Phys. Rev. 140 (1965) A1133–A1138. doi:10.1103/PhysRev.140.A1133.
- [3] S. V. Aradhya, M. Frei, M. S. Hybertsen, L. Venkataraman, Van der waals interactions at metal/organic interfaces at the single-molecule level, Nature Mater. 11 (2012) 872–876. doi:10.1038/nmat3403.
- [4] T. Björkman, Testing several recent van der waals density functionals for layered structures, J. Chem. Phys. 141 (2014) 074708. doi:10.1063/1.4893329.
- [5] T. Buc̆ko, J. Hafner, S. Lebègue, J. G. Ángyán, Improved description of the structure of molecular and layered crystals: Ab initio dft calculations with van der waals corrections, J. Phys. Chem. A 114 (43) (2010) 11814–11824. doi:10.1021/jp106469x.
- [6] J. Park, B. D. Yu, S. Hong, Ab initio calculations with van der waals corrections: Benzene-benzene intermolecular case and graphite, J. Korean Phys. Soc. 59 (2011) 196–199. doi:10.3938/jkps.59.196.
- [7] H. Kim, Effect of van der waals interaction on the structural and cohesive properties of black phosphorus, J. Korean Phys. Soc. 64 (2014) 547–553. doi:10.3938/jkps.64.547.
- [8] L. Schimka, R. Gaudoin, J. Klimeš, M. Marsman, G. Kresse, Lattice constants and cohesive energies of alkali, alkaline-earth, and transition metals: Random phase approximation and density functional theory results, Phys. Rev. B 87 (2013) 214102. doi:10.1103/PhysRevB.87.214102.
- [9] P. Haas, F. Tran, P. Blaha, Calculation of the lattice constant of solids with semilocal functionals, Phys. Rev. B 79 (2009) 085104. doi:10.1103/PhysRevB.79.085104.
- [10] M. Dion, H. Rydberg, E. Schröder, D. C. Langreth, B. I. Lundqvist, Van der waals density functional for general geometries, Phys. Rev. Lett. 92 (2004) 246401. doi:10.1103/PhysRevLett.92.246401.
- [11] J. Klimeš, A. Michaelides, Perspective: Advances and challenges in treating van der waals dispersion forces in density functional theory, J. Chem. Phys. 137 (2012) 120901. doi:10.1063/1.4754130.
- [12] K. Lee, E. D. Murray, L. Kong, B. I. Lundqvist, D. C. Langreth, Higher-accuracy van der waals density functional, Phys. Rev. B 82 (2010) 081101. doi:10.1103/PhysRevB.82.081101.
- [13] E. D. Murray, K. Lee, D. C. Langreth, Investigation of exchange energy density functional accuracy for interacting molecules, J. Chem. Theory Comput. 5 (2009) 2754–2762. doi:10.1021/ct900365q.
- [14] J. Klimeš, D. R. Bowler, A. Michaelides, Chemical accuracy for the van der waals density functional, J. Phys.: Condens. Matter 22 (2010) 022201. doi:10.1088/0953-8984/22/2/022201.
- [15] J. Klimeš, D. R. Bowler, A. Michaelides, Van der waals density functionals applied to solids, Phys. Rev. B 83 (2011) 195131. doi:10.1103/PhysRevB.83.195131.
- [16] S. Grimme, Accurate description of van der waals complexes by density functional theory including empirical corrections, J. Comput. Chem. 25 (2004) 1463–1473. doi:10.1002/jcc.20078.
- [17] S. Grimme, Semiempirical gga-type density functional constructed with a long-range dispersion correction, J. Comput. Chem. 27 (2006) 1787–1799. doi:10.1002/jcc.20495.
- [18] S. Grimme, J. Antony, S. Ehrlich, H. Krieg, A consistent and accurate ab initio parametrization of density functional dispersion correction (dft-d) for the 94 elements h-pu, J. Chem. Phys. 132 (2010) 154104. doi:10.1063/1.3382344.
- [19] S. Grimme, S. Ehrlich, L. Goerigk, Effect of the damping function in dispersion corrected density functional theory, J. Comput. Chem. 32 (2011) 1456–1465. doi:10.1002/jcc.21759.
- [20] A. Tkatchenko, M. Scheffler, Accurate molecular van der waals interactions from ground-state electron density and free-atom reference data, Phys. Rev. Lett. 102 (2009) 073005. doi:10.1103/PhysRevLett.102.073005.
- [21] A. Tkatchenko, R. A. DiStasio, R. Car, M. Scheffler, Accurate and efficient method for many-body van der waals interactions, Phys. Rev. Lett. 108 (2012) 236402. doi:10.1103/PhysRevLett.108.236402.
- [22] T. Buc̆ko, S. Lebègue, J. Hafner, J. G. Ángyán, Tkatchenko-scheffler van der waals correction method with and without self-consistent screening applied to solids, Phys. Rev. B 87 (2013) 064110. doi:10.1103/PhysRevB.87.064110.
- [23] G. Kresse, J. Hafner, Ab initio molecular dynamics for liquid metals, Phys. Rev. B 47 (1993) 558. doi:10.1103/PhysRevB.47.558.
- [24] G. Kresse, J. Hafner, Ab initio molecular-dynamics simulation of the liquid-metal amorphous-semiconductor transition in germanium, Phys. Rev. B 49 (1994) 14251–14269. doi:10.1103/PhysRevB.49.14251.
- [25] G. Kresse, J. Furthmüller, Efficient iterative schemes for ab initio total-energy calculations using a plane-wave basis set, Phys. Rev. B 54 (1996) 11169–11186. doi:10.1103/PhysRevB.54.11169.
- [26] G. Kresse, J. Furthmüller, Efficiency of ab-initio total energy calculations for metals and semiconductors using a plane-wave basis set, Comput. Mater. Sci. 6 (1996) 15–50. doi:10.1016/0927-0256(96)00008-0.
- [27] D. M. Ceperley, B. J. Alder, Ground state of the electron gas by a stochastic method, Phys. Rev. Lett. 45 (1980) 566–569. doi:10.1103/PhysRevLett.45.566.
- [28] J. P. Perdew, K. Burke, M. Ernzerhof, Generalized gradient approximation made simple, Phys. Rev. Lett. 77 (1996) 3865–3868. doi:10.1103/PhysRevLett.77.3865.
- [29] P. E. Blöchl, Projector augmented-wave method, Phys. Rev. B 50 (1994) 17953–17979. doi:10.1103/PhysRevB.50.17953.
- [30] G. Kresse, D. Joubert, From ultrasoft pseudopotentials to the projector augmented-wave method, Phys. Rev. B 59 (1999) 1758–1775. doi:10.1103/PhysRevB.59.1758.
- [31] J. Paier, M. Marsman, K. Hummer, G. Kresse, I. C. Gerber, J. G. Ángyán, Screened hybrid density functionals applied to solids, J. Chem. Phys. 124 (15) (2006) 154709. doi:10.1063/1.2187006.
- [32] P. E. Blöchl, O. Jepsen, O. K. Andersen, Improved tetrahedron method for brillouin-zone integrations, Phys. Rev. B 49 (1994) 16223–16233. doi:10.1103/PhysRevB.49.16223.
- [33] F. Birch, Finite elastic strain of cubic crystals, Phys. Rev. 71 (1947) 809–824. doi:10.1103/PhysRev.71.809.
- [34] Y.-R. Jang, B. D. Yu, Structural, magnetic, and electronic properties of fe, J. Magn. 16 (2011) 201–205. doi:10.4283/JMAG.2011.16.3.201.
- [35] Y.-R. Jang, B. D. Yu, Hybrid functional study of the structural and electronic properties of co and ni, J. Phys. Soc. Jpn. 81 (2012) 114715. doi:10.1143/JPSJ.81.114715.
- [36] C. Kittel, Introduction to Solid State Physics, 8th Edition, Wiley, 2004.
- [37] G. I. Csonka, J. P. Perdew, A. Ruzsinszky, P. H. T. Philipsen, S. Lebègue, J. Paier, O. A. Vydrov, J. G. Ángyán, Assessing the performance of recent density functionals for bulk solids, Phys. Rev. B 79 (2009) 155107. doi:10.1103/PhysRevB.79.155107.
- [38] M. Fuchs, M. Bockstedte, E. Pehlke, M. Scheffler, Pseudopotential study of binding properties of solids within generalized gradient approximations: The role of core-valence exchange correlation, Phys. Rev. B 57 (1998) 2134–2145. doi:10.1103/PhysRevB.57.2134.
- [39] A. van de Walle, G. Ceder, Correcting overbinding in local-density-approximation calculations, Phys. Rev. B 59 (1999) 14992–15001. doi:10.1103/PhysRevB.59.14992.