The 0.3–30 keV Spectra of Powerful Starburst Galaxies: NUSTAR and CHANDRA Observations of NGC 3256 and NGC 3310
Abstract
We present nearly simultaneous Chandra and NuSTAR observations of two actively star-forming galaxies within 50 Mpc: NGC 3256 and NGC 3310. Both galaxies are significantly detected by both Chandra and NuSTAR, which together provide the first-ever spectra of these two galaxies spanning 0.3–30 keV. The X-ray emission from both galaxies is spatially resolved by Chandra; we find that hot gas dominates the 1–3 keV emission while ultraluminous X-ray sources (ULXs) provide majority contributions to the emission at 1–3 keV. The NuSTAR galaxy-wide spectra of both galaxies follow steep power-law distributions with at 5–7 keV. Using new and archival Chandra data, we search for signatures of heavily obscured or low luminosity AGN. We find that both NGC 3256 and NGC 3310 have X-ray detected sources coincident with nuclear regions; however, the steep NuSTAR spectra of both galaxies restricts these sources to be either low luminosity AGN () or non-AGN in nature (e.g., ULXs or crowded X-ray sources that reach erg s-1 cannot be ruled out). Combining our constraints on the 0.3–30 keV spectra of NGC 3256 and NGC 3310 with equivalent measurements for nearby star-forming galaxies M83 and NGC 253, we analyze the star-formation rate (SFR) normalized spectra of these starburst galaxies. The spectra of all four galaxies show sharply declining power-law slopes at energies above 3–6 keV primarily due to ULX populations. Our observations therefore constrain the average spectral shape of galaxy-wide populations of luminous accreting binaries (i.e., ULXs). Interestingly, despite a completely different galaxy sample selection, emphasizing here a range of SFRs and stellar masses, these properties are similar to those of super-Eddington accreting ULXs that have been studied individually in a targeted NuSTAR ULX program. We also find that NGC 3310 exhibits a factor of 3–10 elevation of X-ray emission over the other star-forming galaxies due to a corresponding overabundance of ULXs. We argue that the excess of ULXs in NGC 3310 is most likely explained by the relatively low metallicity of the young stellar population in this galaxy, a property that is expected to produce an excess of luminous X-ray binaries for a given SFR.
Subject headings:
galaxies: individual (NGC 3256 and NGC 3310) — galaxies: active — galaxies: starburst — galaxies: star formation — X-rays: galaxies1. Introduction
With the launch of the NuSTAR X-ray observatory (Harrison et al. 2013), we now have a first-ever means for studying populations of normal galaxies (not hosting luminous active galactic nuclei [AGN]) in the 10–30 keV bandpass, an energy regime which is expected to be dominated by bright X-ray binaries and low-level contributions from diffuse inverse-Compton emission (e.g., Persic & Rephaeli 2002; Wik et al. 2014a). The spectra of X-ray binaries at these energies betray unique information about their accretion states as variations in accretion disk, reflection, and coronal components undergo strong spectral pivots above 10 keV (see, e.g., Done et al. 2007), a regime that was not previously probed by Chandra and XMM-Newton for sources outside the Local Group. Prior to NuSTAR, studies of the hard X-ray spectra of X-ray binaries was limited to objects in the Milky Way (MW) and Magellanic Clouds (e.g., via RXTE; see Remillard & McClintock 2006 for a review), providing limited information about how the accretion states of these populations vary with galaxy properties (e.g., the starburst environment).
With Chandra and XMM-Newton, the lower-energy 10 keV emission from local galaxies has been studied in detail for a variety of galaxy types (see, e.g., Fabbiano et al. 2006 for a review), and ultradeep Chandra observations have extended these studies to very distant galaxy populations with look-back times that span the vast majority of cosmic history (e.g., Basu-Zych et al. 2013a). We are detecting X-ray emission from galaxy populations out to where the observed-frame Chandra 0.5–8 keV band corresponds to rest-frame energies of 2.5–40 keV, the most sensitive regimes of the NuSTAR bandpass for extragalactic binary work. Results from such studies have prompted the development of accreting binary population synthesis models, which have successfully been employed to construct a self-consistent framework that describes the observed evolution of X-ray binary populations from cosmic dawn to today (e.g., Fragos et al. 2013a,b). Key to these observational interpretations and model predictions, however, is knowledge of the X-ray spectra at 10 keV for galaxy populations that cover a broad range of physical properties (e.g., Fragos et al. 2013a; Kaaret et al. 2014). Therefore, a next step to improving our understanding of X-ray binary populations is to constrain the distributions and duty cycles of their accretion states and measure how their resulting 10 keV spectral contributions vary with galaxy physical properties (e.g., star-formation rate [SFR] and stellar mass []).
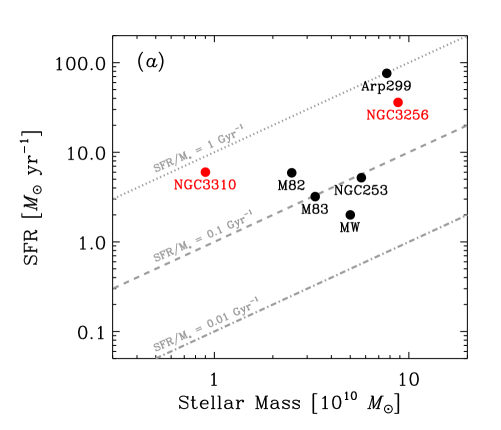
We are conducting a joint NuSTAR and Chandra survey of six far-infrared bright starburst galaxies (NGC 253, M82, M83, Arp 299, NGC 3256, and NGC 3310) with the goal of quantifying the dominant processes that contribute to the 10 keV emission. Figure 1 displays the SFR versus and specific SFR (sSFR SFR/) versus distance planes for the full galaxy sample. Our key goals are to: (1) identify the accretion states of the most luminous X-ray binary populations in these galaxies and characterize the 0.3–30 keV spectral energy distributions (SEDs) as a function of the galaxy physical properties (e.g., SFR and ); (2) search for heavily obscured AGN that may be present in these actively star-forming galaxies; and (3) constrain the nature of inverse Compton emission associated with particle accelerations in starburst flows.
As a pilot program, we studied with NuSTAR and Chandra the nuclear region and galaxy-wide X-ray emission of the nearby starburst galaxy NGC 253 (Lehmer et al. 2013; Wik et al. 2014a). These studies showed that there was no evidence for powerful buried AGN activity in the nucleus, and that the galaxy-wide X-ray emission above 10 keV is dominated by a few ultraluminous X-ray sources (ULXs) with minority contributions from lower luminosity X-ray binaries that have NuSTAR colors similar to Galactic black hole binaries in intermediate accretion states. The galaxy-wide X-ray spectrum of NGC 253 steepens at energies above 6 keV, consistent with the spectra of other ULXs studied by NuSTAR (see, e.g., Bachetti et al. 2013; Rana et al. 2014; Walton et al. 2013, 2014), signaling a possible dominance of super-Eddington accreting objects in the overall starburst galaxy spectra.
More recently, we have executed joint NuSTAR and Chandra/XMM-Newton observations of M83 (Yukita et al. in-preparation) and Arp 299 (Ptak et al. 2014), galaxies with sSFRs that are comparable to and 20 times higher than that of the MW, respectively. The brightest X-ray sources in M83 have NuSTAR colors similar to those of NGC 253, albeit with fewer ULXs. Arp 299 has 10 keV emission dominated by a single Compton-thick AGN that outshines the other X-ray emitting components of the galaxy. Given the relatively large distance (40 Mpc) to Arp 299, and its correspondingly smaller angular extent, it was not possible to spatially resolve the X-ray emitting components with NuSTAR. Therefore, the spectral properties of the non-AGN components were poorly constrained at energies above 10 keV, leaving us with little knowledge of the high-energy spectral shape for high sSFR galaxies (see Fig. 1b).
In this paper, we continue to investigate the 0.3–30 keV SEDs of starburst galaxies by studying two powerful starburst galaxies in the local universe: NGC 3256 and NGC 3310. The sSFRs of these galaxies are the second and third highest of our sample (see Fig. 1), and are only exceeded by Arp 299. Both NGC 3256 and NGC 3310 have been studied extensively across the full electromagnetic spectrum, and neither system exhibits compelling evidence for harboring powerful AGN (see 2 for a discussion). The sSFRs of these galaxies are 0.4–0.8 Gyr-1, a range expected to host X-ray binary populations that are dominated by high-mass X-ray binaries (HMXBs; e.g., Colbert et al. 2004; Lehmer et al. 2010). Such high-sSFR galaxies are representative of the typical galaxy populations on the “main sequence” at 1–2 (e.g., Karim et al. 2011). As such, this study will provide SED constraints on high-sSFR galaxies that can be used to inform X-ray studies of high-redshift galaxy populations at these redshifts, which require informed -corrections (e.g., Lehmer et al. 2008; Basu-Zych et al. 2013a; Kaaret 2014).
Throughout this paper, we assume distances of Mpc and 19.8 Mpc (Sanders et al. 2003) and column densities of cm-2 and cm-2 for NGC 3256 and NGC 3310, respectively (Dickey & Lockman 1990). Star-formation rates and stellar masses quoted throughout this paper were calculated assuming a Kroupa (2001) initial mass function. Star-formation rates were calculated using equation 6.11 of Calzetti (2013), making use of UV and mid-IR data from GALEX and Spitzer, respectively. Stellar masses were estimated following the prescription outlined in Appendix 2 of Bell et al. (2003), making use of colors from RC3 (de Vaucouleurs et al. 1991) and -band luminosities based on 2MASS photometry (Jarret et al. 2003) and the adopted distances. These assumptions imply SFR 36 yr-1 and 6 yr-1 and and for NGC 3256 and NGC 3310, respectively. Quoted errors associated with spectral fits represent 90% confidence intervals.
2. The Galaxies
2.1. NGC 3256
NGC 3256 (35.4 Mpc) is a major-merger system composed of two gas-rich galaxies with comparable masses (total ) that are in a nearly coalescent phase of the merger (Lípari et al. 2000; Alonso-Herrero et al. 2002). Two discrete nuclei have been identified 5 arcsec apart (850 pc; Zenner & Lenzen 1993; Norris & Forbes 1995) and remarkably long (200 kpc) H I tidal features have been identified (e.g., Graham et al. 1984; English et al. 2003). The system has the highest 8–1000 m infrared luminosity ( ; Sanders et al. 2003) for galaxies that reside within , and studies at radio (e.g., Norris & Forbes 1995), submm (e.g., Sakamoto et al. 2006, 2014), infrared (Graham et al. 1984; Doyon et al. 1994a, 1994b; Moorwood & Olivia 1994; Lira et al. 2008; Alonso-Herrero et al. 2013), optical (e.g., Heckman et al. 2000; Lípari et al. 2000; Alonso-Herrero et al. 2002), and UV (e.g., Kinney et al. 1993; Leitherer et al. 2013) wavelengths all support a scenario in which the majority of the galaxy’s power output is produced by starburst-related activity.
X-ray studies with Chandra and XMM-Newton have shown that the 0.3–10 keV spectrum of NGC 3256 can be modeled well as a multiphase thermal plasma with harder power-law emission from a population of discrete point sources, the majority of which are ULXs (see, e.g., Lira et al. 2002; Jenkins et al. 2004; Pereira-Santaella et al. 2011). Although both nuclear regions have been detected by Chandra with erg s-1, the nature of the X-ray emission is unclear, as no obvious AGN signatures have been found (Lira et al. 2002). Detailed assessment of the kinematics of the molecular gas, via ALMA and SMA observations, have concluded that both nuclei contain powerful outflows, but with differing characteristics (e.g., Cicone et al. 2014; Sakamoto et al. 2014; Emonts et al. 2014). The northern nuclear outflow is of wide breadth and has a mean velocity of a few 100 km s-1 and is likely driven by a starburst superwind. The southern outflow is well-collimated and faster (1000 km s-1) and is plausibly driven by an AGN that has recently gone dormant (e.g., Moran et al. 1999; Neff et al. 2003; Alonso-Herrero et al. 2012).
2.2. NGC 3310
NGC 3310 is a closer (19.8 Mpc) starburst system with a SFR that is a factor of 10 times lower than NGC 3256 ( ; Sanders et al. 2003); however, given its relatively low stellar mass ( ), this system has a comparable and perhaps larger sSFR than NGC 3256 (see Fig. 1). The system contains evidence for a minor-merger that has triggered a vigorous, young (2.5–5 Myr old) circumnuclear star-forming ring with a 20–30 arcsec (2 kpc) diameter (e.g., Balick & Heckman 1981; Díaz et al. 2000; Elmegreen et al. 2002; Chandar et al. 2005; Miralles-Caballero et al. 2014). The most recent minor merger was inferred to occur in the last 30 Myr (Elmegreen et al. 2002; de Grijs et al. 2003a), and is likely to be one of several past interactions with small metal-poor dwarf galaxies (e.g., Wehner et al. 2006), as evidence for starburst activity as old as 100 Myr is apparent in the star clusters (Meurer 2000). Such a series of minor-mergers could potentially provide a significant increase to the mass build-up of the bulge (Miralles-Caballero et al. 2014) and is likely to have modified the gas-phase abundances, as there is evidence that the circumnuclear metallicity is lower than is typical for spiral galaxies with morphologies similar to NGC 3310 (e.g., Pastoriza et al. 1993).
Similar to NGC 3256, the Chandra and XMM-Newton spectra of NGC 3310 can be modeled well by a multiphase hot gas plus a power-law component; however, the plasma temperature is cooler and the power-law slope is harder than those found for NGC 3256 (Jenkins et al. 2004). The hard power-law component is dominated by a population of 9 ULXs that are distributed within the circumnuclear star-forming ring and along the spiral arms. HST STIS observations of the nuclear region have uncovered a bright 0.5 arcsec (40 pc) diameter central star-forming region with kinematic properties consistent with a circularly rotating disk (Pastorini et al. 2007). The nuclear region is detected by Chandra as a point-like source,111The nuclear region is also detected by XMM-Newton; however, it is clear that confusion with four other Chandra-resolved ULXs of comparable brightness makes it difficult to uniquely interpret those data. and the luminosity of this region, erg s-1, is within the range of other ULXs in the galaxy. The Chandra spectrum shows that the nuclear X-ray source has a flat power-law spectral slope, with some evidence (at the 2 confidence level) for an Fe K line—two properties that indicate there may be a hidden (obscured) AGN in the galaxy nucleus (Tzanavaris et al. 2007).
3. Observations and Data Reduction
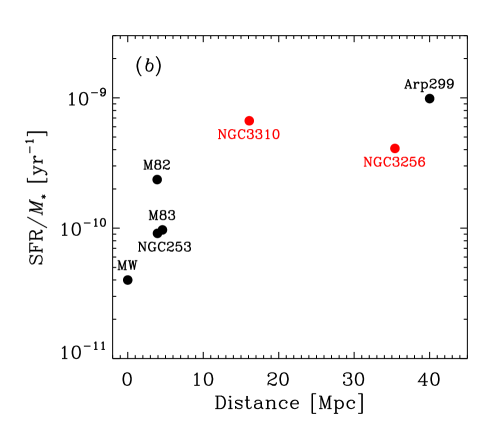
In this investigation we make use of nearly simultaneous observations with NuSTAR and Chandra to explore the full 0.3–30 keV bandpass properties. In later sections, we make use of archival Chandra data to support our analyses; however, we focus the current investigation on the new nearly simultaneous observations. We obtained our NuSTAR and Chandra observations of NGC 3256 and NGC 3310 over single epochs beginning on 2014 Aug 24 and 2014 Jun 11, respectively. Figure 2 shows the relative observing schedules for the NuSTAR and Chandra exposures. Due to Earth occultations and passages through the South Atlantic Anomaly (SAA), the NuSTAR on-target observations were carried out at 51–58% efficiency over 3–4 day periods. The cumulative NuSTAR good-time-interval exposures were 184 ks (ObsID 50002042) and 141 ks (ObsID 50002040) for NGC 3256 and NGC 3310, respectively. The Chandra observations were continuous and lasted 16 ks (ObsID 16026) and 10 ks (ObsID 16025) for NGC 3256 and NGC 3310, respectively.
The NuSTAR data were reduced using HEASoft v6.15, NuSTAR Data Analysis Software (NuSTARDAS) v1.7, and CALDB version 20130320. We processed level 1 data to level 2 products by running nupipeline, which performs a variety of data reduction steps, including (1) filtering out bad pixels, (2) screening for cosmic rays and observational intervals when the background was too high (e.g., during passes through the SAA), and (3) projecting accurately the events to sky coordinates by determining the optical axis position and correcting for the dynamic relative offset of the optics bench to the focal plane bench due to motions of the 10 m mast that connects the two benches.
Due to the angular extents of NGC 3256 and NGC 3310 (major-axes = 3.8 arcmin and 3.1 arcmin, respectively), the Chandra exposures for both galaxies were conducted using single ACIS-S pointings with the approximate position of the galactic centers set as the aimpoints. For our data reduction, we used CIAO v. 4.6 with CALDB v. 4.6.1.1. We reprocessed our events lists, bringing level 1 to level 2 using the script chandra_repro, which identifies and removes events from bad pixels and columns, and filters events lists to include only good time intervals without significant flares and non-cosmic ray events corresponding to the standard ASCA grade set (grades 0, 2, 3, 4, 6). We constructed an initial Chandra source catalog by searching the 0.5–7 keV images with wavdetect (run with a point spread function [PSF] map created using mkpsfmap), which was set at a false-positive probability threshold of and run over seven scales from 1–8 (spaced out by factors of in wavelet scale: 1, , 2, 2, 4, 4, and 8). Using these initial Chandra source catalogs, we constructed source-free light curves and searched for flaring intervals that were 5 above the background level. No such intervals were found, and our observations were deemed to be sufficiently cleaned.
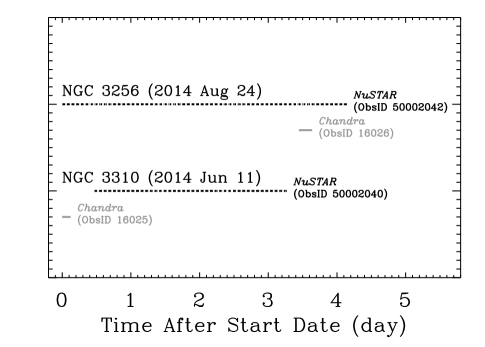
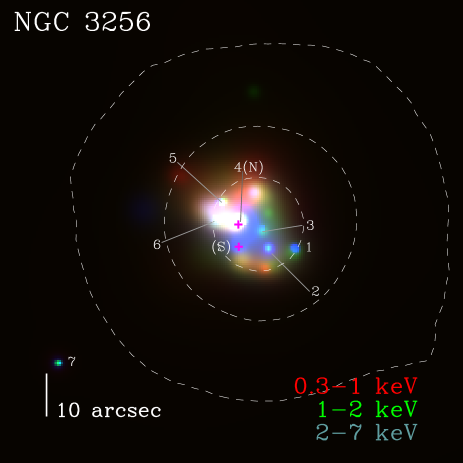
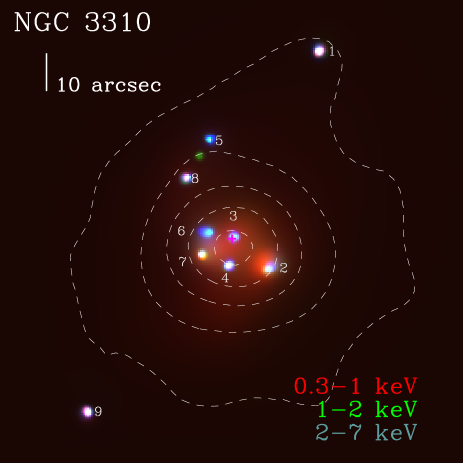
In Figure 3, we show the adaptively smoothed, false color Chandra images of NGC 3256 and NGC 3310, with NuSTAR 4–25 keV intensity contours overlaid. It is apparent from the Chandra data that diffuse emission at keV, potentially due to hot gas and unresolved point sources, and multiple bright point sources at all energies provide dominant contributions to the Chandra-detected emission for both galaxies. The NuSTAR PSF has an 18 arcsec full width half maximum (FWHM) core with a 58 arcsec half-power diameter (Harrison et al. 2013). Given the X-ray extents of the galaxies (60–70 arcsec), NuSTAR is unable to strictly resolve the point-source populations that dominate the keV emission probed by NuSTAR; however, some evidence for spatial extent following the point-source distribution is apparent in NGC 3310 (see §4.3 below).
4. Analysis and Results
As discussed in 1, our primary goals are to measure and assess the contributing components to the broad-band 0.3–30 keV SEDs of the two powerful starburst galaxies NGC 3256 and NGC 3310, and constrain the underlying AGN activity in these galaxies. To achieve these goals, we first characterized the 0.3–30 keV spectra across the full extents of both galaxies. We then used the high spatial resolution of Chandra to measure the 8 keV contributions from bright resolved point-sources and diffuse emission from hot gas and unresolved point-sources. Finally, using sensible extrapolations of the Chandra component spectra to 8 keV, we infer the relative contributions AGN candidates would make to the NuSTAR galaxy-wide spectra. In the sections below, we describe each of these procedures in detail.
| Parameter | Unit | NGC 3256 | NGC 3310 |
|---|---|---|---|
| Chandra only fit:∗ point-source subtracted diffuse emission | |||
| 1022 cm-2 | 0.096 | 0.011 | |
| keV | |||
| 1022 cm-2 | |||
| keV | |||
| Chandra + NuSTAR galaxy-wide fit:† diffuse emission plus non-thermal point sources | |||
| 1022 cm-2 | … | ||
| keV | … | ||
| 1022 cm-2 | |||
| … | |||
| keV | … | ||
| … | |||
| photons keV-1 cm-2 s-1 at 1 keV | |||
| 1.09 | 0.98 | ||
| (degrees of freedom) | 159 | 192 | |
| (10–30 keV) | 10-13 ergs cm-2 s-1 | 1.330.03 | 5.90.4 |
| (10–30 keV) … | 1040 ergs s-1 | 1.990.05 | 2.80.2 |
Note—All quoted errors are at the 90% confidence level.
∗Fits to the point-source subtracted diffuse Chandra spectra were performed using XSPEC model tbabs(apec1+tbabsapec2+tbabspow) to obtain values of , , and . In this process the power-law had a fixed photon index of and all thermal models assumed solar abundances. Values of , , and were subsequently fixed when fitting the Chandra + NuSTAR galaxy-wide spectra, where their normalizations were free to vary.
† The galaxy-wide Chandra + NuSTAR spectra were fit using XSPEC models tbabs(apec1+tbabsapec2+tbabsapec3+tbabsbknpo) and tbabs(apec1+tbabsapec2+tbabspow) for NGC 3256 and NGC 3310, respectively.
4.1. Galaxy-Wide Spectral Analyses
We began by extracting the nearly simultaneous Chandra and NuSTAR spectra over the full extents of both galaxies. For NGC 3256 and NGC 3310, we extracted on-source spectra using circular apertures with radii equal to 80 arcsec and 90 arcsec, respectively. These apertures were chosen to encompass the entire optical extents of the galaxies and reach 20 arcsec (roughly the NuSTAR FWHM) beyond the most offset point-sources that were clearly detected with Chandra. For each galaxy, background spectra were extracted using 1–5 circular apertures located in source-free regions. For Chandra, the background extraction regions had radii 50–70 arcsec and were chosen by eye to be placed in a pattern surrounding the on-source extraction region. For NuSTAR, background regions were chosen more carefully to properly account for the spatial background gradients that arise primarily from the “aperture” background component, which contains cosmic X-ray background stray light that shines directly onto the detectors from a 1–4 deg annular region (see, e.g., Appendix A of Wik et al. 2014b). Following the procedure described in Appendix B of Wik et al. (2014b), we constructed background maps for the FPMA and FPMB modules in the 3–20 keV band, an energy regime sensitive to variations in the aperture background component. For each background map, we identified 1–4 regions with sizes equal to the on-source aperture that had background levels comparable to those expected to be present within the source extraction regions. The closest edge of each background region was located away from the central positions of each galaxy to avoid contamination from the galaxy itself. After choosing appropriate regions, the Chandra and NuSTAR on-source and background spectra were extracted using the specextract and nuproducts tools, respectively.
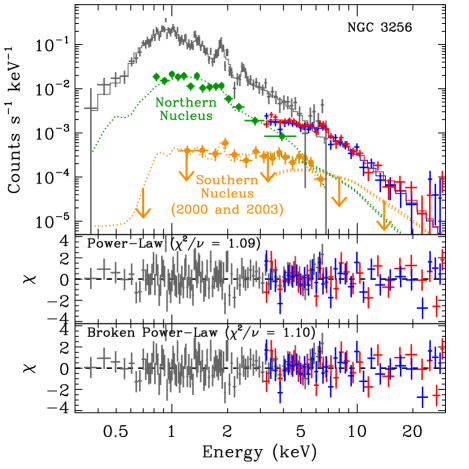
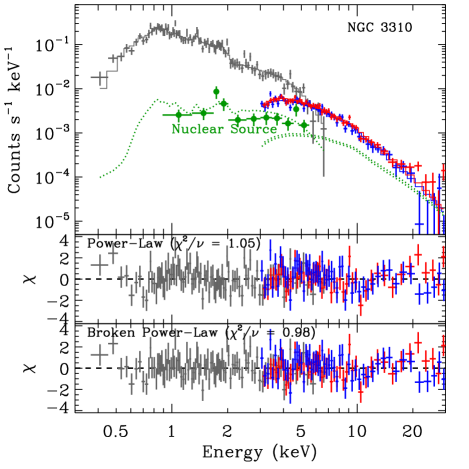
In Figure 4, we show the 0.3–30 keV galaxy-wide spectra for both galaxies. As discussed in §3, from the Chandra data (see Fig. 3), it is clear that the X-ray emission from both galaxies can be broadly characterized as consisting of diffuse emission (from hot gas and unresolved point sources) and bright point sources (e.g., X-ray binaries and possibly AGN). Previous investigations with Chandra and XMM-Newton have found that the diffuse components of these galaxies can be modeled well using two-temperature thermal spectra, with NGC 3310 having cooler temperatures ( = 0.3 and 0.6 keV) than the more powerful NGC 3256 ( = 0.6 and 0.9 keV), which may also contain an additional absorbed hot (3.9 keV) component (e.g., Lira et al. 2002; Jenkins et al. 2004). The brightest point sources in these galaxies are ULXs with nine sources spanning (2–10) erg s-1 for NGC 3310 (Smith et al. 2012) and roughly a dozen sources with (2–60) erg s-1 in NGC 3256 (Lira et al. 2002). These ULXs dominate the galaxy-wide emission from 2–8 keV and are expected to provide majority contributions to the non-AGN emission in the 8–30 keV bandpass. We therefore chose to model the broad-band 0.3–30 keV spectra of the galaxies using the sum of thermal and power-law components to account for the hot gas and ULXs, respectively.
For each galaxy, we tested for the presence of 2–3 thermal components, in which the absorption of each component increases with increasing temperature. Such a trend has been seen in spatially resolved starburst galaxies like M82, NGC 253, and past studies of NGC 3256, in which the hottest, most obscured components are located in the nuclear regions and the cooler, unobscured plasmas extend to larger galaxy-wide scales (e.g., Strickland et al. 2000; Pietsch et al. 2001; Lira et al. 2002; Strickland & Heckman 2007, 2009; Ranalli et al. 2008). We made use of the spatial resolving power of Chandra to better inform our estimates of the diffuse emission component. To this end, we extracted Chandra “diffuse component” spectra from the galaxies after removing the bright point-source populations. In this exercise, we excluded events from regions that were within 1.5 the radius of the 90% encircled-energy fraction PSFs of all bright Chandra detected point sources (see 4.2 below for details on the Chandra detected point-source population) and extracted events from within the same apertures used for the galaxy-wide spectra discussed above. The resulting diffuse component spectra are expected to be dominated by hot gas and unresolved, low luminosity X-ray point-sources. We note that the bright X-ray point-source densities are highest in the central regions of the galaxies where star-formation is highest. It is in these same regions where we expect to have the hottest X-ray-emitting gas associated with the starbursts. For NGC 3256 and NGC 3310, the removal of these regions will therefore likely result in the removal of a significant fraction of the emission from the hottest gas component.
As a first step, we fit the diffuse, point-source-subtracted Chandra spectra using two thermal components (apec in XSPEC; Smith et al. 2001) plus a single power-law (accounting for unresolved point sources), to determine the temperatures of the galaxy-wide hot gas.222We modeled the point-source-subtracted Chandra spectra using XSPEC model tbabs*(apec + tbabs*apec + tbabs*powerlaw) and fixed the initial absorption to Galactic and the power-law spectral slope to , a value consistent with that of bright X-ray binaries (e.g., Mineo et al. 2012a). The apec component abundances were fixed to solar. In the top portion of Table 1, we list the best-fit temperatures that result from this process. Similar to the results presented by Jenkins et al. (2004), we find best-fitting temperatures of 0.3 and 0.9 keV for NGC 3256; however, we find that much cooler temperatures of 0.2 and 0.3 keV were required for NGC 3310, with the latter component being more absorbed and intrinsically powerful than the former component.
Next, for each galaxy, we modeled the full galaxy-wide Chandra plus NuSTAR spectrum using the two thermal components (with temperatures fixed at the previous best-fit values) plus a third, hotter ( 1 keV) and more obscured thermal component and a non-thermal component to model emission from the point source population. For the point source spectral component, we tested both a single and broken power-law model to see if breaks (e.g., at 3–8 keV) were preferred, as is most often the case for individual ULX spectra (e.g., Gladstone et al. 2009; Bachetti et al. 2013; Lehmer et al. 2013; Rana et al. 2014; Wik et al. 2014a). Since the point-source spectra of our galaxies contain the conglomerated summed emission from primarily ULXs, we do not report fits using more complex models that contain detailed physical treatment of individual accretion disks and coronae (e.g., diskbb, diskpbb, diskpn, comptt, eqpair, and dkbbfth). In Table 1, we provide the best-fitting parameters for fits to the Chandra plus NuSTAR spectra that include the two temperature plasma (with fixed temperatures) component, plus an absorbed hotter component (in the case of NGC 3256 only), plus an absorbed single or broken power-law component. In the bottom panels of Figure 4 we display the residuals to these fits.
For NGC 3256, we find that the sum of the diffuse component plus a single absorbed ( cm-2) power-law () and an absorbed hot (1 keV) plasma component were sufficient to obtain a good fit to the 0.3–30 keV spectrum. The absorbed hot plasma component was implemented to fit a notable Fe-line feature in the NuSTAR spectrum at 6.4–6.8 keV. Such a feature is also notable in the Chandra spectrum of the full galaxy but not the diffuse region with point sources removed (see above). Further analysis indicates that the Fe emission photons are concentrated in a region within 20 arcsec of the nucleus, where most of the X-ray detected point sources are located. This component was not in our diffuse, point-source-subtracted Chandra spectrum because of the spatial coincidence with point sources. We note that X-ray binaries and obscured AGN may also provide some contribution to such a feature. However, given the steepness of the galaxy-wide spectral slope above 8 keV, it is unlikely that the Fe-line is powered by an obscured AGN, which would have a harder spectral slope ( 1.5–2.0; see 4.3). Replacing the single power-law with a broken power-law does not improve the quality or change the character of the fit (see lower panels of Fig. 4 left). Since the thermal components in the galaxy dominates the 0.3–2.5 keV emission in NGC 3256, a true break in the power-law component could be masked if it resides at keV.
For NGC 3310, we find that the diffuse component plus a broken power-law model provides the best fit to the data; no additional absorbed hotter component was required to fit the spectrum, as we do not see clear evidence for an Fe-line. The best-fitting slopes ( and ) and energy break ( keV) are within the range of values found for ULXs (e.g., Gladstone et al. 2009). In contrast to NGC 3256, which had strong emission features related to hot gas out to keV, we find that the overall spectrum of NGC 3310 above 1 keV is dominated by the point-source population. As we will discuss in more detail below, the SFR-normalized point-source emission in NGC 3310 is a factor of 3–10 times higher compared to other starburst galaxies studied in our program (i.e., NGC 253, NGC 3256, and M83). The relatively strong emission from the point-source population may therefore be masking lower-intensity line features that would betray the presence of a hot X-ray plasma or an obscured AGN (e.g., Fe emission-lines). If NGC 3310 harbors an obscured AGN, it is almost certainly of low luminosity and is likely to provide only a minor perturbation on the non-AGN emission in the NuSTAR band. We return to the discussion of the potential for AGN in both NGC 3256 and NGC 3310 in §4.3 below when we discuss the Chandra properties of the nuclear sources in detail.
| powerlaw | diskbb | ||||||||||||
| Net Counts | |||||||||||||
| Source ID | (hr) | (deg) | (1022 cm-2) | (1022 cm-2) | (keV) | ( erg cm-2 s-1) | ( erg s-1) | (0.5–7 keV) | Note | ||||
| (1) | (2) | (3) | (4) | (5) | (6) | (7) | (8) | (9) | (10) | (11) | (12) | (13) | (14) |
| NGC 3256 | |||||||||||||
| 1 | 10 27 50.0 | 43 54 19.8 | 0.02 | 1.4 | 43 | 1.9 | 45 | 32 | 13.5 | 39.6 | 43 7 | ||
| 2 | 10 27 50.6 | 43 54 19.8 | 1.2 | 60 | 2.0 | 60 | 55 | 13.2 | 39.9 | 67 8 | |||
| 3 | 10 27 50.8 | 43 54 15.2 | 0.37 | 2.2 | 44 | 0.08 | 1.2 | 46 | 52 | 13.5 | 39.7 | 71 8 | |
| 4 | 10 27 51.2 | 43 54 13.9 | 0.36 | 2.8 | 123 | 0.04 | 0.8 | 126 | 140 | 13.1 | 40.1 | 329 18 | Nucleus (N) |
| 5 | 10 27 51.6 | 43 54 09.3 | 0.32 | 2.9 | 65 | 0.02 | 0.8 | 69 | 88 | 13.5 | 39.6 | 139 12 | |
| 6 | 10 27 51.8 | 43 54 13.3 | 0.55 | 3.6 | 60 | 0.18 | 0.6 | 63 | 68 | 13.7 | 39.4 | 118 11 | |
| 7 | 10 27 55.1 | 43 54 46.6 | 0.5 | 33 | 33 | 25 | 13.1 | 40.0 | 33 6 | ||||
| NGC 3310 | |||||||||||||
| 1 | 10 38 43.3 | +53 31 02.0 | 0.22 | 2.3 | 31 | 0.01 | 0.9 | 27 | 23 | 12.8 | 39.8 | 168 13 | |
| 2 | 10 38 44.8 | +53 30 04.3 | 0.55 | 1.6 | 12 | 0.34 | 1.7 | 11 | 10 | 12.7 | 40.0 | 152 12 | |
| 3 | 10 38 45.8 | +53 30 12.2 | 0.30 | 0.4 | 9 | 0.58 | 10 | 8 | 12.4 | 40.3 | 174 13 | Nucleus | |
| 4 | 10 38 46.0 | +53 30 04.8 | 0.71 | 1.8 | 9 | 0.40 | 1.5 | 10 | 16 | 12.6 | 40.1 | 131 11 | |
| 5 | 10 38 46.5 | +53 30 38.3 | 0.84 | 2.0 | 14 | 0.51 | 1.3 | 12 | 12 | 12.7 | 40.0 | 142 12 | |
| 6 | 10 38 46.6 | +53 30 13.7 | 0.59 | 1.7 | 2 | 0.24 | 1.9 | 3 | 8 | 12.8 | 39.9 | 130 11 | |
| 7 | 10 38 46.7 | +53 30 07.8 | 1.9 | 5 | 0.8 | 8 | 7 | 13.1 | 39.5 | 213 15 | |||
| 8 | 10 38 47.2 | +53 30 27.9 | 0.28 | 1.8 | 13 | 0.04 | 1.5 | 13 | 10 | 12.9 | 39.8 | 121 11 | |
| 9 | 10 38 50.2 | +53 29 26.0 | 0.46 | 2.0 | 22 | 0.25 | 1.0 | 19 | 12 | 12.9 | 39.8 | 294 17 | |
NOTE.—All quoted errors on fit parameters indicate 90% confidence intervals, while quoted errors associated with net counts are 1. Col.(1): Source ID. Col.(2) and (3): Right ascention and declination, respectively, based on Chandra source location. Col.(4)–(6) provide parameters to spectral fits for a power-law with intrinsic absorption model. Col.(4): Intrinsic absorption column density in units of cm-2. Col.(5): power-law photon index. Col.(6): Minimum cstatistic . Col.(7)–(9) provide parameters to spectral fits for a multicolor accretion disk (diskbb) with intrinsic absorption model. Col.(7): Intrinsic absorption column density in units of cm-2. Col.(8): Best-fitting inner accretion disk temperature () in units of keV. Col.(9): Minimum cstatistic . Col.(10) Number of degrees of freedom for both power-law and multicolor accretion disk fits. Col.(11) and (12): Observed 2–10 keV flux and luminosity based on the best-fitting model. Col.(13) Net counts in the 0.5–7 keV Chandra band. Col.(14) Notes on the individual sources.
4.2. Chandra Point-Source Analyses
Our joint NuSTAR and Chandra spectral analyses indicate that the galaxy-wide 0.3–30 keV emission from NGC 3256 and NGC 3310 are dominated by the combination of hot gas and ULX populations, with no obvious signatures of luminous AGN. In this section, we gain further insight into the X-ray emitting populations in these galaxies by performing basic Chandra spectral analyses of the detected point-sources and diffuse emission.
For each galaxy, we identified point sources that had 20 0.5–7 keV counts that were also detected in the 2–7 keV band images using wavdetect at a false-positive probability threshold of ; these sources were candidates for performing basic spectral fits. For NGC 3256 and NGC 3310, we found 7 and 9 sources, respectively, that satisfied these criteria; the locations of these sources are annotated in Figure 3. Taken together, these sources respectively provide 42% and 79% of the 2–7 keV Chandra net counts within the total galaxy apertures defined in 4.1. For these sources, we extracted the Chandra spectra and fit them using both an absorbed power-law model (powerlaw) and an absorbed multicolor accretion disk (diskbb; Shakura & Sunyaev 1973; Mitsuda et al. 1984). In this procedure, point-sources were extracted from circular regions that encompassed 90% of the encircled energy of the PSF (2 arcsec in radius for all sources). We utilized the same background regions used in 4.1 to estimate background spectra for the sources. As such, some source regions will contain background related to diffuse emission. Since the exposures are relatively shallow and diffuse emission gradients are high, we chose not to attempt to model the local background component. When relevant, we have qualified interpretations of the Chandra source spectra with this limitation. Given the small number of counts per source (33–329 0.5–7 keV counts), all spectral fits were performed by minimizing the Cash statistic (cstat; Cash 1979) using spectra binned to a minimum of 1 count per channel.
In Table 2, we present the best-fit parameters for the point-source spectral fits. We note that the parameters in Table 2 provide only a basic description of the data and are not well constrained, e.g., due to degeneracies between column density and spectral slope or inner disk temperature. In particular, for sources that were located near the nuclei of the galaxies, some contributions from hot gas are expected, which will steepen the inferred spectral slopes. In the majority of cases, a simple power-law provided an acceptable fit to the spectra; we find a slight (1 level) statistical preference for the diskbb model for sources 1 and 9 of NGC 3310. The luminosity range of the point-source populations cover (3–20) erg s-1, indicating that if all sources are discrete objects, then they are all in the ULX range of luminosities. The photon indices for the point sources range from 0.4–3.6 (median ), with only source 3 in NGC 3310 having at 90% confidence. As we will discuss in the next section, source 3 is coincident with the nuclear region in NGC 3310 and is a candidate obscured AGN.
4.3. Contributions from Nuclear Sources and Potential AGN
Both NGC 3256 and NGC 3310 contain Chandra detected point-like sources coincident with their galactic nuclei (NGC 3256 source 4 and NGC 3310 source 3); however, for NGC 3256, we only detect the northern nucleus and not the southern nucleus. In this section, we investigate the nature of the sources coincident with the nuclei using Chandra spectral constraints and discuss their potential contributions to the 0.3–30 keV spectra.
For NGC 3256, there is a clear detection of the northern nucleus, which is the brightest point-like source in our Chandra catalog (source 4). Using a deeper 30 ks Chandra exposure (ObsID 835), Lira et al. (2002) found that the nuclear emission is clearly extended, suggesting that the emission must include extended and/or multiple point-sources. From Table 2, we see the Chandra spectrum of this source is fit well with a steep power-law () with modest absorption ( cm-2). Such a steep photon index is uncharacteristc of AGN, which typically span 1–2.2. We refit the spectrum using only the 3–7 keV range, to mitigate any biases in the spectral fit due to soft emission from the hot gas, which will inevitably be coincident with our spectral extraction of this region. The resulting best-fit photon index remained unchanged, indicating that there is no evidence for an emerging hard X-ray AGN in this region. This result is consistent with previous studies that have concluded that the northern nucleus in NGC 3256 is powered almost exclusively by star-formation activity (e.g., Lira et al. 2002; Jenkins et al. 2004; Sakamoto et al. 2014). In Figure 4, we show the contribution from the northern nucleus extrapolated through to the NuSTAR band. Based on this extrapolation and the global fit presented in 4.1, we estimate that this source will contribute 4–10% of the galaxy-wide emission across the full 0.3–30 keV band.
Our 16 ks Chandra observation of NGC 3256 did not yield a clear detection of the southern nucleus (location indicated in the left panel of Fig. 3), which has previously been shown to have submm and near-infrared evidence for a collimated outflow, potentially due to an AGN that is currently inactive (e.g., Sakamoto et al. 2014; Emonts et al. 2014). Two previous deeper 25 ks archival Chandra exposures (ObsIDs 835 and 3569) reveal clear detections of a source coincident with the southern nucleus, suggesting that the source does produce powerful, albeit heavily obscured, X-ray emission at the erg s-1 level (in the 0.3–10 keV band). Using the Chandra exposure from ObsID 835, as well as radio, near-IR, and optical data, Lira et al. (2002) showed that this source is likely to be a low luminosity AGN that does not provide a significant contribution to the total X-ray emission of the galaxy. No evidence was found implicating a luminous, heavily obscured AGN (e.g., Fe-line emission). The non-detection of the southern nucleus in our 16 ks Chandra exposure indicates a change in the southern source with respect to the previous two observations. In 2000 Jan 5 and 2003 May 23, the southern source was detected with similar 2–7 keV Chandra count-rates of cnts s-1 and cnts s-1, respectively. Whereas the 3 upper limit on the 2–7 keV Chandra count-rate in our 2014 Aug 28 observation is cnts s-1, indicating a factor of 2.0–2.5 times decline in the southern source hard-band intensity. As shown by our NuSTAR spectrum, the steep spectral slope of the full galaxy persists out to at least 30 keV, limiting the possible contributions from a hard southern nuclear AGN. This implies that if there is an AGN associated with the southern nucleus, it is likely to be of low luminosity.
To place more stringent constraints on the spectral properties of the southern nucleus, we combined the previous two Chandra observations of NGC 3256 to create a merged 50 ks data set. We extracted the merged spectrum of the southern nuclear source and performed spectral fitting in XSPEC. The spectrum can be fit well by a simple power-law model with an inverted photon index of ; the best-fit model implies a 2–10 keV luminosity of erg s-1. It is likely that the spectrum contains both contributions from hot gas and a heavily obscured power-law source coincident with the nuclear region. The black hole mass for the southern nucleus is on the order of (e.g., Alonso-Herrero et al. 2013), implying an Eddington luminosity of erg s-1. If the southern nucleus is indeed an AGN it would therefore have , and the expected intrinsic spectral slope of this source would be between 1.5–2.0 (Younes et al. 2011). Using these constraints, we fit the spectrum of the southern nucleus using an absorbed plasma plus an absorbed power-law model (tbabs*apec+ tbabs*powerlaw in XSPEC). We held the plasma temperature fixed at 0.6 keV (see Lira et al. 2002 for motivation) and the power-law slope fixed at and fit for the component normalizations and obscuring columns. This model yielded a good fit to the data for column densities cm-2 and cm-2.
In the left panel of Figure 4, we show the Chandra spectrum and best-fitting model of the southern nucleus of NGC 3256 from the previous two observations when the source was detectable (orange data and curve). The data and model have been scaled down by a factor of 2.5 to show the upper limit to our 2014 observation (see above). Based on an extrapolation of this model to the NuSTAR band, the southern nucleus is expected to contribute 10–30% of the NuSTAR emission at 10–30 keV. Such a low level of AGN activity is insufficient to have any material effect on the overall shape of the galaxy spectrum nor on the constraints presented in 4.1 and Table 1. We therefore expect that the 0.3–30 keV spectrum of NGC 3256 is dominated by non-AGN emitting sources (i.e., hot gas and X-ray binaries).
For NGC 3310, a previous 50 ks Chandra observation from 2003 (ObsID 2939) was used by Tzanavaris & Georgantopoulos (2007) to show that there is evidence for an Fe-K emission line in the nuclear source (source 3), implying the presence of a hidden AGN. Our 10 ks Chandra observation was too shallow to verify the claimed Fe-K feature, which was of low significance (2 ) in the much deeper 2003 observation. However, we do find that the best-fitting power-law spectral slope of the nuclear point-source is much shallower than the other sources in the galaxy ( 1.6–2.3), and the luminosity of the source ( erg s-1) is the highest of all the point sources. These facts are consistent with an obscured or low luminosity AGN hypothesis. We note that if we invoke a more complex model appropriate for AGN that includes both direct and scattered components (e.g., pexrav or MyTorus; Magdziarz & Zdziarski 1995; Murphy & Yaqoob 2009), the expected contribution to the galaxy-wide emission above 10 keV can quickly approach 100%, and the intrinsic emission could be much higher than the observed luminosity inferred by Chandra.
Following a similar approach to that taken for the southern nucleus in NGC 3256, we tested the influence that the nuclear source in NGC 3310 would have on the 7–30 keV emission, if it were truly an AGN, by extrapolating the Chandra spectrum through to the NuSTAR band. The black hole mass of NGC 3310 is currently poorly constrained, but has been estimated via gas kinematics to be (5–40) , which implies an Eddington luminosity of (6–50) erg s-1 (Pastorini et al. 2007). The 2–10 keV luminosity of the source, as measured by Chandra, is erg s-1, implying –. From Younes et al. (2011), this implies an intrinsic photon index of 1.5–2.2. Following the approach used for the southern nucleus of NGC 3256, we fit the Chandra spectrum of the NGC 3310 nuclear source using an absorbed plasma plus an absorbed power-law model (tbabs*apec+ tbabs*powerlaw in XSPEC) with the plasma temperature fixed at 0.3 keV and the power-law slope fixed at . These parameters yielded a good fit to the data for column densities cm-2 and cm-2.
In the right panel of Figure 4, we show the Chandra spectrum for the nuclear source of NGC 3310 and the best-fit model extrapolated across the full 0.3–30 keV band. It is clear that the nuclear source is expected to provide a non-negligible contribution to the X-ray emission above 4–5 keV. Based on our extrapolated model, the point-source makes a fractional contribution of 3% of the galaxy-wide emission at keV and reaches a maximum contribution of 30–100% in the 20–30 keV band. If we revist our fits to the galaxy-wide spectrum performed in 4.1 and now fix the diffuse component and best-ftting model for the nuclear source, we find that the remaining spectrum associated with the bright point sources can be well characterized by a broken power-law with parameters consistent with those presented in Table 1.
4.4. Spatially Extended NuSTAR Emission for NGC 3310
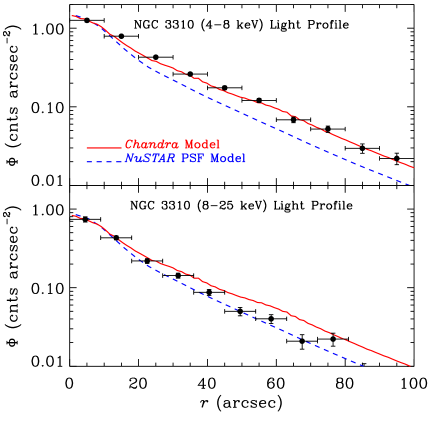
Although the NuSTAR PSF is too large to identify individual X-ray point sources in the galaxies studied here, it is sufficient for identifying extended features due to the 50 arcsec wide distribution of point sources throughout NGC 3310. To test for extended NuSTAR emission, we first constructed a spatial model of the expected NuSTAR emission profile within a bandpass that overlapped with Chandra (i.e., 4–8 keV), and then tested to see how the NuSTAR emission profile changed in a bandpass above the Chandra response (i.e., 8–25 keV). If the X-ray SEDs of the underlying point sources were all similar, we would expect the profile to remain the same for the soft and hard bands. Using the positions and relative 4–8 keV Chandra count-rates for the point sources, we constructed a model distribution map of NuSTAR counts. This map was constructed by co-adding NuSTAR PSF images centered at the locations of the Chandra point sources, with normalizations scaled by the 4–8 keV Chandra count-rates. Throughout this process, our NuSTAR PSFs were constructed by accounting for the off-axis angles of the sources and include errors associated with variations in off-axis angle due to the motions of the mast. We note that some relative astrometric offset is expected to be present between the NuSTAR and Chandra data. In order to estimate this error, we fit Gaussian profiles to both the NuSTAR 4–8 keV image emission and the Chandra-based model distribution map to identify the location of the peak emission. We then extracted the emission profiles for the images and models and compared them.
In Figure 5, we show the spatial distribution of NuSTAR counts for the 4–8 keV and 8–25 keV bands. The expected distributions for the Chandra-based model (described above) and an individual point-source PSF model have been overplotted for comparison. By construction, the 4–8 keV NuSTAR emission profile follows the Chandra-based model well and is statistically inconsistent with a single point source. However, at 8–25 keV, the NuSTAR emission profile is more consistent with a single point-source (i.e., the NuSTAR PSF) than with the Chandra-based model, implying that the central region of NGC 3310 contains a harder X-ray spectrum (across 8–25 keV) compared to point-sources in the outskirts of the galaxy. Our spectral extrapolation of the nuclear source presented in 4.3 and Figure 4 (right) shows that the fractional contribution that the source makes to the galaxy-wide emission increases with energy. It is also the case that the two sources in the outskirts of the galaxy (sources 1 and 9; see Fig. 3 and Table 2) have the steepest spectral slopes out of all nine point sources. Therefore, the hard spectra of the nuclear source and the five relatively hard non-nuclear sources that are within 20 arcsec of the galactic center are likely to be responsible for the transition to a more point-like emission profile with increasing energy. As we discussed above, we find a steep power-law slope at keV for the galaxy-wide spectrum of NGC 3310, which is steeper than the best fit single power-law slopes ( 0.3–2.0) derived for all five sources. This implies that, although the spectra of these sources may be intrinsically hard in the Chandra band, spectral turnovers at 3–10 keV must be typical of these sources, making it difficult to quantify the relative influences these sources have on the emission measured in the NuSTAR band.
5. Discussion
We have utilized nearly simultaneous Chandra and NuSTAR observations of the powerful local starburst galaxies NGC 3256 and NGC 3310 to investigate the nature of the X-ray-emitting components across the broad 0.3–30 keV bandpass. Similar to previous XMM-Newton and Chandra studies, we find significant 0.2–1 keV plasma emission that dominates the spectra of these galaxies out to 3 keV and 1 keV for NGC 3256 and NGC 3310, respectively. At the higher energies probed by NuSTAR ( keV), we find the majority of the emission is produced by populations of the brightest 5–10 ULXs. The cumulative spectra of both galaxies exhibit steep power-law slopes ( 2.6–2.7) above 3–6 keV that are similar to those found in NuSTAR studies of individual ULXs, implying that no strong hard component exists for either galaxy. This places stringent limits on the influence of possible AGN candidates in both galaxies, which are expected to have much flatter spectral slopes in this band. Sensible extrapolations of the Chandra spectra of AGN candidates in these galaxies, the southern nucleus of NGC 3256 and the nucleus of NGC 3310, indicate that these candidates provide only minority contributions to the galaxy-wide NuSTAR emission out to 30 keV. Regardless of extrapolation assumptions, our constraints indicate that the supermassive black holes in these galaxies are of low intrinsic luminosity and are accreting at the – Eddington levels. Our spectral constraints on NGC 3256 and NGC 3310 therefore provide first measurements of the 0.3–30 keV spectra of the non-AGN X-ray emitting populations within powerful starburst galaxies with high-sSFRs.
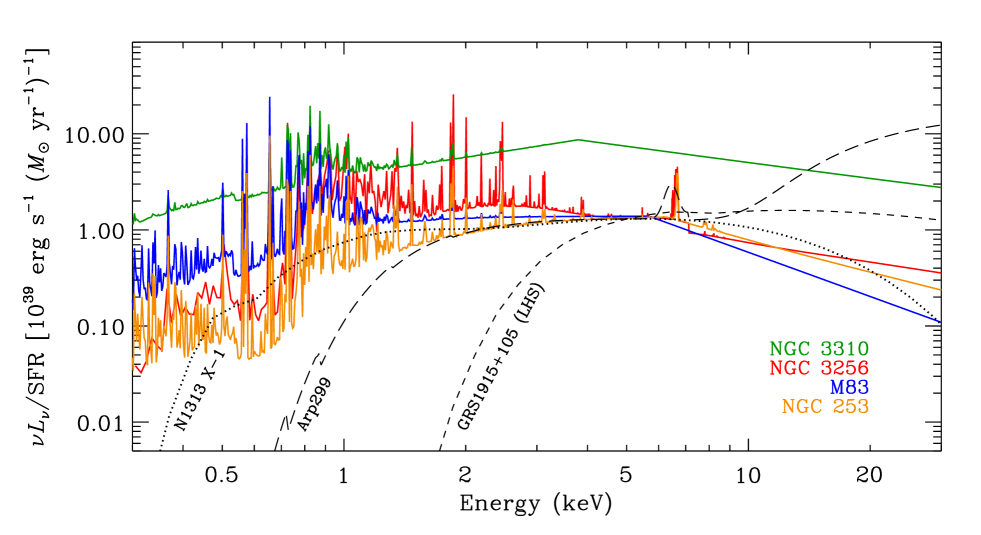
In Figure 6, we show the SFR-normalized best-fitting 0.3–30 keV SEDs (i.e., /SFR) of NGC 3256 and NGC 3310. For comparison, we also provide best-fit models for M83 (Yukita et al. in-preparation) and NGC 253 (Wik et al. 2014a), which were also constrained using nearly simultaneous observations with Chandra/XMM-Newton and NuSTAR. The displayed SEDs have not been corrected for intrinsic absorption and are therefore representative of the observed X-ray spectra. In the low-energy regime ( 2–3 keV), all four galaxies have significant contributions from line-emitting hot plasmas. With the exception of NGC 253 (orange curve) the SFR-normalized gas components have similar normalizations around 1 keV, consistent with previous studies that have found a direct scaling of the hot gas emission with SFR (see, e.g., Mineo et al. 2012b). Compared with the other three galaxies, NGC 253 is relatively edge-on ( deg), and therefore absorption is likely playing a role in the apparent deficit of hot gas emission in the galaxy.
At higher energies, 3–30 keV, we find that all galaxies, except for NGC 3310 (see discussion below), have SFR-normalized SEDs that are in good agreement with each other. For all four galaxies, the steepening of the spectral slope in the 6–30 keV range is clearly apparent. For M83, it appears that the spectral slope in this regime is somewhat steeper than it is for the other three galaxies. As discussed by Yukita et al. (in-preparation), the spectral shape of M83 is strongly influenced by a single variable ULX (see also Soria et al. 2012 for details on this source). For comparison, we have overlaid in Figure 6 the NuSTAR-constrained SEDs (scaled to the mean starburst galaxy emission at 5 keV) of the ULX NGC 1313 X-1 (Bachetti et al. 2013), the luminous black-hole X-ray binary GRS 1915+105 in the low/hard state (Miller et al. 2013), and the Compton-thick AGN in Arp 299 (Ptak et al. 2014). From this illustration, it is clear that the 10 keV starburst galaxy SEDs, including the turnover in spectral slope, are very similar to the SED of NGC 1313 X-1, a likely super-Eddington accreting ULX. Given the fact that ULXs clearly dominate the point source emission from this galaxy population, our observations constrain the average spectral shape for the ULX population, in general.
Interestingly, for NGC 3310, we observe a clear factor of 3–10 times excess X-ray emission per unit SFR over the 6–30 keV range. The excess is the result of an overabundance of ULXs in the galaxy compared to typical galaxies. From Mineo et al. (2012a), we expect that there would be 1–4 ULXs given the SFR of NGC 3310 (SFR 6 yr-1); however, 9 ULXs are clearly detected, indicated a significant excess in both the X-ray emission and the number of ULXs. In general, an excess of luminous X-ray binaries can be explained by either (1) a star-formation history that is heavily weighted towards an epoch when ULXs are expected to be most luminous due to the presence of the most massive donor stars (5–10 Myr) and/or (2) star-formation that is happening in low-metallicity environments, in which an excess population of black holes form (e.g., Linden et al. 2010).
HST-based studies of the young star cluster properties in NGC 3310, using SED fitting of UV–to–near-IR HST data, indicate a peak intensity in the recent star-formation history around 30 Myr ago (de Grijs et al. 2003a,b), well past the peak of ULX activity. Furthermore, similar star-cluster ages are also seen in NGC 3256 (e.g., Trancho et al. 2007), which suggests that the excess of luminous X-ray binaries in NGC 3310 is unlikely to be caused by differences in recent star-formation history alone. By contrast, the metallicity distribution of young star clusters in NGC 3310 has been estimated to peak at (de Grijs et al. 2003a,b), compared with for M83, NGC 253, and NGC 3256 (e.g., Zaritaas et al. 1994; Boselli et al. 2002; Bresolin et al. 2014; Trancho et al. 2007). The relatively low metallicity in NGC 3310 is the result of the recent cannibalization of a low-metallicity dwarf galaxy that triggered the current star-formation event. It is therefore plausible that the lower metallicity of NGC 3310 is the driving mechanism behind the excess of ULXs per unit SFR in this galaxy. Indeed, past studies of both the number of ULXs and galaxy-wide X-ray luminosity per unit SFR have revealed excesses at low metallicities (e.g., Mapelli et al. 2009; Prestwich et al. 2013; Basu-Zych et al. 2013b; Brorby et al. 2014). From the population synthesis models from Fragos et al. (2013b), galaxies with and are predicted to have SFR-normalized 2–10 keV luminosities of /SFR (1.1–3.4) erg s-1 and (3.5–11.2) erg s-1, respectively (e.g., see their Fig. 2). We measure corresponding values of /SFR erg s-1 and erg s-1, respectively, in very good agreement with the theoretical model predictions. We therefore favor metallicity as being the dominant underlying factor responsible for the observed 3–10 times excess X-ray emission per unit SFR in NGC 3310; however, future investigations of the properties of the immediate environments (i.e., characteristic stellar ages and metallicities) near the ULXs would help to better discriminate the roles that age and metallicity play in producing the excess ULX population.
References
- Alonso-Herrero et al. (2002) Alonso-Herrero, A., Rieke, G. H., Rieke, M. J., & Scoville, N. Z. 2002, AJ, 124, 166
- Bachetti et al. (2013) Bachetti, M., Rana, V., Walton, D. J., et al. 2013, ApJ, 778, 163
- Balick & Heckman (1981) Balick, B., & Heckman, T. 1981, A&A, 96, 271
- Basu-Zych et al. (2013) Basu-Zych, A. R., Lehmer, B. D., Hornschemeier, A. E., et al. 2013a, ApJ, 762, 45
- Basu-Zych et al. (2013) Basu-Zych, A. R., Lehmer, B. D., Hornschemeier, A. E., et al. 2013b, ApJ, 774, 152
- Bell et al. (2003) Bell, E. F., McIntosh, D. H., Katz, N., & Weinberg, M. D. 2003, ApJS, 149, 289
- Boselli et al. (2002) Boselli, A., Lequeux, J., & Gavazzi, G. 2002, A&A, 384, 33
- Bresolin et al. (2005) Bresolin, F., Schaerer, D., González Delgado, R. M., & Stasińska, G. 2005, A&A, 441, 981
- Brorby et al. (2014) Brorby, M., Kaaret, P., & Prestwich, A. 2014, MNRAS, 441, 2346
- Calzetti (2013) Calzetti, D. 2013, Secular Evolution of Galaxies, 419
- Chandar et al. (2005) Chandar, R., Leitherer, C., Tremonti, C. A., et al. 2005, ApJ, 628, 210
- Cicone et al. (2014) Cicone, C., Maiolino, R., Sturm, E., et al. 2014, A&A, 562, A21
- Colbert et al. (2004) Colbert, E. J. M., Heckman, T. M., Ptak, A. F., Strickland, D. K., & Weaver, K. A. 2004, ApJ, 602, 231
- de Grijs et al. (2003) de Grijs, R., Fritze-v. Alvensleben, U., Anders, P., et al. 2003a, MNRAS, 342, 259
- de Grijs et al. (2003) de Grijs, R., Anders, P., Bastian, N., et al. 2003b, MNRAS, 343, 1285
- de Vaucouleurs et al. (1991) de Vaucouleurs, G., de Vaucouleurs, A., Corwin, H. G., Buta, R. J., Paturel, G., & Fouque, P. 1991, Volume 1-3, XII, 2069 pp. 7 figs.. Springer-Verlag Berlin Heidelberg New York
- Díaz et al. (2000) Díaz, A. I., Álvarez, M. Á., Terlevich, E., et al. 2000, MNRAS, 311, 120
- Dickey & Lockman (1990) Dickey, J. M., & Lockman, F. J. 1990, ARA&A, 28, 215
- Done et al. (2007) Done, C., Gierliński, M., & Kubota, A. 2007, A&A Rev., 15, 1
- Doyon et al. (1994) Doyon, R., Joseph, R. D., & Wright, G. S. 1994a, ApJ, 421, 101
- Doyon et al. (1994) Doyon, R., Wright, G. S., & Joseph, R. D. 1994b, ApJ, 421, 115
- Elmegreen et al. (2002) Elmegreen, D. M., Chromey, F. R., McGrath, E. J., & Ostenson, J. M. 2002, AJ, 123, 1381
- Emonts et al. (2014) Emonts, B., Piqueras-Lopez, J., Colina, L., et al. 2014, arXiv:1409.4468
- English et al. (2003) English, J., Norris, R. P., Freeman, K. C., & Booth, R. S. 2003, AJ, 125, 1134
- Fragos et al. (2013) Fragos, T., Lehmer, B., Tremmel, M., et al. 2013a, ApJ, 764, 41
- Fragos et al. (2013) Fragos, T., Lehmer, B. D., Naoz, S., Zezas, A., & Basu-Zych, A. 2013b, ApJL, 776, L31
- Graham et al. (1984) Graham, J. R., Wright, G. S., Meikle, W. P. S., Joseph, R. D., & Bode, M. F. 1984, Nature, 310, 213
- Harrison et al. (2013) Harrison, F. A., Craig, W. W., Christensen, F. E., et al. 2013, ApJ, 770, 103
- Heckman et al. (2000) Heckman, T. M., Lehnert, M. D., Strickland, D. K., & Armus, L. 2000, ApJS, 129, 493
- Jarrett et al. (2003) Jarrett, T. H., Chester, T., Cutri, R., Schneider, S. E., & Huchra, J. P. 2003, AJ, 125, 525
- Jenkins et al. (2004) Jenkins, L. P., Roberts, T. P., Ward, M. J., & Zezas, A. 2004, MNRAS, 352, 1335
- Kaaret (2014) Kaaret, P. 2014, MNRAS, 440, L26
- Karim et al. (2011) Karim, A., Schinnerer, E., Martínez-Sansigre, A., et al. 2011, ApJ, 730, 61
- Kinney et al. (1993) Kinney, A. L., Bohlin, R. C., Calzetti, D., Panagia, N., & Wyse, R. F. G. 1993, ApJS, 86, 5
- Kroupa (2001) Kroupa, P. 2001, MNRAS, 322, 231
- Lehmer et al. (2008) Lehmer, B. D., Brandt, W. N., Alexander, D. M., et al. 2008, ApJ, 681, 1163
- Lehmer et al. (2010) Lehmer, B. D., Alexander, D. M., Bauer, F. E., et al. 2010, ApJ, 724, 559
- Lehmer et al. (2013) Lehmer, B. D., Wik, D. R., Hornschemeier, A. E., et al. 2013, ApJ, 771, 134
- Lípari et al. (2000) Lípari, S., Díaz, R., Taniguchi, Y., et al. 2000, AJ, 120, 645
- Lira et al. (2002) Lira, P., Ward, M., Zezas, A., Alonso-Herrero, A., & Ueno, S. 2002, MNRAS, 330, 259
- Magdziarz & Zdziarski (1995) Magdziarz, P., & Zdziarski, A. A. 1995, MNRAS, 273, 837
- Mapelli et al. (2009) Mapelli, M., Colpi, M., & Zampieri, L. 2009, MNRAS, 395, L71
- Meurer (2000) Meurer, G. R. 2000, Massive Stellar Clusters, 211, 81
- Miller et al. (2013) Miller, J. M., Parker, M. L., Fuerst, F., et al. 2013, ApJL, 775, L45
- Mineo et al. (2012) Mineo, S., Gilfanov, M., & Sunyaev, R. 2012a, MNRAS, 419, 2095
- Mineo et al. (2012) Mineo, S., Gilfanov, M., & Sunyaev, R. 2012b, MNRAS, 426, 1870
- Miralles-Caballero et al. (2014) Miralles-Caballero, D., Díaz, A. I., Rosales-Ortega, F. F., Pérez-Montero, E., & Sánchez, S. F. 2014, MNRAS, 440, 2265
- Mitsuda et al. (1984) Mitsuda, K., Inoue, H., Koyama, K., et al. 1984, PASJ, 36, 741
- Moorwood & Oliva (1994) Moorwood, A. F. M., & Oliva, E. 1994, ApJ, 429, 602
- Murphy & Yaqoob (2009) Murphy, K. D., & Yaqoob, T. 2009, MNRAS, 397, 1549
- Norris & Forbes (1995) Norris, R. P., & Forbes, D. A. 1995, ApJ, 446, 594
- Pastorini et al. (2007) Pastorini, G., Marconi, A., Capetti, A., et al. 2007, A&A, 469, 405
- Pastoriza et al. (1993) Pastoriza, M. G., Dottori, H. A., Terlevich, E., Terlevich, R., & Diaz, A. I. 1993, MNRAS, 260, 177
- Pereira-Santaella et al. (2011) Pereira-Santaella, M., Alonso-Herrero, A., Santos-Lleo, M., et al. 2011, A&A, 535, A93
- Persic & Rephaeli (2002) Persic, M., & Rephaeli, Y. 2002, A&A, 382, 843
- Pietsch et al. (2001) Pietsch, W., Roberts, T. P., Sako, M., et al. 2001, A&A, 365, L174
- Prestwich et al. (2013) Prestwich, A. H., Tsantaki, M., Zezas, A., et al. 2013, ApJ, 769, 92
- Rana et al. (2014) Rana, V., Harrison, F. A., Bachetti, M., et al. 2014, arXiv:1401.4637
- Ranalli et al. (2008) Ranalli, P., Comastri, A., Origlia, L., & Maiolino, R. 2008, MNRAS, 386, 1464
- Remillard & McClintock (2006) Remillard, R. A., & McClintock, J. E. 2006, ARA&A, 44, 49
- Sakamoto et al. (2006) Sakamoto, K., Ho, P. T. P., & Peck, A. B. 2006, ApJ, 644, 862
- Sakamoto et al. (2014) Sakamoto, K., Aalto, S., Combes, F., Evans, A., & Peck, A. 2014, arXiv:1403.7117
- Sanders et al. (2003) Sanders, D. B., Mazzarella, J. M., Kim, D.-C., Surace, J. A., & Soifer, B. T. 2003, AJ, 126, 1607
- Shakura & Sunyaev (1973) Shakura, N. I., & Sunyaev, R. A. 1973, A&A, 24, 337
- Smith et al. (2001) Smith, R. K., Brickhouse, N. S., Liedahl, D. A., & Raymond, J. C. 2001, ApJL, 556, L91
- Smith et al. (2012) Smith, B. J., Swartz, D. A., Miller, O., et al. 2012, AJ, 143, 144
- Soria et al. (2012) Soria, R., Kuntz, K. D., Winkler, P. F., et al. 2012, ApJ, 750, 152
- Strickland et al. (2000) Strickland, D. K., Heckman, T. M., Weaver, K. A., & Dahlem, M. 2000, AJ, 120, 2965
- Strickland & Heckman (2007) Strickland, D. K., & Heckman, T. M. 2007, ApJ, 658, 258
- Strickland & Heckman (2009) Strickland, D. K., & Heckman, T. M. 2009, ApJ, 697, 2030
- Trancho et al. (2007) Trancho, G., Bastian, N., Miller, B. W., & Schweizer, F. 2007, ApJ, 664, 284
- Tzanavaris & Georgantopoulos (2007) Tzanavaris, P., & Georgantopoulos, I. 2007, A&A, 468, 129
- Walton et al. (2013) Walton, D. J., Fuerst, F., Harrison, F., et al. 2013, ApJ, 779, 148
- Walton et al. (2014) Walton, D. J., Harrison, F. A., Grefenstette, B. W., et al. 2014, arXiv:1402.2992
- Wehner et al. (2006) Wehner, E. H., Gallagher, J. S., Papaderos, P., Fritze-von Alvensleben, U., & Westfall, K. B. 2006, MNRAS, 371, 1047
- Wik et al. (2014) Wik, D. R., Lehmer, B. D., Hornschemeier, A. E., et al. 2014, arXiv:1411.1089
- Younes et al. (2011) Younes, G., Porquet, D., Sabra, B., & Reeves, J. N. 2011, A&A, 530, A149
- Zaritsky et al. (1994) Zaritsky, D., Kennicutt, R. C., Jr., & Huchra, J. P. 1994, ApJ, 420, 87
- Zenner & Lenzen (1993) Zenner, S., & Lenzen, R. 1993, A&AS, 101, 363