00 \SetVol582008
An X-Shooter view of the symbiotic star [JD2002] 11††thanks: Based on observations collected at the European Organisation for Astronomical Research in the Southern Hemisphere, Chile (291.D-5044(A)).
Hajduk1, M., Gromadzki2,3, M., Mikołajewska1, J., Miszalski4,5, B., and Soszyński6, I.1Nicolaus Copernicus Astronomical Center, ul. Bartycka 18, 00-716, Warsaw, Poland
e-mail:cinek@ncac.torun.pl,mikolaj@ncac.torun.pl
2Millennium Institute of Astrophysics, Av. Vicua Mackenna 4860, 782-0436, Macul, Santiago, Chile
3Universidad de Valparaíso, Av. Gran Bretaña 1111, Playa Ancha, Casilla, 5030, Chile
e-mail:mariusz.gromadzki@uv.cl
4South African Astronomical Observatory, PO Box 9, Observatory, 7935 Cape Town, South Africa
5Southern African Large Telescope Foundation, PO Box 9, Observatory, 7935 Cape Town, South Africa
e-mail:brent@saao.ac.za
6Warsaw University Observatory, Al. Ujazdowskie 4, 00-478 Warszawa, Poland
e-mail:soszynsk@astrouw.edu.pl
Month Day, Year
We aimed to verify the nature and derive the basic parameters of the symbiotic star candidate [JD2002] 11. For this purpose, we obtained and analysed an X-Shooter spectrum of [JD2002] 11. We also used optical and infrared photometry available for the object. Emission-line diagnostic ratios are characteristic of a dusty type symbiotic star and reveal a two-component nebula (low- and high-density). The spectral energy distribution is well fitted with a two-component blackbody spectrum with the respective temperatures of 1150 K and 600 K. The total luminosity of is consistent with the expected luminosity of a typical Mira star, embedded in an optically thick dust shell. We conclude that [JD2002] 11 is the ninth symbiotic star in total and only the second dusty type symbiotic star discovered in the Small Magellanic Cloud. binaries: symbiotic – planetary nebulae: general – stars: individual: [JD2002] 11 – Magellanic Clouds
1 Introduction
Symbiotic stars are the products of binary evolution of low mass stars. These systems comprise of a giant star and a compact (usually white dwarf) companion. The giant star looses mass via stellar wind or the Roche lobe, part of which is accreted by the hot component.
Most of symbiotic stars belong to the so-called S-type (stellar), showing the presence of stellar photospheres of normal red giants. In D-type (dusty) symbiotics the cool component is a Mira star enshrouded in a warm dust shell (Mikołajewska 2013).
Population of extragalactic symbiotic systems is important for our understanding of the symbiotic phenomenon, since the sample includes objects with known distances and with diverse chemical compositions. Currently, there are eight symbiotic stars known in the SMC (Belczyński et al., 2000; Oliveira et al., 2013; Miszalski et al., 2014). The only one D-type system in this galaxy was found by Oliveira et al. (2013). [JD2002] 11 is a D-type system candidate proposed by Hajduk et al. (2014).
In this paper we present spectroscopic observations of [JD2002] 11 obtained using X-Shooter mounted on the Very Large Telescope UT2. The spectrograph provides a stunning wavelength coverage, which we used to verify the symbiotic nature of the object.
2 Observations and data reduction
2.1 The X-Shooter spectrum
Two exposures of [JD2002] 11 were performed with X-Shooter in the UVB, VIS, and NIR arm in the nodding mode on October 13, 2013. An artificial strip was present in the second VIS frame and the observations were interrupted and repeated on the following night. However the rest of the data was not corrupted. The target was observed at the airmass of 1.6. Feige 110 was used as the flux standard, observed at the airmass of 1.1.
Three spectra of [JD2002] 11 in each arm were obtained on October 14, 2013 at the airmass of 1.6. Two exposures were performed in the nodding mode and one in the stare mode. The spectrum of GD 71, obtained at the airmass of 1.3, was used for flux calibration.
Seeing was slightly better during the first night (0.8 arcsec compared to 1.0 arcsec). Thin clouds were present on the sky on both nights.
Observations in three arms started simultaneously and took 865 s in the UVB arm, 930 s in the VIS arm, and 900 s in the NIR arm.
The observations of [JD2002] 11 were performed with the arcsec slit for the UVB arm and arcsec for the VIS and NIR arms. Resolution ranges from 5100 in the UVB and NIR arms to 8800 in the VIS arm. Flux standards were observed using the arcsec slit for each arm.
The data were reduced with the X-Shooter pipeline version 2.5.2 provided by ESO. This included the wavelength calibration, spectrum subtraction, and flux calibration. The spectra were reduced with the xsh_scired_slit_stare (UVB and VIS arms) and xsh_scired_slit_nod (NIR arm) recipes. The latter recipe allowed for optimal subtraction of the sky lines. The correction for the telluric lines was performed using the telluric standard observation using IRAF package111IRAF is distributed by the National Optical Astronomy Observatory, which is operated by the Association of Universities for Research in Astronomy (AURA) under cooperative agreement with the National Science Foundation..
The spectra taken at two nights were examined and compared. No significant differences were found. Thus we averaged all the spectra in each arm to achieve better signal to noise ratio. The VIS and NIR fluxes were increased by 6% relative to UVB fluxes to compensate for the smaller slit width. The relative flux calibration uncertainty of 5% was adopted from comparison of the response functions determined for the two nights. The line fluxes are presented in Table 1.
| [Å] | ident | [Å] | flux | flux error | der. flux |
|---|---|---|---|---|---|
| 3688.764 | H i | 3686.83 | 1.59 | 0.67 | 1.81 |
| 3693.654 | H i | 3691.56 | 1.39 | 0.56 | 1.58 |
| 3699.009 | H i | 3697.15 | 2.38 | 0.77 | 2.71 |
| 3705.942 | H i | 3703.86 | 2.79 | 0.82 | 3.17 |
| 3713.736 | H i | 3711.97 | 1.63 | 0.67 | 1.85 |
| 3723.657 | H i | 3721.94 | 2.67 | 0.31 | 3.02 |
| 3728.053 | [O ii] | 3726.03 | 13.85 | 0.75 | 15.71 |
| 3730.786 | [O ii] | 3728.82 | 14.98 | 0.80 | 16.98 |
| 3736.209 | H i | 3734.37 | 2.97 | 0.41 | 3.36 |
| 3751.918 | H i | 3750.15 | 3.25 | 0.39 | 3.68 |
| 3772.551 | H i | 3770.63 | 4.18 | 0.41 | 4.72 |
| 3799.820 | H i | 3797.9 | 5.23 | 0.42 | 5.88 |
| 3821.492 | He i | 3819.62 | 1.11 | 0.25 | 1.24 |
| 3837.252 | H i | 3835.39 | 7.62 | 0.51 | 8.53 |
| 3841.347 | [Fe v] | 3839.27 | 3.08 | 0.41 | 3.44 |
| 3870.663 | [Ne iii] | 3868.75 | 45.12 | 2.28 | 50.35 |
| 3890.906 | H i+ He | 3889.05 | 17.69 | 0.95 | 19.69 |
| 3893.039 | [Fe v] | 3891.28 | 5.75 | 0.56 | 6.40 |
| 3897.359 | [Fe v] | 3895.22 | 2.54 | 0.46 | 2.83 |
| 3969.395 | [Ne iii] | 3967.46 | 15.59 | 0.87 | 17.21 |
| 3971.999 | H i | 3970.07 | 17.38 | 0.94 | 19.18 |
| 4028.210 | He i | 4026.19 | 2.32 | 0.37 | 2.54 |
| 4070.753 | [S ii] | 4068.6 | 1.57 | 0.34 | 1.71 |
| 4103.718 | H i | 4101.74 | 27.48 | 1.40 | 29.90 |
| 4145.833 | He i | 4143.76 | 0.93 | 0.28 | 1.00 |
| 4342.570 | H i | 4340.74 | 49.67 | 2.50 | 52.71 |
| 4365.224 | [O iii] | 4363.23 | 33.82 | 1.72 | 35.81 |
| 4473.663 | He i | 4471.5 | 5.00 | 0.35 | 5.23 |
| 4687.721 | He ii | 4685.58 | 14.38 | 0.77 | 14.68 |
| 4703.835 | [Fe iii] | 4701.62 | 0.79 | 0.21 | 0.80 |
| 4715.942 | He i | 4713.17 | 3.56 | 0.38 | 3.63 |
| 4726.588 | [Ne iv] | 4724.15 | 2.97 | 0.39 | 3.02 |
| 4734.299 | [Fe iii] | 4733.93 | 1.49 | 0.41 | 1.51 |
| 4742.592 | [Ar iv] | 4740.17 | 1.43 | 0.39 | 1.45 |
| 4863.669 | H i | 4861.33 | 100.00 | 5.01 | 100.00 |
| 4924.261 | He i | 4921.93 | 0.99 | 0.23 | 0.99 |
| 4961.441 | [O iii] | 4958.91 | 79.71 | 3.99 | 78.79 |
| 4969.196 | [Fe vi] | 4967.32 | 0.94 | 0.28 | 0.93 |
| 4974.653 | [Fe vi] | 4972.5 | 0.96 | 0.29 | 0.95 |
| 5009.392 | [O iii] | 5006.84 | 237.39 | 11.87 | 233.31 |
| 5018.138 | He i | 5015.68 | 1.72 | 0.20 | 1.69 |
| 5147.379 | [Fe vi] | 5146.8 | 1.86 | 0.29 | 1.80 |
| 5178.143 | [Fe vi] | 5176.43 | 2.37 | 0.26 | 2.28 |
| 5311.436 | [Ca v] | 5309.11 | 0.78 | 0.19 | 0.74 |
| 5413.778 | He ii | 5411.52 | 0.97 | 0.24 | 0.91 |
| 5878.494 | He i | 5875.66 | 27.73 | 1.47 | 25.05 |
| 6303.668 | [O i] | 6300.34 | 4.25 | 0.33 | 3.72 |
| 6315.377 | [S iii] | 6312.1 | 1.14 | 0.25 | 1.00 |
| 6367.250 | [O i] | 6363.78 | 1.54 | 0.29 | 1.34 |
| 6551.608 | [N ii] | 6548.1 | 3.19 | 0.23 | 2.75 |
| 6566.161 | H i | 6562.77 | 464.46 | 23.22 | 399.41 |
| 6586.981 | [N ii] | 6583.5 | 9.06 | 0.49 | 7.78 |
| 6681.424 | He i | 6678.16 | 6.01 | 0.37 | 5.13 |
| 6719.922 | [S ii] | 6716.44 | 2.34 | 0.23 | 1.99 |
| 6734.357 | [S ii] | 6730.82 | 2.17 | 0.22 | 1.85 |
| 7068.701 | He i | 7065.25 | 18.67 | 0.95 | 15.57 |
| 7139.464 | [Ar iii] | 7135.8 | 3.58 | 0.23 | 2.97 |
| 7174.147 | [Ar iv] | 7170.86 | 0.39 | 0.10 | 0.32 |
| 7285.132 | He i | 7281.35 | 1.19 | 0.14 | 0.98 |
| 7323.767 | [O ii] | 7319.45 | 4.94 | 0.31 | 4.06 |
| 7334.073 | [O ii] | 7330.2 | 4.39 | 0.29 | 3.61 |
| 7755.305 | [Ar iii] | 7751.06 | 1.25 | 0.18 | 1.01 |
| 8442.368 | H i | 8438 | 0.36 | 0.14 | 0.28 |
| 8506.963 | H i | 8502.49 | 0.99 | 0.19 | 0.77 |
| 8549.716 | H i | 8545.38 | 1.16 | 0.19 | 0.90 |
| 8602.632 | H i | 8598.39 | 1.78 | 0.22 | 1.38 |
| 8669.150 | H i | 8665.02 | 1.69 | 0.22 | 1.31 |
| 8754.766 | H i | 8750.48 | 1.64 | 0.19 | 1.27 |
| 9019.435 | H i | 9015 | 4.20 | 0.29 | 3.22 |
| 9073.730 | [S iii] | 9068.6 | 3.58 | 0.24 | 2.74 |
| 9233.570 | H i | 9229.01 | 4.64 | 0.34 | 3.53 |
| 9536.008 | [S iii] | 9530.6 | 7.86 | 0.49 | 5.93 |
| 9550.665 | H i | 9545.97 | 8.71 | 0.52 | 6.57 |
| 10054.47 | H i | 10049.37 | 12.23 | 0.96 | 9.11 |
| 10127.69 | He ii | 10123.61 | 9.59 | 0.96 | 7.13 |
| 10835.97 | He i | 10829.894 | 182.39 | 9.13 | 133.59 |
| 10942.99 | H i | 10938.095 | 12.69 | 0.81 | 9.27 |
| 12823.65 | H i | 12818.08 | 29.85 | 1.61 | 21.21 |
2.2 Other observations
The spectrum of the object was also obtained with the Southern African Large Telescope (SALT) by Hajduk et al. (2014). The wavelength range of the spectrum is from 4332 Å to 7415 Å. The seeing during the observation was about 3 arcsec. [JD2002] 11 is spatially blended in this spectrum with an early-type background star, which gives rise to a continuum. Hydrogen and helium stellar lines are blended with the emissions, which may affect the measurements. Resolution of the spectrum was about 1000. Sensitivity curve from another night was used for flux calibration. Good agreement was achieved between SALT and X-Shooter fluxes (Table 2), though only the strongest lines are detected in the SALT spectrum.
| [Å] | ident | SALT flux | flux error | X-Shooter flux |
|---|---|---|---|---|
| 4342.570 | H i | 59.4 | 9.3 | 49.67 |
| 4365.224 | [O iii] | 25.8 | 7.8 | 33.82 |
| 4863.669 | H i | 100.0 | 9.1 | 100.00 |
| 4961.441 | [O iii] | 86.8 | 8.9 | 79.71 |
| 5009.392 | [O iii] | 250.1 | 14.8 | 237.39 |
| 5878.494 | He i | 24.4 | 4.1 | 27.73 |
| 6303.668 | [O i] | 19.0 | 4.1 | 4.25 |
| 6566.161 | H i | 442.3 | 22.3 | 464.46 |
| 6586.981 | [N ii] | 10.7 | 2.5 | 9.06 |
| 7068.701 | He i | 17.4 | 2.7 | 18.67 |
| 7139.464 | [Ar iii] | 7.3 | 2.6 | 3.58 |
[JD2002] 11 was detected by the Two Micron All Sky Survey (2MASS, Skrutskie et al., 2006), InfraRed Survey Facility (IRSF, Kato et al., 2007) Wide-Field Infrared Survey Explorer (WISE, Wright et al., 2010), Deep Near-Infrared Survey of the Southern Sky (DENIS, Epchtein et al., 1999), and Surveying the Agents of a Galaxy’s Evolution (SAGE-SMC) survey (Gordon et al., 2011) surveys (Table 3). The SMC was also covered by the Optical Gravitational Lensing Experiment (OGLE) survey (Udalski et al., 2008), which provides the lightcurve in the I and V bands covering the period from 1997 to 2014.
| instrument/band | wavelength [] | magnitude | uncertainty |
|---|---|---|---|
| OGLE V | 0.54 | 21.554 | 0.289 |
| OGLE I | 0.79 | 19.55 | 0.126 |
| 2MASS J | 1.25 | 16.067 | 0.083 |
| 2MASS H | 1.65 | 14.07 | 0.04 |
| 2MASS Ks | 2.17 | 12.513 | 0.027 |
| WISE | 3.35 | 10.664 | 0.022 |
| IRAC | 3.6 | 10.465 | 0.013 |
| IRAC | 4.5 | 9.761 | 0.011 |
| WISE | 4.6 | 9.705 | 0.02 |
| IRAC | 5.8 | 9.146 | 0.012 |
| IRAC | 8 | 8.527 | 0.01 |
| WISE | 11.56 | 7.998 | 0.019 |
| WISE | 22.08 | 7.34 | 0.092 |
| MIPS | 24 | 6.98 | 0.02 |
3 Results

[JD2002] 11 resides in a region of an extended emission bright in the H i, [O iii] 4958/5007 Å, [O ii] 3726/3729 Å, and [S ii] 6716/6731 Å lines. The radial velocity of the background emission is similar to [JD2002] 11. The background emission most likely originates from the H ii (ionized) region DEM S 54. The background emission is smooth along the slit and was extracted along with the sky emission lines.
The X-Shooter UVB, VIS, and NIR flux calibrated spectra of [JD2002] 11 are shown in Figure 1. The spectrum of [JD2002] 11 shows emission lines superimposed on a featureless continuum, which rises toward longer wavelengths. The emission lines are not spatially resolved. Continuum and emission lines originate from the same position on the slit.
3.1 Hot component
The emission lines detected in the spectra of [JD2002] 11 are listed in Table 1. We did not detect the O vi Raman scattered lines at 6825 Å and 7088 Å in our spectra (Schmid, 1989). Their presence is restricted exclusively to symbiotic systems but not all symbiotics show these features.
The observed line flux ratio is somewhat higher than the value derived from the Case B recombination. The relative intensities of , , and emission lines show, that the main reason for this is self-absorption of the Balmer lines rather than the circum/interstellar extinction. Thus, for the extinction correction of the [JD2002] 11 spectrum we applied the reddening of E(B-V)=0.13 found for the ionized region DEM S 54 (Caplan et al., 1996). We find similar value of reddening for the flux ratio measured from the background emission. The observed and dereddened fluxes of the emission lines for [JD2002] 11 are shown in Table 1.
The detection of the He ii 4686 Å line indicates the presence of a relatively hot source in [JD2002] 11. Its temperature inferred from the He ii 4686 Å/ line flux ratio is about 100,000 K. This is confirmed by the identification of the [Fe vi] emission line in the spectrum (Table 1). Ionization of requires the photon energy of 75 eV.
The [S ii] 6716/6731 Å line ratio indicates an electron density of and the [O ii] 3726/3729 Å line flux ratio an electron density of .
The [O iii] 4363 Å emission line is relatively strong compared to the [O iii] 5007 Å line flux. The ratio of would require a spuriously high electron temperature under the electron density of about . The same applies to the [S iii] 6312/9069 Å line ratio of . This suggests that the bulk of the [O iii] 4363 Å and [S iii] 6312 Å flux originates from a region of high density of . The [Fe vi] 5176/5146 Å line ratio of indicates for (e.g. Nussbaumer & Storey 1978). He i and He ii line flux ratios also indicate . The [S ii] 6716/6731 Å and [O ii] 3726/3729 Å emission must originate from the more extended region of lower density. These lines are suppressed in the high density region where their critical densities are exceeded.
3.2 Cold component
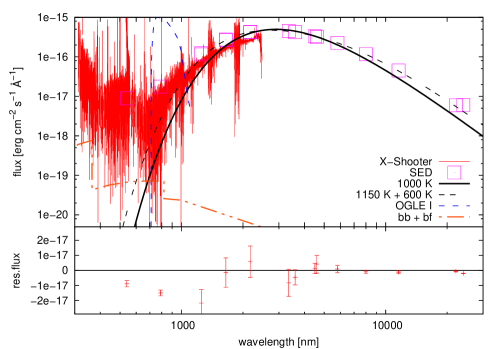
The spectral energy distribution (SED) of [JD2002] 11 is dominated by the infrared continuum emission (Figure 2). We fitted the datapoints with a single blackbody function and obtained the temperature of the emitting source of and the corresponding luminosity of , assuming the distance of to the SMC derived by Graczyk et al. (2014). The fit reproduced the maximum of the SED well, but left some residual emission shortward and longward of the maximum emission. More accurate fit was obtained with the sum of two blackbody functions with the temperatures of K and K. The respective luminosities and radii of the two shells are and , and , assuming that both shells are optically thick.
The two blackbody fit reproduces very well the observed flux between 1.25 and 22 (normalized of 0.23). The MIPS 24 data point appears to be overestimated and was not used for the fit. The SED is dominated by the dust emission. The contribution of the nebular continuum emission is negligible in the I and V bands. No trace of the Paschen/Balmer jump is detected in the observed spectra. We did not detect any molecular absorption bands in the visual and infrared spectra. The X-Shooter spectra show featureless continuum rising toward red.
Soszyński et al. (2011) obtained a period of 215.2 day and an amplitude of 0.344 in the I band for [JD2002] 11. The contribution of the variable source must be at least 30 % of the total flux in the I band during the photometric maximum for the observed amplitude. The contribution of the dust emission fitted with the two blackbody model to the I band flux is 30 % during the maximum. The contribution of the nebular continuum emission (Figure 2) and emission lines to the I band flux is negligible.
3.3 Line profiles
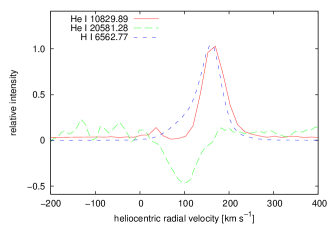
All spectral features in the X-Shooter spectrum are emissions except for two helium lines in the NIR region. The He i line at 10830 Å shows a P-Cygni profile, while He i 20581 Å line is seen only in absorption (Figure 4). Both lines originate from the metastable levels of the He i atom. The absorption components in the He i 10830 Å and 20581 Å lines are at heliocentric radial velocity of , while the average radial velocity of the emission lines in [JD2002] 11 is . The radial velocities of the absorption in the He i 10830 Å and 20581 Å lines are similar to the emission component observed at the blue wing of the hydrogen Balmer line (Figure 3).
The dense nebula is optically thick at the He i 10830 Å and 20581 Å lines. However, we would expect emission lines from both transitions unless it was formed at the line of sight of the (dust) thermal radiation emitted by the cold component. So either the absorption lines are formed in the dense nebula/accretion disk around the hot component, or in the outer part of the envelope of the cold component which is ionized by the hot component. In the former case, the hot component must have been placed in the line of sight to the cold component at the time when the X-Shooter observation was taken.
4 Discussion
The observational characteristics of the cool component confirms that it is a Mira. The luminosity of the cool component is typical for a Mira. Almost entire flux of the Mira component is reprocessed by the circumstellar dust, which is observed in the infrared. The period in the optical corresponds to the pulsational period of a Mira star. Soszyński et al. (2011) classified [JD2002] 11 as a semiregular variable rather than a Mira due to its low amplitude below 0.8 mag in the I band. However, small amplitude of the pulsations is typical for symbiotic miras.
The diagnostic line flux ratios of [O iii] 4363 Å/, [O iii] 5007 Å/, He i 6678 Å/5876Å, and He i 7065 Å/5876Å place [JD2002] 11 in the region occupied by the D-type symbiotic stars (Gutierrez-Moreno, 1995; Proga et al., 1994). [JD2002] 11 falls into the region occupied by heavily obscured D-type symbiotic stars in the (J-H) - (H-) colour-colour diagram (Feast et al., 1977). The presence of the two dust component is also typical for D-type symbiotic stars (Angeloni et al., 2010).
The near-infrared spectrum of [JD2002] 11 is typical for symbiotic Miras during high dust obscuration phase, e.g. V835 Cen (Feast et al. 1983). In particular, the molecular absorption bands are absent and dust emission dominates the continuum, which steeply rises toward infrared in both objects.

The pulsations in near-IR are present in V835 Cen and another symbiotic Mira, RX Pup, even during high dust-obscured phase while they are invisible in the optical (Feast et al., 1983; Mikolajewska et al., 1999). RX Pup is permanently embedded in an optically thick dusty shell and never shows evidence for a cool star shortwards of , and it also never shows pulsations in this range (Mikolajewska et al. 1999). This is because the spectrum shortwards of is dominated by a nebular emission. We do not observe the spectral signature of the cool star in [JD2002] 11 as well. The lack of pulsations in the V band may be caused by the contribution of the nebular lines and continuum. Since we do not observe any significant change (exceeding 0.1 mag) in the near-IR fluxes between 2MASS, IRSF and DENIS observations, we conclude that [JD2002] 11 is permanently obscured by dust.
[JD2002] 11 shows similar characteristics to a group of objects discussed by Rodríguez-Flores et al. (2014), which have been classified as D-type symbiotic stars. They show no direct evidence of the cold component in their optical spectra. Miszalski et al. (2013) identified some new D-type symbiotic stars for which no signature of cold component was found in the spectroscopy, but which show photometric variability.
P Cygni profile of the He i 10830 Å line are reported for two out of eight S-type symbiotic stars by Baratta et al. (1991). They attributed it to the variable wind from the hot component. They also observed He ii 10123 Å emission line for only two objects: high excitation symbiotic stars Z And and AG Peg.
The lightcurve of [JD2002] 11 reveals an irregular variability in addition to the 215 day Mira pulsation period, which is shown in Figure 4. We attribute this to the variability of Mira star since it dominates in this spectral region.
The period of 215 days is shorter than in any of the Galactic D-type symbiotic systems (Gromadzki et al., 2009). It is shorter than the shorthest pulsation period in the grid of evolutionary models for (single) AGB stars computed by Vassiliadis and Wood (1993) for the SMC (Z=0.004). However, LMC D-type systems show even shorter periods (Angeloni et al., 2014). The bolometric magnitude obtained for [JD2002] 11 of is slightly lower than the maximum luminosity for thermally pulsating AGB star of obtained by Vassiliadis and Wood (1993) for a star with a maximum period of 310 days. The period and luminosity of the giant in [JD2002] 11 suggest an initial mass of about , assuming that it evolved accordingly to single AGB evolutionary tracks. [JD2002] 11 obeys the period-luminosity relation derived by Groenewegen and Whitelock (1996).
We conclude that [JD2002] 11 is the ninth symbiotic star in total and only the second dusty type symbiotic star discovered in the Small Magellanic Cloud. it is located in the SMC bar. Interestingly, the other D-type symbiotic star is also placed in the SMC bar. However, the sample is too small to draw firm conclusions.
This work was financially supported by NCN of Poland through grants No. 2011/01/D/ST9/05966 and 719/N-SALT/2010/0. Some of the observations reported in this paper were obtained with the Southern African Large Telescope (SALT). MG acknowledges support from Joined Committee ESO and Government of Chile 2014 and the Ministry for the Economy, Development, and Tourisms Programa Inicativa Cientifica Milenio through grant IC 12009, awarded to The Millennium Institute of Astrophysics (MAS) and Fondecyt Regular No. 1120601. This publication makes use of data products from the Two Micron All Sky Survey, which is a joint project of the University of Massachusetts and the Infrared Processing and Analysis Center/California Institute of Technology, funded by the National Aeronautics and Space Administration and the National Science Foundation. This publication makes use of data products from the Wide-field Infrared Survey Explorer, which is a joint project of the University of California, Los Angeles, and the Jet Propulsion Laboratory/California Institute of Technology, funded by the National Aeronautics and Space Administration. his work is based in part on observations made with the Spitzer Space Telescope, which is operated by the Jet Propulsion Laboratory, California Institute of Technology under a contract with NASA. This publication makes use of VOSA, developed under the Spanish Virtual Observatory project supported from the Spanish MICINN through grant AyA2011-24052.
References
- [1] \refitemAngeloni, R., Ferreira Lopes, C. E., Masetti, N., et al.2014 MNRAS43835
- [2] \refitemAngeloni, R., Contini, M., Ciroi, S., and Rafanelli, P.2010 MNRAS4022075
- [3] \refitemBaratta, G. B., Neto, A. D., Rossi, C., and Viotti, R.1991A&A25175
- [4] \refitemBelczyński, K., Mikołajewska, J., Munari, U., Ivison, R. J., Friedjung, M.2000A&AS146407
- [5] \refitemCaplan, J., Ye, T., Deharveng, L., Turtle, A. J., and Kennicutt, R. C.1996A&A307403
- [6] \refitemEpchtein, N., et al.1999A&A349236
- [7] \refitemFeast, M. W, Robertson, B. S. C., and Catchpole, R. M.1977 MNRAS179499
- [8] \refitemFeast, M. W, Catchpole, R. M., Whitelock, P. A., Carter, B. S., and Roberts, G.1983MNRAS203373
- [9] \refitemGordon, K. D., Meixner, M., Meade, M. R., et al.2011AJ142102
- [10] \refitemGraczyk, D., Pietrzynski, G., Thompson, I B., et al.2014ApJ78059
- [11] \refitemGromadzki, M., Mikołajewska, J., Whitelock, P., and Marang, F.2009AcA59169
- [12] \refitemGroenewegen, M. A. T. and Whitelock, P. A.1996 MNRAS2811347
- [13] \refitemGutierrez-Moreno, A., Moreno, H., and Cortes, G.1995PASP107462
- [14] \refitemHajduk, M., Gładkowski, M., and Soszyński, I.2014 A&A5618
- [15] \refitemKato, D., et al.2007PASP59615
- [16] \refitemMikołajewska, J., Brandi, E., Hack, W., et al.1999MNRAS305190
- [17] \refitemMikołajewska, J.2013in IAU SymposiumVol. 281IAU Symposium, ed. R. Di Stefano, M. Orio, and M. Moe, 162-165
- [18] \refitemMiszalski, B., Mikołajewska, J., and Udalski, A.2013 MNRAS4323186
- [19] \refitemMiszalski, B., Mikołajewska, J., and Udalski, A.2014 MNRAS44411
- [20] \refitemNussbaumer, H. & Storey, P. J.1978 A&A7037
- [21] \refitemOliveira, J. M., van Loon, J. T., Sloan, G. C., et al.2013MNRAS4283001
- [22] \refitemProga, D., Mikolajewska, J., and Kenyon, S. J.1994 MNRAS268213
- [23] \refitemRodríguez-Flores, E. R., Corradi, R. L. M., Mampaso, A., et al.2014A&A56749
- [24] \refitemShmid, H. M.1989A&A21131
- [25] \refitemSkrutskie, M. F., Cutri, R. M., Stiening, R., et al.2006AJ1311163
- [26] \refitemSoszyński, I., Udalski, A., Szymański, M. K., et al.2011 AcA61217
- [27] \refitemUdalski, A., Soszyński, I., Szymański, M. K., et al.2008 AcA58329
- [28] \refitemWright, E. L., Eisenhardt, P. R. M., Mainzer, A. K., et al.2010AJ1401868
- [29] \refitemVassiliadis, E. and Wood, P. R.1993ApJ413641
- [30]