SXDF-ALMA 1.5 arcmin2 deep survey. A compact dusty star-forming galaxy at z=2.5.
Abstract
We present first results from the SXDF-ALMA 1.5 arcmin2 deep survey at 1.1 mm using Atacama Large Millimeter Array (ALMA). The map reaches a 1 depth of Jy/beam and covers 12 H-selected star-forming galaxies at or . We have detected continuum emission from three of our H-selected sample, including one compact star-forming galaxy with high stellar surface density, NB2315-07. They are all red in the rest-frame optical and have stellar masses of log whereas the other blue, main-sequence galaxies with =10.0-10.8 are exceedingly faint, Jy ( upper limit). We also find the 1.1 mm-brightest galaxy, NB2315-02, to be associated with a compact ( kpc), dusty star-forming component. Given high gas fraction (44% or %) and high star formation rate surface density (126yr-1kpc-2), the concentrated starburst can within less than Myr build up a stellar surface density matching that of massive compact galaxies at , provided at least 19% of the total gas is converted into stars in the galaxy center. On the other hand, NB2315-07, which already has such a high stellar surface density core, shows a gas fraction (23%) and is located in the lower envelope of the star formation main-sequence. This compact less star-forming galaxy is likely to be in an intermediate phase between compact dusty star-forming and quiescent galaxies.
Subject headings:
galaxies: evolution — galaxies: high-redshift — galaxies: ISM1. Introduction
One of the fundamental questions in galaxy formation is when and how massive galaxies are formed at high redshift. Massive quiescent galaxies (QGs) already existed at when the cosmic star formation activity peaked (e.g. Kriek et al. 2009). They are extremely compact with an effective radius of only kpc in the rest-frame optical, which is a factor of 4–5 smaller than the size of local QGs at similar stellar masses. (e.g., Trujillo et al. 2007; van Dokkum et al. 2008; Newman et al. 2012). This discovery has challenged galaxy evolution theories and raised the major question of how the compact QGs subsequently grow in size. It has become widely accepted that the observed size evolution is due to a combination of two evolutionary channels: slow and fast modes. In the slow mode, new, larger quenched galaxies continuously add to quiescent population at (e.g., Williams et al. 2010; Belli et al. 2015). In the fast mode, compact star-forming galaxies (SFGs) are quenched to become compact QGs at and subsequently puff up through repeated dry minor mergers (e.g., Naab et al. 2009; van Dokkum et al. 2010). While the size growth of quiescent galaxies has been partially understood, the formation mechanisms of compact stellar components, in the fast mode, remain poorly done.
Theoretical studies predict that a 1 kpc scale core can be produced by dissipative processes such as gas-rich major mergers or disk instability-driven inflow within galaxies (Wuyts et al., 2010; Bournaud et al., 2011; Dekel & Burkert, 2014; Wellons et al., 2015). Such violent processes should happen on a short timescale so that external gas accretion does not re-grow galaxy disks. While typical massive SFGs have a large disk with kpc at (e.g., van der Wel et al. 2014), recent high-resolution ALMA imaging reveals that submillimeter bright galaxies (SMGs) have a dusty star-forming core whose size is four times smaller than their stellar component (Simpson et al. 2015, see also Ikarashi et al. 2014). Moreover, massive compact SFGs have been discovered at (e.g., Wuyts et al. 2011a; Barro et al. 2013; Tadaki et al. 2014) and their high stellar surface densities suggest that they can directly evolve into compact QGs without structural transformation, simply by quenching star formation. The number density evolution of compact SFGs supports the production of the observed number densities of compact QGs over the same epoch with a quenching timescale of 0.3–1.0 Gyr (Barro et al., 2013). Deep near-infrared slit spectroscopy also suggests that their dynamical masses are comparable to their stellar masses, indicating a short quenching timescale (Barro et al., 2014b; Nelson et al., 2014). All these results point towards an evolutionary scenario in the fast mode whereby extended SFGs evolve into compact SFGs through a violent starburst phase, and then become compact QGs on a short quenching timescale.

In this letter, we present 1.1 mm properties of SFGs at , along with the discovery of a galaxy with an extremely compact, dusty star-forming component. These are the first results from the SXDF-ALMA 1.5 arcmin2 deep survey, which is unconfused (FWHM=0″.5) and unbiased (i.e., blind) observations with Atacama Large Millimeter Array (ALMA). The ALMA observations target a part of the SXDF-UDS-CANDELS field, where Hubble Space Telescope (HST) high resolution images are available (Grogin et al., 2011; Koekemoer et al., 2011). We only focus on 12 SFGs identified by a H narrow-band imaging survey with Subaru Telescope (Tadaki et al., 2013; Kodama et al., 2013). Survey design and source catalog of the ALMA observations are described in detail in Kohno et al. in preparation. We assume the Chabrier initial mass function (IMF; Chabrier 2003) and adopt cosmological parameters of =70 km s-1 Mpc-1, =0.3, and =0.7.
2. Sample and Data
The SXDF-ALMA 1.5 arcmin2 deep survey consists of 19 pointings (Figure 1). The band 6 receivers were used in frequency range of 255–259, 271–275 GHz (1.1 mm). The data calibration are made using the Common Astronomy Software Application package (CASA; McMullin et al. 2007). We reconstruct a 1.1 mm continuum map with natural weighting. The synthesized beamsize and the rms level before the primary beam correction are 0″.530″.41 and 55 Jy/beam, respectively.
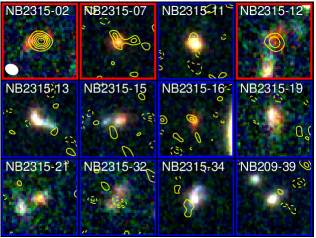
The SXDF-ALMA 1.5 arcmin2 deep field covers 11 H-selected SFGs at and one at (Figure 1). As they are carefully identified on the basis of the narrow-band excess and the broad-band colors for the line separation between H and [O iii], the redshift ranges are strongly-constrained by the width of narrow-band filters, . X-ray detected AGNs or galaxies with a power-low spectral energy distribution (SED) at IRAC four bands are not included in our sample (Tadaki et al., 2013).
First, we model their SEDs to measure the rest-frame and color () using the 3D-HST catalog with photometries at 18 bands (Skelton et al., 2014) and the EAZY code (Brammer et al., 2008). Next, we estimate the stellar mass and the amount of dust extinction for our sample by fitting the photometric SEDs with the stellar population synthesis model of Bruzual & Charlot (2003). The SED fitting is done using the FAST code (Kriek et al., 2009) with a solar metallicity, exponentially declining star formation histories (SFHs), and dust attenuation law of Calzetti et al. (2000). Following the recipe presented by Wuyts et al. (2011b), we adopt a minimum -folding time of 300 Myr. The uncertainties of the derived stellar mass are estimated from the 68% confidence interval. While the stellar mass tends to be the most robust parameter in SED modeling as long as single exponentially declining SFHs are assumed, the mass-to-light ratios could become smaller in 2-component SFHs with recent burst (Wuyts et al., 2007). The differences are smaller for redder galaxies because a new burst makes galaxies blue in the rest frame optical. In section 3.2, the stellar masses are used for determine dust temperatures. A higher stellar mass leads to a lower dust temperature and results in a higher gas mass, but does not significantly change it for red galaxies.
| ID | R.A. | Decl. | ||||||
|---|---|---|---|---|---|---|---|---|
| (J2000) | (J2000) | () | (yr-1) | (mJy) | () | (%) | ||
| NB2315-02 | 02 17 40.53 | 05 13 10.7 | 2.530.02 | 13.1 | 49595 | 2.060.13 | 10.3 | 44 |
| NB2315-07 | 02 17 42.67 | 05 13 58.4 | 2.530.02 | 8.9 | 4910 | 0.380.15 | 2.7 | 23 |
| NB2315-12 | 02 17 41.11 | 05 13 15.2 | 2.530.02 | 17.5 | 17420 | 1.340.15 | 8.1 | 32 |
Star formation rates (SFRs) are derived from H luminosities (Kennicutt, 1998) and SED-based extinctions, accounting for extra extinction toward Hii regions (Wuyts et al., 2013). The [Nii] contribution has been corrected on the basis of the measured equivalent width of H+[Nii] emission lines (Tadaki et al., 2013). We have also applied UNIMAP (Piazzo et al., 2015) and extraction methods as described in Lutz et al. (2011) to the archival Herschel-PACS data. We detect one source NB2315-02 at mJy, corresponding to a total infrared luminosity of log using a conversion factor at from PACS 160 m to , based on the Wuyts et al. (2011b) template. The PACS 160 m-based SFR is 414 yr-1 which is consistent with the H-based SFR of 495 yr-1.
3. Results
3.1. Detections in 1.1 mm continuum map
As the 1.1 mm continuum emission of SFGs at originates from thermal radiation of dust heated by massive stars, it serves as a good tracer of dusty star-forming regions within galaxies. For all 12 SFGs in our sample, we measure the flux densities within the 1″.5 apertures and estimate the noise from 2000 random apertures (Jy before the primary beam correction). We adopt a detection criterion in the same manner as Scoville et al. (2014). The probabilities where a negative 2 signal is detected by chance in the ALMA map is 2.2%. Three SFGs are associated with a 1.1 mm source with a significance (Figure 2). NB2315-02 and NB2315-12 are robustly detected above , and NB2315-07 are marginally done at 2.6. The spurious detection rates of 2.6 sources is 0.5%. Table 1 lists their measured flux densities along with stellar masses and SFRs. The other 9 SFGs do not have a significant 1.1 mm continuum emission and their upper limit is Jy after the primary beam correction.
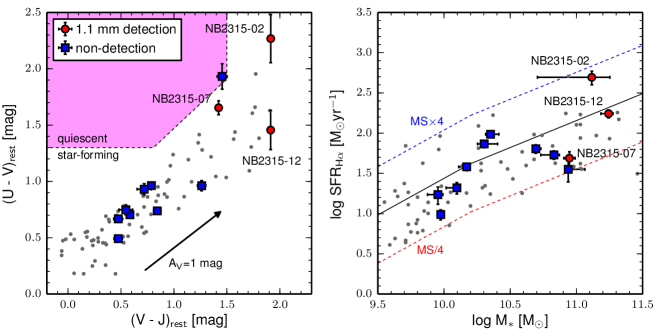
Our deep H narrowband selection covers wide ranges in colors and stellar mass of SFGs from blue, less massive to red, massive ones. The 1.1 mm-detected SFGs are redder in the rest-frame optical and more massive than the non-detected sample (Figure 3). The diagram is useful for distinguishing between dusty star-forming, unobscured star-forming, and quiescent galaxies (e.g., Wuyts et al. 2007). The three 1.1 mm sources are found to be dusty SFGs while most of SFGs without 1.1 mm detection fall in the unobscured star-forming regime, where also the bulk of galaxies satisfying the Lyman break criterion lies. One galaxy, which lies in the regime where quiescent galaxies dominate, is not detected above . NB2315-07 is also close to this regime compared to NB2315-02 and NB2315-12. Their lower position with respect to the main sequence supports that they are less star-forming galaxies. We stack the unconfused 1.1 mm maps in the positions of 8 non-detected objects excluding one less star-forming galaxy to investigate the existence of faint emission for typical main-sequence SFGs with =10.0-10.8. However, the deep stacked image does not show a significant emission and gives the upper limit of Jy.
3.2. Gas mass estimates
Measurements of 1.1 mm continuum flux densities, , allow us to derive gas masses of galaxies although there are uncertainties associated with dust temperature variations (e.g., Scoville et al. 2014; Genzel et al. 2015). We estimate the gas mass of our sample using a modified blackbody radiation model as,
| (1) |
where is dust-to-gas ratio, is the dust opacity per unit mass of interstellar medium (), is the Plank function, is the dust temperature, and is the luminosity distance. Here, g-1cm2 and are adopted (Scoville et al., 2014). We note that for local galaxies the scatter of dust-to-gas ratio is 0.28 dex at fixed metallicities (Rémy-Ruyer et al., 2014). Although a conversion from monochromatic submillimeter luminosity to gas mass (i.e., ) is not straightforward, observations of dust emission still have a big cost advantage over CO observations. Genzel et al. (2015) present scaling relations of dust temperature, gas fraction, and gas depletion timescale, by compiling CO and dust continuum data for each 500 galaxies over , and find dust temperatures to only change slowly with specific SFR (sSFR) in the narrow range around the main sequence (see also Magnelli et al. 2014). This scaling relation of dust temperatures is used for better estimates of the rest-frame 850 m fluxes from the observed 1.1 mm fluxes. The derived dust temperatures are 33, 28, and 30 K for NB2315-02, 07, and 12. The estimated gas masses and gas fractions, , are summarized in Table 1.
The 2 upper limit of our 1.1 mm survey corresponds to a gas mass of log in K at . Surprisingly, we do not detect the 1.1 mm emission from relatively less massive SFGs around the main-sequence although their gas mass is expected to be log based on the CO-based scaling relations of gas fraction with redshift, SFR, and stellar mass (Genzel et al., 2015). The non-detection could be partly caused by the usage of the fixed where the term of is canceled out on the right side of the equation (1). SFGs with lower metallicity should be fainter at 1.1 mm due to a lower dust-to-gas ratio than metal-rich ones, log (12+log(O/H)-8.67), (Leroy et al., 2011) even if they have the same gas mass. The mass-metallicity relation at predicts log for SFGs with log ()=10 (Wuyts et al., 2014). Moreover, although the used dust opacity has been calibrated mainly by using outliers above the main-sequence such as local ultraluminous infrared galaxies and bright SMGs at (Scoville et al., 2014), it is not necessarily appropriate for less massive normal SFGs at . Diffuse dust distributions within galaxies could lead to a low dust opacity (Dunne et al., 2003), resulting in faint 1.1 mm emission at fixed gas mass. Also, dust SEDs of SFGs are better described by a multi-temperature model including cool dust in diffuse ISM (dominating a dust mass) and warm dust in birth clouds (dominating a total infrared luminosity). Local normal SFGs have a cold component with K in a two-temperature model while a single-temperature model shows higher dust temperatures (Dunne et al., 2011).
Assuming log , g-1cm2 (Dunne et al., 2003), and K, the gas mass limit of our observations would become log . As the non-detections for less massive galaxies can be explained by a combination of these factors, it is difficult to determine whether the gas mass is actually as small as log with the 1.1 mm data alone.
3.3. Size measurements of dust emission
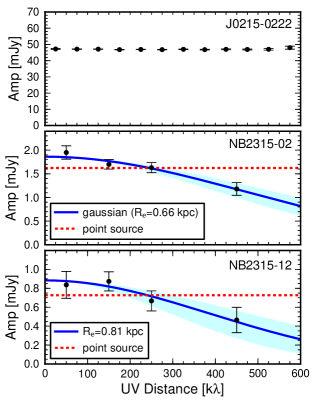
We measure the size of the dust emission for two 1.1 mm bright galaxies (NB2315-02 and NB2315-12) by fitting the visibility data in the plane. Their signal-to-noise ratios in the 1.1 mm map are in the flux density per synthesized beam to reliably constrain the size as the visibility coverage is similar as those by Ikarashi et al. (2014) and Simpson et al. (2015). Then, we assume two models, a circular Gaussian component and a point source. The uvamp task in MIRIAD (Sault et al., 1995) is used for calculating the visibility amplitudes averaged in annuli according to distance after shifting the phase center to the center position measured in the image plane and subtracting a clean component of another source in the primary beam with the uvmodel task. The phase calibrator, J0215-0222, shows constant amplitudes as a function of distance, suggesting a point source in the used antenna configuration (Figure 4). On the other hand, two SFGs of our sample seem to be resolved at 300 k. The gaussian fitting shows reduced chi-square values of 0.61 for NB2315-02 and 1.62 for NB2315-12 while the horizontal fitting (point source) does 5.76 and 2.60, respectively. Therefore, we adopt the gaussian model which is the same approach as previous studies (Ikarashi et al. 2014; Simpson et al. 2015). The best-fit results are FWHM=0″.16 ( kpc) for NB2315-02 and FWHM=0″.20 ( kpc) for NB2315-12. NB2315-02 surely has a compact, dusty star-forming component with 1 kpc at 3 significance. For a gaussian source with kpc, 80% (SFRHα=396 yr-1) of star formation traced by H is occurring within 1 kpc region. Then, the SFR surface density could be 126 yr-1kpc-2. It is also yr-1kpc-2 in the case of usage of the PACS 160m-based SFR. The gas surface density is similarly estimated from the total gas mass to be kpc-2, which probably causes an extremely red color due to strong extinction (Figure 3).
4. Discussion
We find NB2315-02 to have a high SFR surface density, 126 yr-1kpc-2, corresponding to SFR=396 yr-1 within a region of 1 kpc radius. The central stellar surface density will become comparable with compact SFGs/QGs, kpc (Barro et al., 2013), provided that the current star formation is maintained for another Myr in the galaxy center. This is plausible since it would need only 19% of the total gas mass (10.3) being converted into stars. Then, the gas depletion timescale, , is 207 Myr. Barro et al. (2014b) have also estimated dynamical masses of 13 compact SFGs from line widths of nebular emission (H or [O iii]) by near-infrared slit spectroscopy and derived similar gas depletion timescales (230 Myr). The agreement of the gas depletion timescales would support that the compact dusty SFG can be an immediate progenitor of the high stellar surface density SFGs.
In the WFC3/-band image, NB2315-02 has a sub-component with log , which is seen 5 kpc east of the main component with the H peak (Figure 2). The compact starburst region appears to be located in between the two components. Given the high gas surface density of kpc-2 in the compact dusty SFG, the rest optical morphology may be severely affected by strong attenuation. One likely interpretation is that the two components would constitute a single large SFG with a central dusty star formation. The gas fraction becomes % in this system including the companion. A physical process to reduce angular momentum is required in order to explain a concentrated gas distribution in a center of extended SFGs. In gas-rich disks at , gravitational torques and dynamical friction due to clumps can drive angular momentum out and cause mass inflow towards galaxy centers (Dekel & Burkert, 2014; Zolotov et al., 2015). Then, if the inflow timescale is shorter than the star formation timescale, a gas-rich, central starburst may form. The measured high gas fraction of the compact dusty SFG could support the possibility of such a dissipational process. Another possible explanation is we are witnessing a late-stage merger with 1:3 stellar mass ratio immediately before the final coalescence. Numerical simulations demonstrate that gas-rich mergers produce an instantaneous starburst at the final coalescence although it depends on merger parameters such as orbits of the two galaxies (Hopkins et al., 2013).
As compact SFGs are commonly defined by not high gas/dust surface densities but stellar ones (Barro et al., 2013, 2014a), they are likely to have already completed most of morphological transformation from extended disks to compact spheroids while compact dusty SFGs have not done yet. NB2315-07 of our sample shows a compact morphology with a circularized, effective radius of kpc at -band (van der Wel et al., 2014) and satisfies the conditions for compact SFGs, kpc and log ( -1.0 [Gyr (Barro et al., 2014a). The 1.1 mm-based gas fraction is 23%, which is smaller than that of the compact dusty SFG at 2 significance. Given the observed lower gas fraction and less star-forming properties shown in Figure 3, this compact less star-forming galaxy is likely to be already in a late stage of their evolutionary path to compact QGs.
In the fast quenching mode for galaxy evolution, we are looking a various compact objects in different evolutionary phases from dusty to quiescent through star-forming galaxies. Barro et al. (2014a) also present a diversity of compact SFGs from highly obscured (they are similar to compact dusty SFGs but already have a compact stellar core) to less star-forming ones (to which NB2315-07 belongs). The spatial extent of gas remaining within galaxies can provide key information about the subsequent evolution of compact SFGs. If gas is still concentrated in a galaxy center, compact SFGs are expect to exhaust all gas by a nuclear starburst or a feeding to a super massive black hole and then quench star formation. Deep and high-resolution submillimeter imaging with ALMA has great potential to address this issue.
We thank the anonymous referee who gave us a number of comments, which improved the Letter. This paper makes use of the following ALMA data: ADS/JAO.ALMA#2012.1.00756.S. ALMA is a partnership of ESO (representing its member states), NSF (USA) and NINS (Japan), together with NRC (Canada), NSC and ASIAA (Taiwan), and KASI (Republic of Korea), in cooperation with the Republic of Chile. The Joint ALMA Observatory is operated by ESO, AUI/NRAO and NAOJ. This work is based on observations taken by the 3D-HST Treasury Program (GO 12177 and 12328) with the NASA/ESA HST, which is operated by the Association of Universities for Research in Astronomy, Inc., under NASA contract NAS5–26555. Data analysis were in part carried out on common use data analysis computer system at the Astronomy Data Center, ADC, of the National Astronomical Observatory of Japan. This work was supported by JSPS KAKENHI Grant Numbers 21340045, 24244015, and 25247019. RJI acknowledges support in the form of the ERC Advanced Grant, COSMICISM.
References
- Barro et al. (2013) Barro, G., Faber, S. M., Pérez-González, P. G., et al. 2013, ApJ, 765, 104
- Barro et al. (2014a) Barro, G., Faber, S. M., Pérez-González, P. G., et al. 2014a, ApJ, 791, 52
- Barro et al. (2014b) Barro, G., Trump, J. R., Koo, D. C., et al. 2014b, ApJ, 795, 145
- Belli et al. (2015) Belli, S., Newman, A. B., & Ellis, R. S. 2015, ApJ, 799, 206
- Bournaud et al. (2011) Bournaud, F., Chapon, D., Teyssier, R., et al. 2011, ApJ, 730, 4
- Brammer et al. (2008) Brammer, G. B., van Dokkum, P. G., & Coppi, P. 2008, ApJ, 686, 1503
- Bruzual & Charlot (2003) Bruzual, G., & Charlot, S. 2003, MNRAS, 344, 1000
- Calzetti et al. (2000) Calzetti, D., Armus, L., Bohlin, R. C., et al. 2000, ApJ, 533, 682
- Chabrier (2003) Chabrier, G. 2003, PASP, 115, 763
- Dekel & Burkert (2014) Dekel, A., & Burkert, A. 2014, MNRAS, 438, 1870
- Dunne et al. (2003) Dunne, L., Eales, S., Ivison, R., Morgan, H., & Edmunds, M. 2003, Nature, 424, 285
- Dunne et al. (2011) Dunne, L., Gomez, H. L., da Cunha, E., et al. 2011, MNRAS, 417, 1510
- Genzel et al. (2015) Genzel, R., Tacconi, L. J., Lutz, D., et al. 2015, ApJ, 800, 20
- Grogin et al. (2011) Grogin, N. A., Kocevski, D. D., Faber, S. M., et al. 2011, ApJS, 197, 35
- Hopkins et al. (2013) Hopkins, P. F., Cox, T. J., Hernquist, L., et al. 2013, MNRAS, 430, 1901
- Ikarashi et al. (2014) Ikarashi, S., Ivison, R. J., Caputi, K. I., et al. 2014, ArXiv e-prints, arXiv:1411.5038
- Kennicutt (1998) Kennicutt, Jr., R. C. 1998, ARA&A, 36, 189
- Kodama et al. (2013) Kodama, T., Hayashi, M., Koyama, Y., et al. 2013, in IAU Symposium, Vol. 295, IAU Symposium, ed. D. Thomas, A. Pasquali, & I. Ferreras, 74–77
- Koekemoer et al. (2011) Koekemoer, A. M., Faber, S. M., Ferguson, H. C., et al. 2011, ApJS, 197, 36
- Kriek et al. (2009) Kriek, M., van Dokkum, P. G., Labbé, I., et al. 2009, ApJ, 700, 221
- Leroy et al. (2011) Leroy, A. K., Bolatto, A., Gordon, K., et al. 2011, ApJ, 737, 12
- Lutz et al. (2011) Lutz, D., Poglitsch, A., Altieri, B., et al. 2011, A&A, 532, A90
- Magnelli et al. (2014) Magnelli, B., Lutz, D., Saintonge, A., et al. 2014, A&A, 561, A86
- McMullin et al. (2007) McMullin, J. P., Waters, B., Schiebel, D., Young, W., & Golap, K. 2007, in Astronomical Society of the Pacific Conference Series, Vol. 376, Astronomical Data Analysis Software and Systems XVI, ed. R. A. Shaw, F. Hill, & D. J. Bell, 127
- Naab et al. (2009) Naab, T., Johansson, P. H., & Ostriker, J. P. 2009, ApJ, 699, L178
- Nelson et al. (2014) Nelson, E., van Dokkum, P., Franx, M., et al. 2014, Nature, 513, 394
- Newman et al. (2012) Newman, A. B., Ellis, R. S., Bundy, K., & Treu, T. 2012, ApJ, 746, 162
- Piazzo et al. (2015) Piazzo, L., Calzoletti, L., Faustini, F., et al. 2015, MNRAS, 447, 1471
- Rémy-Ruyer et al. (2014) Rémy-Ruyer, A., Madden, S. C., Galliano, F., et al. 2014, A&A, 563, A31
- Sault et al. (1995) Sault, R. J., Teuben, P. J., & Wright, M. C. H. 1995, in Astronomical Society of the Pacific Conference Series, Vol. 77, Astronomical Data Analysis Software and Systems IV, ed. R. A. Shaw, H. E. Payne, & J. J. E. Hayes, 433
- Scoville et al. (2014) Scoville, N., Aussel, H., Sheth, K., et al. 2014, ApJ, 783, 84
- Simpson et al. (2015) Simpson, J. M., Smail, I., Swinbank, A. M., et al. 2015, ApJ, 799, 81
- Skelton et al. (2014) Skelton, R. E., Whitaker, K. E., Momcheva, I. G., et al. 2014, ApJS, 214, 24
- Tadaki et al. (2013) Tadaki, K.-i., Kodama, T., Tanaka, I., et al. 2013, ApJ, 778, 114
- Tadaki et al. (2014) Tadaki, K.-i., Kodama, T., Tanaka, I., et al. 2014, ApJ, 780, 77
- Trujillo et al. (2007) Trujillo, I., Conselice, C. J., Bundy, K., et al. 2007, MNRAS, 382, 109
- van der Wel et al. (2014) van der Wel, A., Franx, M., van Dokkum, P. G., et al. 2014, ApJ, 788, 28
- van Dokkum et al. (2008) van Dokkum, P. G., Franx, M., Kriek, M., et al. 2008, ApJ, 677, L5
- van Dokkum et al. (2010) van Dokkum, P. G., Whitaker, K. E., Brammer, G., et al. 2010, ApJ, 709, 1018
- Wellons et al. (2015) Wellons, S., Torrey, P., Ma, C.-P., et al. 2015, MNRAS, 449, 361
- Whitaker et al. (2011) Whitaker, K. E., Labbé, I., van Dokkum, P. G., et al. 2011, ApJ, 735, 86
- Whitaker et al. (2014) Whitaker, K. E., Franx, M., Leja, J., et al. 2014, ApJ, 795, 104
- Williams et al. (2010) Williams, R. J., Quadri, R. F., Franx, M., et al. 2010, ApJ, 713, 738
- Wuyts et al. (2014) Wuyts, E., Kurk, J., Förster Schreiber, N. M., et al. 2014, ApJ, 789, L40
- Wuyts et al. (2010) Wuyts, S., Cox, T. J., Hayward, C. C., et al. 2010, ApJ, 722, 1666
- Wuyts et al. (2007) Wuyts, S., Labbé, I., Franx, M., et al. 2007, ApJ, 655, 51
- Wuyts et al. (2011a) Wuyts, S., Förster Schreiber, N. M., van der Wel, A., et al. 2011a, ApJ, 742, 96
- Wuyts et al. (2011b) Wuyts, S., Förster Schreiber, N. M., Lutz, D., et al. 2011b, ApJ, 738, 106
- Wuyts et al. (2013) Wuyts, S., Förster Schreiber, N. M., Nelson, E. J., et al. 2013, ApJ, 779, 135
- Zolotov et al. (2015) Zolotov, A., Dekel, A., Mandelker, N., et al. 2015, MNRAS, 450, 2327