Spin-mediated dissipation and frequency shifts of a cantilever at milliKelvin temperatures
Abstract
We measure the dissipation and frequency shift of a magnetically coupled cantilever in the vicinity of a silicon chip, down to mK. The dissipation and frequency shift originates from the interaction with the unpaired electrons, associated with the dangling bonds in the native oxide layer of the silicon, which form a two dimensional system of electron spins. We approach the sample with a m-diameter magnetic particle attached to an ultrasoft cantilever, and measure the frequency shift and quality factor as a function of temperature and the distance. Using a recent theoretical analysis [J. M. de Voogd et al., arXiv:1508.07972 (2015)] of the dynamics of a system consisting of a spin and a magnetic resonator, we are able to fit the data and extract the relaxation time ms and spin density spins per nm2. Our analysis shows that at temperatures mK magnetic dissipation is an important source of non-contact friction.
Understanding the dissipation and frequency shifts in magnetic force experiments is crucial for the development of magnetic imaging techniques, e.g. Magnetic Resonance Force Microscopy (MRFM). The sensitivity of such techniques depends on the friction of the cantilevers, which therefore has increased the interest in high-quality cantilevers with quality factors exceeding a million Tao et al. (2014). However, the quality factor reduces due to non-contact friction with the scanned sample which is explained by dielectric fluctuations Kuehn et al. (2006). Far from the surface, magnetic dissipation from paramagnetic spins or nanomagnets on the cantilever have been observed to have a large effect on the friction Stipe et al. (2001a); Harris et al. (2003). Our report quantitatively analyzes the magnetic dissipation of a cantilever in the vicinity of a silicon chip, showing that this is the most significant non-contact friction at low temperatures for a magnet on cantilever geometry.
Magnetic Force Microscopy (MFM) measures the forces resulting from stray fields of a sample that is being scanned. The coupling of the tip with the magnetic field manifests itself as a shift in the resonance frequency of the cantilever and as additional dissipation which reduces its quality factor . For magnetic moments that do not change due to the magnetic tip itself, the frequency shifts are well understood. However, a more complicated model is required when the spins in the sample are paramagnetic, because the motion of the tip changes the direction of their magnetic moments Rugar et al. (1990).
In this paper, we show frequency shifts and dissipation resulting from the dangling electron bonds at the surface of a silicon substrate. We are able to extract the relaxation time of the electron spins, without using electron spin resonance techniques. Furthermore, we use our analysis to calculate the maximum possible dissipation for a state-of-the-art MRFM setup and diamond cantilever. We show that magnetic dissipation can cause a drop in quality factor, thereby decreasing the sensitivity of an MRFM experiment. We calculate that this dissipation is suppressed when using large external magnetic fields at low temperatures.
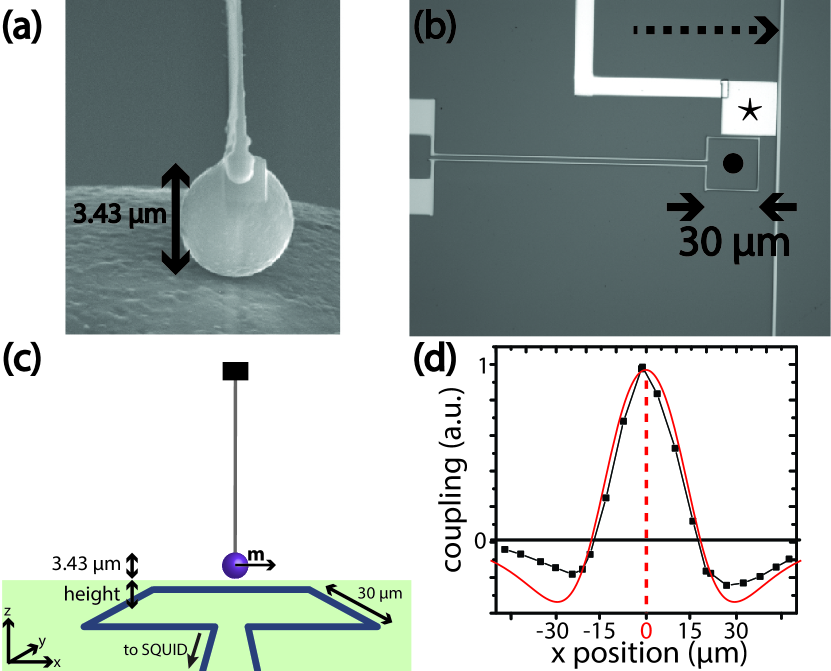
In our experiment, a magnet attached to a cantilever (Fig. 1a) couples via its magnetic field to magnetic moments originating from localized electron spins with near-negligible interactions. The coupling with a single spin can be associated with a stiffness , which results in a shift of the natural resonance frequency of the cantilever, according to , with the natural stiffness of the cantilever.
Commonly, the analysis of magnetic interaction Rugar et al. (2004) begins with the interaction energy . And one calculates the force and stiffness acting on the cantilever by taking the first and second derivative with respect to x, the direction of the fundamental mode of the cantilever. Assuming that is fixed by a large external field, one obtains in this approach a stiffness in the form of .
A recent detailed analysis by De Voogd et al. de Voogd et al. (2015), which starts with the Lagrangian of the full system, taking into account the spin’s dynamics as well as the influence of the mechanical resonator on the spin, suggests that the commonly employed model is not the correct approach for paramagnetic spins. For paramagnetic spins, the relaxation and the exact dynamics of the spin in the cantilever’s magnetic field determine the frequency shifts and dissipation. In the case of a two-dimensional system of paramagnetic spins, uniformly distributed over an infinite surface, the frequency shift and shift in the inverse quality factor can be written as:
| (1) |
| (2) |
| (3) |
Where is the temperature, is the Boltzmann constant and is the spin’s longitudinal relaxation time. The integral is performed over the infinite surface assuming a constant spin density . We have assumed , , and that the inverse of the transverse relaxation time is much smaller than the Larmor frequency, which is already the case when is larger than s.
In this paper, we detect the dangling bonds that are present on the surface of a silicon substrate of the detection chip using MFM down to mK. We use a commercial cryogen-free dilution refrigerator, in which we implemented several vibration isolation measures Den Haan et al. (2014). We are able to coarse approach towards the sample in three dimensions, with a range of mm in x, y and z. For this we employ three ‘PiezoKnobs’, from Janssen Precision Engineering B.V., while reading out the position using three capacitive sensors.
The cantilever is a silicon micro-machined IBM-type with length, width and thickness of 145 m, m and nm, respectively Chui et al. (2003); Mamin et al. (2003). The magnetic particle is a spherical particle from a commercial neodymium-alloy powder 111The neodymium-alloy powder is of type MQP-S-11-9-20001-070 by Magnequench, Singapore. We used platinum electron beam induced deposition using an in-house developed nanomanipulator Heeres et al. (2010) in a Scanning Electron Microscope (SEM) to attach the small magnetic particle on the free end of the cantilever and measured the diameter to be 3.43 m (Fig. 1a). Subsequently, we magnetized the magnet in the x-direction at room temperature in a field of T.
The readout of the cantilever’s motion is based on a Superconducting Quantum Interference Device (SQUID) which enables low temperature experiments Usenko et al. (2011). Where in conventional MFM setups a laser is used to readout the motion, our method is based on the motion of the magnetic particle in the vicinity of a small superconducting ‘pickup’ coil, giving a flux change whenever the cantilever moves (Fig. 1c). This signal is transformed by an on-chip transformer, which matches the pickup coil inductance to the high SQUID input inductance. The measured flux noise in the complete setup is less than , where is the flux quantum.
The substrate is high resistivity ( kcm) (100)-oriented n-type (phosphorus doped) silicon. The substrate is cleaned with acetone and DI water, which leaves an interface of silicon with its native oxide. To create the superconducting structures on the chip, NbTiN is grown on the silicon substrate with a thickness of roughly nm. Patterning is done using standard nano-lithographic techniques and reactive ion etching in a SF6/O2 plasma. For future MRFM experiments, we added a wire for radio-frequency currents and a nm thick copper layer capped with gold. The copper is connected via golden wire bonds to the sample holder, which itself is connected via a silver welded wire to the mixing chamber, ensuring good thermalization of the sample. Figure 1b shows an optical microscope image of the obtained structure.
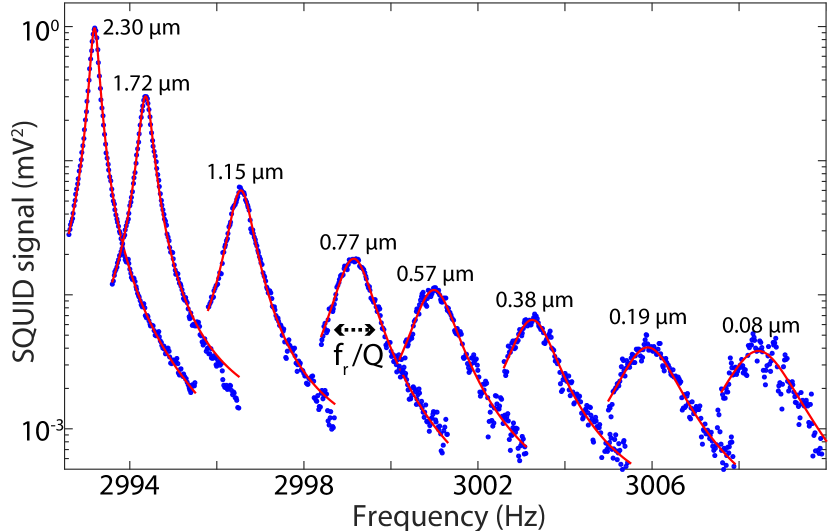
We drive the cantilever using a small piezo element glued to the cantilever holder. We sweep the drive frequency using a function generator around the resonance frequency while measuring the SQUID’s response using a Lock-In amplifier. We fitted the square of the SQUID’s signal with a Lorentzian curve in order to extract and . The amplitude of the Lorentzian is determined by the coupling between the magnet and the pickup coil, which is proportional to the energy coupling, and can be used to determine the position of the cantilever by scanning the cantilever in the xy-plane, see figure 1d.
For the experiment presented in this paper, we positioned the cantilever above the center of the pickup coil, to minimize possible repulsive forces from the superconducting wires. By gently decreasing the height of the cantilever until the signal is completely lost, we determine the relative height of the magnetic particle with respect to the surface. The sample holder is placed on a finestage, machined out of aluminum, which can be moved in all spatial directions by actuating laminated piezoelectric extension stacks. Using this, we can now have good control of the height up to the full range of the finestage of m 222The piezoelectric extension stacks are of type P-883.51 by Physik Instrumente GmbH and Co. KG. Germany. To determine the range of the finestage, we extrapolated data from reference Taylor et al., 2006 for the actuator constant from K to K..
We swept the drive frequency at a drive amplitude small enough to avoid non-linear responses of the cantilever’s motion, while measuring the SQUID signal. We measured with a sampling time of s every Hz. Fitting the data with a Lorentzian, we obtain and . At each height, the temperature was varied from the lowest achievable temperature mK, up to mK. Above mK, the aluminum shielding of the experiment starts to become non-superconducting. An example of the data with the Lorentzian fits at all used heights at mK is shown in figure 2.
| Height (m) | spin density (nm-2) | Relaxation time (ms) |
|---|---|---|
| mean: |
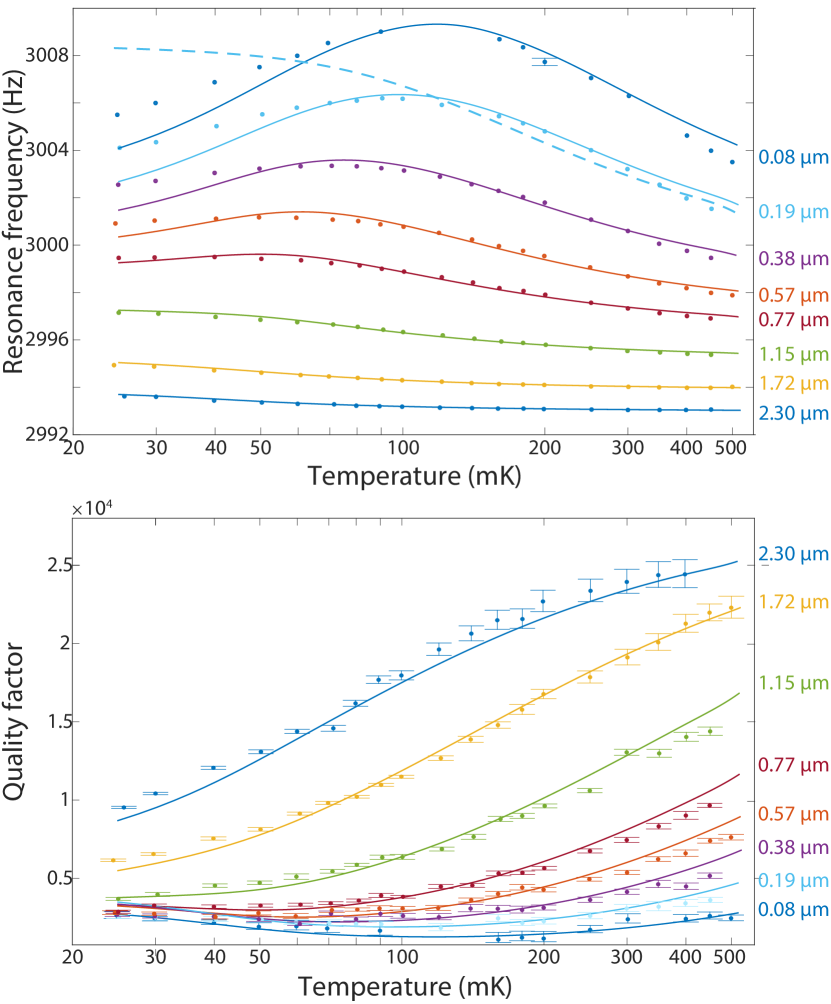
The results of our measurements described above are shown in figure 3 together with the fits according to equations (1) and (2). At every height and temperature we calculate the value for according to equation (3). The quality factor far from the surface . The stiffness Nm-1 of the cantilever is calculated using with kHz and kg. The effective mass is calculated using the geometry of the cantilever and the magnetic particle. The magnetic particle is taken as a spherical dipole with magnetic moment . According to the model, the temperature at which the resonance frequency close to the sample has a maximum, is independent of and , but is dependent on the absolute value of and the distance to the sample. We find JT-1. From this we find an effective saturation magnetization of T for a sphere that is fully magnetic. Alternatively we can assume T and an outer layer of nm which is magnetically dead. The magnetic moment of the dangling bonds Haneman (1968) is equal to the Bohr magneton JT-1.
The solid lines in figure 3 are fits to the data according to equations (1) and (2) with , and as the only fitting parameters. All fitting parameters are separately fitted for each height, for both the frequency data and the quality factor data. is a temperature independent parameter different for each height, which we attribute to an unknown mechanism, since the coupling to the SQUID is too small of an effect at these distances and has a height dependence with opposite sign to the one observed. The results of the fits for and can be found in table 1. We left as fitting parameter for each height, to verify the correctness of our analysis, since this number should be the same for each height. We see that slightly increases when the magnetic particle approached the surface, as is also observed for bulk spins in electron spin resonance experiments Stipe et al. (2001b). could depend on temperature, but by taking the ratio of equation (1) with equation (2) we extract for each measurement, and we find that is constant with temperature to within %. The average values of all individual fits are spins per nm2 and ms. The found value for is similar to values measured using Electron Paramagnetic Resonance Haneman (1968); Lemke and Haneman (1975).
The dashed line in figure 3 is the frequency shift calculated with the commonly used expression , with . Important is that for this curve, the spin density is ten times smaller than we find with our analysis.
The deviation of the data from the fit for low temperatures and small values for can be understood by considering that we do not have only spins at the surface. Electron spins inside the bulk will cause deviations to the fits, already when the density is in the order of spins per which is less than 1 ppm of the silicon atoms. Considering the nuclear spins, the % natural abundance of the 29Si isotope can only account for less than percent deviation.
Note that in electron spin resonance studies with our MRFM setup, a value for in the order of seconds was reported Vinante et al. (2011). With our new analysis we believe that it is possible that the reported long lived frequency shifts could be caused by nuclei polarized by interactions with these electron spins, and that these electron spins were actually much shorter lived, as is reported for nitroxide-doped perdeuterated polystyrene films Chen et al. (2013).
Our analysis suggests that the spin mediated dissipation is the main mechanism leading to a significant reduction in the quality factor of the cantilever. Previous work at higher temperatures Kuehn et al. (2006) reports dielectric fluctuations as the main non-contact dissipation mechanism. We do not see any evidence in our measurements for this. Possibly, the use of a laser in the setup to read out the cantilever causes extra charge fluctuations. Furthermore, we work at lower temperatures, where the large spin polarization enhances the magnetic dissipation and possibly reduce fluctuating charges.
We calculated the magnetic dissipation for a magnetic imaging experiments at higher temperature and a different tip-sample geometry. The results can be found in table 2. We used the experimental parameters for a state-of-the-art MRFM Degen et al. (2009). In this apparatus, the bare non-magnetic cantilever is centered approximately nm above a magnetic particle on the substrate, which is assumed for simplicity to be a spherical particle with a radius of nm. This setup is equivalent to a magnetic dipole attached to the cantilever itself approaching a surface with the shape of the cantilever. The magnetic dipole and external field are oriented in the z-direction while the fundamental mode of the cantilever is in the x-direction. For the cantilever, we used the parameters of a recently developed diamond cantilever Tao et al. (2014) which is shown to have at low temperatures an intrinsic quality factor , resonance frequency kHz and stiffness Nm-1. A spin density nm-2 is used, which is found in this report to be the density for the silicon surface, but it is also close to the typical values found for diamond surfaces Rosskopf et al. (2014). Only spins at the very end of the cantilever are considered since this surface contributes most to the dissipation, which is m thick and m wide. Although equation (1) cannot be used since we do not have a uniform infinite surface anymore, according to the original expressions de Voogd et al. (2015) one can continue to use equation (2) for the dissipation replacing the integral in equation (3) over the end of the cantilever. The relaxation time is chosen such that the dissipation is maximum: s.
Calculated quality factors () mK mK K T 0.49 0.20 0.98 T 1.50 0.19 0.91 T 1.50 1.50 1.17
The values in table 2 show that the magnetic dissipation could be an important source of non-contact friction. Furthermore we see that applying external fields can reduce the magnetic dissipation. Considering these calculations we believe that the magnetic dissipation we find at low temperatures can be avoided with the correct choice for the substrate and the use of large external magnetic fields.
To summarize, we have shown how the dissipation and frequency shift mediated by spins in magnetic force experiments can be fully understood. The new analysis suggest that in order to achieve higher sensitivity in magnetic imaging techniques, one should not only focus on improving the intrinsic losses of the micro-mechanical cantilever, but also on the reduction of electron spins in the sample. Furthermore we have shown how the spin’s relaxation time can be extracted without the use of resonance techniques. For silicon substrates with native oxides, we find a relaxation time of ms and a spin density of per nm2. The understanding of the spin mediated dissipation is important to further improve the mechanical resonators in magnetic imaging experiments.
Acknowledgements.
We thank D. J. Thoen, A. Endo and T. M. Klapwijk for fabricating the NbTiN detection chips, M. Azarkh for magnetizing the magnetic particle, A. Singh for support with sample fabrication and F. Schenkel, J. P. Koning and D. J. van der Zalm for technical support. We thank L. Bossoni, B. van Waarde and M. de Wit for proofreading the manuscript. This work was supported by the Dutch Foundation for Fundamental Research on Matter (FOM), and by a VICI fellowship by the Netherlands Organization for Scientific Research (NWO) to T.H.O. A. M. J. den Haan and J. J. T. Wagenaar contributed equally.References
- Tao et al. (2014) Y. Tao, J. M. Boss, B. A. Moores, and C. L. Degen, Nat. Commun. 5, 3638 (2014).
- Kuehn et al. (2006) S. Kuehn, R. F. Loring, and J. A. Marohn, Phys. Rev. Lett. 96, 156103 (2006).
- Stipe et al. (2001a) B. C. Stipe, H. J. Mamin, T. D. Stowe, T. W. Kenny, and D. Rugar, Phys. Rev. Lett. 86, 2874 (2001a).
- Harris et al. (2003) J. G. E. Harris, R. Knobel, K. D. Maranowski, A. C. Gossard, N. Samarth, and D. D. Awschalom, Appl. Phys. Lett. 82, 3532 (2003).
- Rugar et al. (1990) D. Rugar, H. J. Mamin, P. Guethner, S. E. Lambert, J. E. Stern, I. McFadyen, and T. Yogi, J. Appl. Phys. 68, 1169 (1990).
- Rugar et al. (2004) D. Rugar, R. Budakian, H. J. Mamin, and B. W. Chui, Nature 430, 329 (2004).
- de Voogd et al. (2015) J. M. de Voogd, J. J. T. Wagenaar, and T. H. Oosterkamp, (2015), arXiv:1508.07972 .
- Den Haan et al. (2014) A. M. J. Den Haan, G. H. C. J. Wijts, F. Galli, O. Usenko, G. J. C. Van Baarle, D. J. Van Der Zalm, and T. H. Oosterkamp, Rev. Sci. Instrum. 85, 035112 (2014).
- Chui et al. (2003) B. W. Chui, Y. Hishinuma, R. Budakian, H. J. Mamin, T. W. Kenny, and D. Rugar, in Transducers, Solid-State Sensors, Actuators and Microsystems, 12th International Conference on, 2003, Vol. 2 (2003) p. 1120.
- Mamin et al. (2003) H. J. Mamin, R. Budakian, B. W. Chui, and D. Rugar, Phys. Rev. Lett. 91, 207604 (2003).
- Note (1) The neodymium-alloy powder is of type MQP-S-11-9-20001-070 by Magnequench, Singapore.
- Heeres et al. (2010) E. C. Heeres, A. J. Katan, M. H. Van Es, A. F. Beker, M. Hesselberth, D. J. Van Der Zalm, and T. H. Oosterkamp, Rev. Sci. Instrum. 81, 023704 (2010).
- Usenko et al. (2011) O. Usenko, A. Vinante, G. Wijts, and T. H. Oosterkamp, Applied Physics Letters 98, 133105 (2011).
- Note (2) The piezoelectric extension stacks are of type P-883.51 by Physik Instrumente GmbH and Co. KG. Germany. To determine the range of the finestage, we extrapolated data from reference \rev@citealpnumTaylor2006 for the actuator constant from K to K.
- Haneman (1968) D. Haneman, Phys. Rev. 170, 705 (1968).
- Stipe et al. (2001b) B. C. Stipe, H. J. Mamin, C. S. Yannoni, T. D. Stowe, T. W. Kenny, and D. Rugar, Phys. Rev. Lett. 87, 277602 (2001b).
- Lemke and Haneman (1975) B. P. Lemke and D. Haneman, Phys. Rev. Lett. 35, 1379 (1975).
- Vinante et al. (2011) A. Vinante, G. Wijts, L. Schinkelshoek, O. Usenko, and T. H. Oosterkamp, Nat. Commun. 2, 572 (2011).
- Chen et al. (2013) L. Chen, J. G. Longenecker, E. W. Moore, and J. A. Marohn, Appl. Phys. Lett. 102, 132404 (2013).
- Degen et al. (2009) C. L. Degen, M. Poggio, H. J. Mamin, C. T. Rettner, and D. Rugar, Proc. Natl. Acad. Sci. U. S. A. 106, 1313 (2009).
- Rosskopf et al. (2014) T. Rosskopf, A. Dussaux, K. Ohashi, M. Loretz, R. Schirhagl, H. Watanabe, S. Shikata, K. M. Itoh, and C. L. Degen, Phys. Rev. Lett. 112, 147602 (2014).
- Taylor et al. (2006) R. P. Taylor, G. F. Nellis, S. A. Klein, D. W. Hoch, J. Fellers, P. Roach, J. M. Park, and Y. Gianchandani, in Advances in Cryogenic Engineering, Vol. 824 (AIP Publishing, 2006) pp. 200–207.