The IMF-sensitive 1.14-m Na i doublet in early-type galaxies
Abstract
We present J-band spectroscopy of passive galaxies focusing on the Na i doublet at 1.14 m. Like the Na i 0.82 m doublet, this feature is strong in low-mass stars and hence may provide a useful probe of the initial mass function (IMF). From high signal-to-noise composite spectra, we find that Na i 1.14 m increases steeply with increasing velocity dispersion, , and for the most massive galaxies ( 300 km s-1) is much stronger than predicted from synthetic spectra with Milky-Way-like IMFs and solar abundances. Reproducing Na i 1.14 m at high- likely requires either a very high [Na/H], or a bottom-heavy IMF, or a combination of both. Using the Na D line to break the degeneracy between IMF and abundance, we infer [Na/H] +0.5 and a steep IMF (single-slope-equivalent 3.2, where = 2.35 for Salpeter), for the high- galaxies. At lower mass ( = 50–100 km s-1), the line strengths are compatible with MW-like IMFs and near-solar [Na/H]. We highlight two galaxies in our sample where strong gravitational lensing masses favour MW-like IMFs. Like the high- sample on average, these galaxies have strong Na i 1.14 m; taken in isolation their sodium indices imply bottom-heavy IMFs which are hard to reconcile with the lensing masses. An alternative full-spectrum-fitting approach, applied to the high- sample, recovers an IMF less heavy than Salpeter, but under-predicts the Na i 1.14 m line at the 5 level. We conclude that current models struggle to reproduce this feature in the most massive galaxies without breaking other constraints, and caution against over-reliance on the sodium lines in spectroscopic IMF studies.
keywords:
galaxies: stellar content — galaxies: elliptical and lenticular, cD1 Introduction
Because the luminosity-vs-mass relation for stars is steeper than the distribution function of their masses, dwarf stars contribute very little to the integrated light from an old stellar population. However it has long been realised that some gravity-sensitive spectral features, which become extremely strong in late M dwarfs, provide a route to constraining the low-mass stellar content, and hence the initial mass function (IMF), in unresolved galaxies (e.g. Spinrad & Taylor 1971; Whitford 1977; Carter, Visvanathan & Pickles 1986). The Na i doublet absorption at 0.82 m is among the strongest and most readily accessible of these dwarf-star indicators.
Recent work has advanced this method using measurements with red-sensitive CCDs, large spectroscopic surveys, and improved near-infra-red (IR) instrumentation (e.g. van Dokkum & Conroy 2010; Spiniello et al. 2012; Conroy & van Dokkum 2012b; Smith, Lucey & Carter 2012; La Barbera et al. 2013). In parallel, more extensive stellar libraries (e.g. Rayner et al. 2008) and sophisticated spectral synthesis models (e.g. Conroy & van Dokkum 2012a, CvD12a; Vazdekis et al. 2012) have led to better quantification of the IMF sensitivity of various features, and the degeneracies with element abundance variations.
These studies found that the Na i 0.82 m doublet observed in massive early-type galaxies is much stronger than would be expected from an old stellar population with an IMF like that in the Milky Way, and with solar element abundances (van Dokkum & Conroy 2010; Spiniello et al. 2012; Conroy & van Dokkum 2012b; Fererras et al. 2013). The observations can be reproduced by adopting either a bottom-heavy IMF or a highly-enhanced sodium abundance, or a combination of both. As an example, for NGC 4621, the full-spectrum fitting analysis of Conroy & van Dokkum (2012b) requires an IMF with a mass-to-light ratio larger by a factor = 1.950.05, compared to the Milky Way IMF, and a sodium abundance [Na/H] = +0.840.04 (their figure 3). However, the results are sensitive to the spectral regions used in the fit: if Na i 0.82 m is excluded, they derive 1.2 for this galaxy, not much in excess of a Kroupa (2001) IMF ( = 1), while if the Ca ii triplet is also excluded, a heavy IMF is again recovered (their figure 12).
Since Na i 0.82 m plays an important role in the evidence for non-standard IMFs in massive galaxies, and because alternative model sets disagree in predicting the Na i 0.82 m and Na D line behaviour (Spiniello, Trager & Koopmans 2015), it is worthwhile not only to explore other indicators based on different atomic/molecular species (e.g. Spiniello et al. 2014), but also to test models against a wider set of observed sodium features.
In this Letter, we focus on the J-band Na i doublet absorption at 1.14 m. This line arises from atoms in the same energy level as Na i 0.82 m, and hence should have similar “fundamental” temperature and pressure dependence, although blending with other features inevitably affects the behaviours differently in practice (e.g., Na i 0.82 m coincides with a strong Ti O band). As expected, Na i 1.14 m is very strong in cool dwarf stars, and weak in giants (Rayner et al. 2008), yielding good predicted sensitivity to the IMF (Conroy & van Dokkum 2012a). No published work has yet analysed Na i 1.14 m in early-type galaxies, most IR studies to date having been made at longer wavelengths (Silva, Kuntschner & Lyubenova 2008; Marmol-Queraltó et al. 2009; Cesetti et al. 2009). For very nearby galaxies, accurate measurement of Na i 1.14 m is hampered by telluric water absorption at 1.11-1.16 m. Here, we study two samples of galaxies at modest distance ( = 0.02–0.06), so that Na i 1.14 m is redshifted into a cleaner atmospheric window. We use rest-frame stacking to build composite spectra, further suppressing the sky and telluric noise contributions.
As this is the first analysis of the Na i 1.14 m feature in this context, our treatment is exploratory in nature, and intended to capture the “first order” behaviour and to distinguish IMF from sodium abundance effects, rather than to provide an exhaustive treatment of all possible parameter degeneracies.
2 Data
We combine J-band data from two observational programmes to measure Na i 1.14 m over a wide range in galaxy mass, and derive Na D from optical survey spectroscopy for the same galaxies.
2.1 Subaru Coma sample
We obtained J-band spectra for 84 red-sequence galaxies in the Coma cluster, with velocity dispersions = 50–300 km s-1, using FMOS, the IR Fiber Multi-Object Spectrograph at the 8.2m Subaru Telescope (Kimura et al. 2010). The observations were made on the nights of 2014 April 9–10, in the “J-long” configuration, with spectral resolution 2400. The target galaxies, fibre configurations and observing strategy were the same as those used in the Y-band (“J-short”) observations reported by Smith et al. (2012b). Four fibre configurations were observed in cross-beam-switching mode, with fainter galaxies repeated on more configurations, for a total integration of up to 10.5 h per target.
Initial data reduction was performed using the standard FMOS fibre-pac pipeline (Iwamuro et al. 2012), yielding extracted, calibrated spectra for each fibre. A correction for telluric absorption was made using stars observed in the field simultaneously with the galaxy targets. Because the FMOS OH suppression mask removes significant parts of each spectrum, rest-frame stacking is essential to derive clean and continuous spectra from these observations. We constructed two independent composite spectra from the FMOS data, according to literature velocity dispersion measurements compiled by Smith et al. (2012a). The low- stack includes 32 galaxies with literature velocity dispersions in the range 50 100 km s-1, while the higher- stack has 52 galaxies with 100 300 km s-1. By bootstrap resampling the input spectra used in the stacking process, we computed a set of 100 alternative realisations of the composite spectra, which are used to estimate the errors, including systematic variation among galaxies within the stack. The signal-to-noise ratio () estimated from the bootstraps is 100 Å-1 (lower ) and 200 Å-1 (higher ) at 1.14 m.
2.2 VLT SNELLS lens-candidate sample
Very massive galaxies ( 300 km s-1) are not well represented in the Coma sample. Since these objects are of particular interest, given the evidence for non-standard IMFs in the most massive galaxies, we use a second dataset to sample this regime.
The observations for the high-mass sample were obtained for the “SNELLS” (SINFONI Nearby Elliptical Lens Locator Survey) project, a search for low-redshift strong-lensing galaxies among the massive early-type population (Smith, Lucey & Conroy 2015). The targets were drawn from the Six-degree Field (6dF) Peculiar Velocity Survey (Campbell et al. 2014), and the Sloan Digital Sky Survey (SDSS, Data Release 7, Abazajian et al. 2009), with primary selection on velocity dispersion, with 300 km s-1 and redshift 0.055. Galaxies with strong emission lines were excluded. We observed 26 candidate lenses in the J-band with the SINFONI integral-field spectrograph at the ESO 8.2 m VLT UT4. The largest image scale was used, to provide a field-of-view 88 arcsec2. The spectral resolution is 2000. The observations were optimized for efficiency in finding background line emitters, with two 600 sec exposures obtained per galaxy, offset spatially by 2.3 arcsec.
The spectrum for each galaxy was extracted from all spatial pixels with (absolute) total flux 50 per cent of the maximum, after subtracting the two datacubes to remove the background. This corresponds to an aperture of 1–2 arcsec2 in most cases. A telluric absorption correction was determined by fitting water and molecular oxygen transmission functions directly to the extracted spectrum, after dividing out a representative passive galaxy model spectrum. As with the FMOS data, we combine the SNELLS spectra in the rest frame to derive a clean composite spectrum, and compute bootstrap realisations to quantify the errors. The derived is 350 Å-1 at 1.14 m. The effective velocity dispersion, measured from the final J-band stack, is 2977 km s-1, slightly smaller than expected given the SDSS/6dF measurements.
Among the SNELLS galaxies are two which were confirmed as strong lensing systems (SNL-1 and SNL-2) by Smith et al. (2015). The lensing analysis shows that these two galaxies have mass-to-light rations similar to what is expected for a MW-like IMF. Specifically, the mass-excess factors, relative to the Kroupa IMF, are = 1.200.13 and = 0.940.17; hence bottom-heavy models are strongly disfavoured in these cases.
2.3 Optical spectra
To aid in interpreting the Na i 1.14 m observations, we also use optical spectra to measure the Na D line at 0.58 m. The data are drawn from the 6dF survey (for most of the SNELLS galaxies) and SDSS (for the Coma sample, and the remaining SNELLS galaxies). We created composite spectra and bootstrap realisations from the same galaxies as used in the FMOS and SNELLS stacks.
We note that the aperture sizes probed by the various datasets are not identical: the fibre sizes are 1.2 arcsec, 3 arcsec and 6.7 arcsec in diameter, for FMOS, SDSS and 6dF respectively, while the effective aperture for the SNELLS spectra is 1–2 arcsec. This is especially relevant when comparing the Na D measurements, taken from large apertures (SDSS and 6dF), against the J-band spectra obtained in small apertures from SNELLS and FMOS.
Although the SNELLS spectra are derived from IFU data, our observing strategy is not suited to extracting spectra at larger aperture to match the SDSS/6dF spectra. However, we can estimate the likely effect of aperture mismatch using Na D measured in a range of aperture sizes in data cubes from the CALIFA survey (Sánchez et al. 2012). For 22 elliptical galaxies in the CALIFA second data release, the Na D line strength is reduced by 9 per cent on average, with a scatter of 5 per cent, when the aperture size is increased by a factor of five. Correcting Na D upwards, to account for the smaller apertures in SNELLS and FMOS, does not affect our conclusions, as we show in Section 3.2.
3 Results
We present the results both through qualitative comparison of observed spectra against synthetic spectra, and through a more quantitative analysis using Lick-style line indices. In both approaches, we use improved versions of the CvD models, as described by Conroy, Graves & van Dokkum (2014).
3.1 Spectral comparison
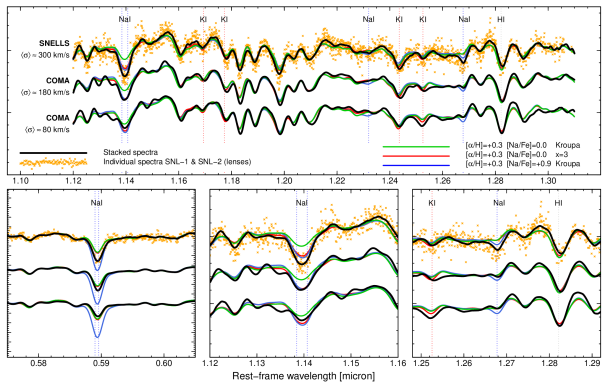
The stacked spectra from the FMOS and SNELLS samples, together with the corresponding Na D stacks, are shown in Figure 1, with illustrative model spectra for comparison. The FMOS stacks and the models have been smoothed to match the velocity dispersion of the SNELLS galaxies. Prominent spectral features in the J-band include the Na i 1.14 m doublet itself and the hydrogen Pa line at 1.28 m, as well as many other heavily blended metal lines (see Rayner et al. 2008 for identifications).
As a fiducial comparison, we consider the 13.5 Gyr model with Kroupa IMF and abundance pattern [/H] = +0.3; [Fe/H] = [Na/H] = 0. This model clearly under-predicts both the Na i 1.14 m and the Na D absorption in the SNELLS sample. The discrepancy is smaller in the FMOS stacks. The predicted Na i 1.14 m strength can be increased by adopting either a more bottom-heavy IMF or larger sodium abundances, but Na D is little affected by the IMF according to the CvD models. Hence some enhancement in [Na/H] is essential to match the SNELLS sample. This is supported by the noticeable presence of a weak Na i line at 1.27 m, which only becomes visible in models with high [Na/H]. Taken individually, the two gravitational lenses, SNL-1 and SNL-2, both have spectra consistent with the SNELLS high- composite, and in particular follow the behaviour of the stack in the Na D and Na i 1.14 m regions.
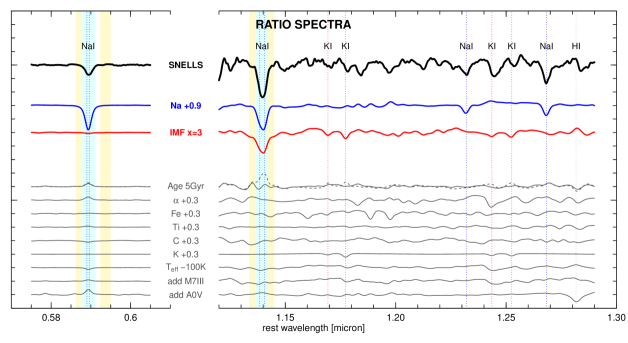
Figure 2 shows the ratio between the observed SNELLS stack and the fiducial model, compared to ‘response spectra’ showing the effect of some relevant stellar population parameters. The observed-vs-fiducial ratio spectrum confirms the excess absorption in the sodium lines, relative to the model. Only the [Na/H] and IMF responses have a strong impact on the Na i 1.14 m absorption. While either sodium enhancement or a bottom-heavy IMF could reproduce Na i 1.14 m, changes to these parameters lead to different predictions elsewhere, most notably at Na D, but also in the weak sodium lines at 1.23 m and 1.27 m, and the potassium doublets at 1.17 m and 1.25 m. Visual inspection of the Na i 1.14 m and Na D effects suggests a combination of sodium enhancement and bottom-heavy IMF is required for the high- galaxies, if the combined effect of other parameters (age, etc) can be neglected.
3.2 Line index comparison
To summarize the behaviour of the strong sodium lines, we have measured Na i 1.14 m and Na D using absorption indices. For Na D, we use the Lick definition from Trager et al. (1998), while for Na i 1.14 m, we adopt a feature band of 1.1367–1.1420 m, with pseudo-continua at 1.1337–1.1367 m and 1.1420–1.1450 m (see Figure 2). All of the results are robust to small changes to these bandpasses. For FMOS, the indices were measured after smoothing to match the velocity dispersion of the SNELLS stack. The index errors were derived from the bootstrap stacks, and hence explicitly include the galaxy-to-galaxy scatter within each sample.
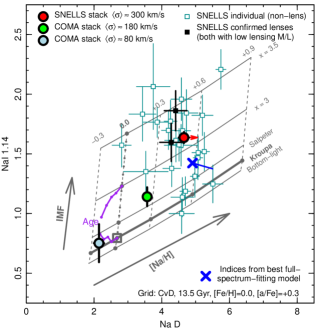
Figure 3 shows the measured indices, compared to a model grid spanning a range of [Na/H] and different IMFs. The indices were measured on the model spectra after smoothing to = 300 km s-1 to match the data. Note that the model grid is for [/H] = +0.3, which is appropriate for the SNELLS galaxies, but somewhat high for the FMOS stacks. (From optical spectra, the FMOS samples have average [Mg/Fe] = 0.15 and 0.24.)
The index–index diagram confirms and quantifies the results seen in the spectral comparisons: Na i 1.14 m increases strongly with galaxy mass, deviating far from the predictions for solar [Na/H] and MW-like IMFs. Na D also increases strongly with , but not steeply enough to match a constant IMF model. Instead, the diagram implies a combination of both increasing [Na/H] and increasing dwarf-star content. For the SNELLS stack, the grid suggests an IMF slope 3.1 [where the Salpeter (1955) slope is 2.35] and [Na/H] +0.5. Here, should be interpreted as a single-slope-equivalent value, since the detailed shape of the low-mass IMF is not constrained. Applying the CALIFA-derived aperture trend to correct Na D to the same aperture as used in the IR measurement, the inferred IMF slope would be reduced slightly, to 3.0, and the sodium abundance increased to [Na/H] +0.6. In the low- FMOS stack, comparison with a model grid at lower [/H] (not shown in the figure) leads to a derived [Na/H] –0.3, and an IMF consistent with either Kroupa or Salpeter. The run of [Na/H] is thus similar to that found from stacked SDSS spectra by Conroy, Graves & van Dokkum (2014), who report [Na/H] = –0.24 at = 87 km s-1 rising to [Na/H] = +0.43 at = 295 km s-1.
Na D is a resonance line, subject to contamination by interstellar absorption. Correcting for this would decrease the derived [Na/H] and increase the required . However Jeong et al. (2013) studied “Na D excess” objects from SDSS and concluded that the interstellar contribution is negligible for ordinary early-type galaxies. Note that for steep IMFs, assuming ages younger than the nominal 13.5 Gyr leads to weaker predicted absorption at Na i 1.14 m (and at Na D), and hence larger derived and [Na/H].
Figure 3 also shows the sodium indices for all of the individual SNELLS galaxies, highlighting the lenses SNL-1 and SNL-2. There is a wide spread in Na i 1.14 m among the sample, spanning the full range of model IMFs, at [Na/H] = 0.3–0.5. As expected from the similarity of their spectra to the SNELLS composite, SNL-1 and SNL-2 have line strengths consistent with the properties of the stack, yielding [Na/H] +0.4 and = 3.0–3.5. Thus despite having mass-to-light ratios consistent with a MW-like IMF, these galaxies have sodium indices characteristic of very steep IMF slopes, at least if interpreted using otherwise “vanilla” versions of the CvD models (old, -enhanced, other abundances solar).
4 Summary and discussion
The immediate result of this paper is that the Na i 1.14 m doublet is very strong in the most massive early-type galaxies. Synthetic models with Milky-Way-like IMF and solar [Na/H] fail to match the observed absorption. This behaviour is similar to that seen in the optical Na i 0.82 m doublet, and suggests that the optical results are not due to the specific spectral “environment”, e.g. contributions from the coincident Ti O band. Comparison with the CvD models suggests that reproducing the observed Na i 1.14 m requires high sodium abundances or bottom-heavy IMFs in massive galaxies. We show that consistent results for Na i 1.14 m and Na D can be obtained using a combination of both effects, with other parameters of the model held at plausible values. For galaxies with 300 km s-1, we derive [Na/H] +0.5 and an IMF with (single-slope-equivalent) 3. Two galaxies in our sample have strong-lensing masses compatible with an Milky-Way-like IMF, but their sodium indices imply steep IMFs as in the high- stack. If the IMF really was a single power-law, the spectroscopic exceeds the lensing constraint by a factor of 4. Alternative IMF shapes, can reduce but not eliminate the discrepancy (e.g. fig. 5 of Smith 2014). For example the broken power-law assumed by La Barbera et al. (2013) would yield 2.5
We stress that the mass discrepancy applies specifically to results from the sodium indices, and not the general approach of fitting CvD models to constrain the IMF. For example, we have applied the full spectral fitting machinery of Conroy et al. (2014) to an extended SNELLS composite spectrum, including wider optical coverage from 6dF/SDSS as well as SINFONI data in both J and H. The best-fitting model has a modest mass excess factor of 1.4, and [Na/H] +0.7, and fits well over most of the spectral range. This model has much more freedom than the simple grid shown in Figure 3, with additional parameters describing the abundance pattern, two variable low-mass IMF slopes, and various nuisance effects. The greater flexibility allows the fit to reach closer to the observed line strengths than would be expected from the grid, given the recovered Salpeter-like IMF, but the model still under-predicts the measured Na i 1.14 m index by 5.
Our results suggest that the CvD models do not yet reproduce the strong Na i 1.14 m in the most massive galaxies without violating other constraints (lensing masses, full-spectral fit). Such discrepancies in specific spectral features underline the advantage of combining many gravity-sensitive indicators (e.g. Na i, Ca ii, Fe H) in deriving spectroscopic constraints on the IMF. They may also help to identify limitations in the current models, and the corresponding opportunities for future improvements to the method.
Acknowledgements
RJS was supported by the STFC Durham Astronomy Consolidated Grant 2014–2017 (ST/L00075X/1), PA by an STFC studentship, and DC by a Leverhulme Trust Emeritus Fellowship. The data used here are available through the ESO science archive (programme ID 093.B-0193) and the Subaru archive (programme ID S14A-001).
References
- [1] Abazajian K.N. et al. 2009, ApJS, 2009, 182
- [2] Campbell L.A. et al. 2014, MNRAS, 433, 1231
- [3] Carter D., Visvanathan N., Pickles A.J. 1986, ApJ, 311, 637
- [4] Cesetti M., Ivanov V.D., Morelli L., Pizzella A., Buson L., Corsini E.M., Dalla Bontà E., Siavelli M., Bertola F. 2009, A&A, 497, 41
- [5] Cenarro A.J., Gorgas J., Vazdekis A., Cardiel N., Peletier R.F. 2003, MNRAS, 339, L12
- [6] Conroy C., van Dokkum P. 2012a, ApJ, 747, 69
- [7] Conroy C., van Dokkum P. 2012b, ApJ, 760, 71
- [8] Conroy C., Graves G.J., van Dokkum P. 2014, ApJ, 780, 33
- [9] Ferreras I., La Barbera F., de la Rosa I.G., Vazdekis A., de Carvalho R.R., Falcón-Barroso J., Ricciardelli E. 2013, MNRAS, 429, L15
- [10] Iwamuro F. et al. 2012, PASJ, 64, 59
- [11] Jeong H., Yi S.K., Kyeong J., Sarzi M., Sung E., Oh K. 2013, ApJ, 208, 7
- [12] Kimura M. et al. 2010, PASJ, 62, 1135
- [13] Kroupa P. 2001, MNRAS, 322, 231
- [14] La Barbera F., Ferreras I., Vazdekis A., de la Rosa I.G., de Carvalho R.R., Trevisan M., Falcón-Barroso J., Ricciardelli E. 2013, MNRAS, 433, 3017
- [15] Mármol-Queraltó E. et al. 2009, ApJ, 705, L199
- [16] Salpeter E. 1955, ApJ, 121, 161
- [17] Rayner J.T., Cushing M.C., Vacca W.D., 2009, ApJS, 185, 289
- [18] Sánchez S.F. et al. 2012 A&A, 538, A8
- [19] Silva D.R., Kuntschner H., Lyubenova M. 2008, ApJ, 674, 194
- [20] Smith R.J. 2014, MNRAS, 443, L69
- [21] Smith R.J., Lucey J.R., Carter D. 2012, MNRAS, 426, 2994
- [22] Smith R.J., Lucey J.R., Conroy C. 2015, MNRAS, 449, 3441
- [23] Spiniello C., Trager S.C., Koopmans L.V.E., Chen Y.P. 2012, ApJ, 753, L32
- [24] Spiniello C., Trager S., Koopmans L.V.E., Conroy C. 2014, MNRAS, 438, 1483
- [25] Spiniello C., Trager S., Koopmans L.V.E. 2015, MNRAS, in press arXiv:1401.1145
- [26] Spinrad H., Taylor B.J. 1971, ApJS, 22, 445
- [27] Trager S.C., Worthey G., Faber S.M., Burstein D., Gonzalez J.J. 1998, ApJS, 116, 1
- [28] van Dokkum P., Conroy C. 2010, Nature, 468, 940
- [29] Vazdekis A., Ricciardelli E., Cenarro A.J., Rivero-González J.G., Díaz-García L.A., Falcón-Barroso J. 2012, MNRAS, 424, 157
- [30] Whitford A.E. 1977, ApJ, 211, 527