A Far-Infrared Observational Test of the Directional
Dependence
in Radiative Grain Alignment
Abstract
The alignment of interstellar dust grains with magnetic fields provides a key method for measuring the strength and morphology of the fields. In turn, this provides a means to study the role of magnetic fields from diffuse gas to dense star-forming regions. The physical mechanism for aligning the grains has been a long-term subject of study and debate. The theory of radiative torques, in which an anisotropic radiation field imparts sufficient torques to align the grains while simultaneously spinning them to high rotational velocities, has passed a number of observational tests. Here we use archival polarization data in dense regions of the Orion molecular cloud (OMC-1) at 100, 350, and to test the prediction that the alignment efficiency is dependent upon the relative orientations of the magnetic field and radiation anisotropy. We find that the expected polarization signal, with a 180-degree period, exists at all wavelengths out to radii of 1.5 arcminutes centered on the BNKL object in OMC-1. The probabilities that these signals would occur due to random noise are low (1%), and are lowest towards BNKL compared to the rest of the cloud. Additionally, the relative magnetic field to radiation anisotropy directions accord with theoretical predictions in that they agree to better than at and at .
1 Introduction
Interstellar polarization at optical through millimeter wavelengths arises from the extinction and emission of light from asymmetric dust grains aligned with respect to the interstellar magnetic field (e.g., Hiltner, 1949a; Hildebrand, 1988; Andersson et al., 2015). More than 60 years after the discovery of the effect in optical data (Hall, 1949; Hiltner, 1949b), theory and observations are converging on an empirically supported explanation of the alignment mechanism. Dolginov & Mytrophanov (1976) first proposed the radiative alignment mechanism in which the scattering of light results in net torques on the grains. Detailed scattering calculations for some specific grain shapes confirmed that the strength and direction of these torques were sufficient to align grains with angular momentum vectors parallel to the magnetic field (Draine & Weingartner, 1997), as required by observations. The analytical approximation of Lazarian & Hoang (2007) showed excellent agreement with the scattering calculations, thereby opening a large parameter space where the problem of grain alignment is probed with high efficiency (e.g., Lazarian & Hoang, 2007; Hoang & Lazarian, 2008).
In the model of radiative alignment torque (RAT) an irregular grain aligns with the magnetic field if it is paramagnetic and exposed to an anisotropic radiation field (see reviews by Andersson et al. 2015, Andersson 2015, and Lazarian et al. 2015). Differential scattering of the left- and right-hand circularly polarized components of the incident radiation transfers angular momentum from the radiation field to the grain. For a paramagnetic grain, the rapid rotation results in a bulk magnetization via the Barnett effect (Purcell, 1979), in which rotational energy is traded for spin-flips of atomic nuclei in the material. As the grains Larmor precess about the magnetic field, continued radiative torques (averaged over the precession period) change the angular momentum vector orientation of the grain until it reaches an equilibrium state with the spin parallel to the magnetic field.
The RAT theory makes several predictions, including that the grain has a net helicity, and is paramagnetic, and the alignment efficiency increases with the radiation intensity. These lead to a number of observationally testable predictions, including the unique prediction that the alignment efficiency depends on the angle between the directions of the radiation field anisotropy and the magnetic field. We test this prediction using the measured polarization fraction to trace the grain alignment efficiency and the associated polarization position angle to infer the magnetic field direction, with respect to the location of known stars. Andersson & Potter (2010) and Andersson et al. (2011) used similar comparisons to confirm the prediction using optical polarization around the star HD 97300 for relatively low opacity material. Here, we extend that experiment into dense gas by probing the grain alignment around the Becklin-Neugebauer Kleinmann-Low (BNKL) nebula in Orion using polarization data at 100, 350, and .
2 Analysis and Results
We use three polarization data sets (Figure 1) at wavelengths of (Dotson et al., 2000), (Dotson et al., 2010), and (Matthews et al., 2009). The radial distance to each data point and their spatial position angles on the sky are measured with respect to the position of peak submillimeter flux, coincident with the source IRc2 (, , J2000). We limit the data to points within 1.5 arcminutes of IRc2, a choice driven by the facts 1) at larger distances south the Orion-S source () may confuse the analysis and 2) smaller distances limit the analysis to regions very close to BNKL, which may imprint complicated density and turbulent effects on any signal.
The position angle of radiation from the BNKL region to any data point is the position angle on the sky, measured east of north. Even at distances , Orion-S may bias the analyses. Therefore, analyses do not include data within the 20% intensity contour (Figure 1) about Orion-S.
2.1 Single Frequency Fits
Figure 2 compares the fractional polarization to the angle difference between the radiation position angle and the inferred magnetic field orientation, . Fits of these data to sinusoids with a period provide a test of the existence and likelihood of such signals. Formal fits are of the form
| (1) |
where is a constant offset, is the sinusoid amplitude, and is the phase offset from the peak signal. Figure 2 shows only data in the distance range –, while Table 1 reports parameter values at other distances (Section 3.2). All fits use equally weighted data points.

The sinusoidal signals in Figure 2 are fairly clear “by-eye” at 100 and , a finding confirmed by the significance of the amplitude measurements () and the small phase uncertainties (). The signal is less clear at and may be biased by large excursions near , although the amplitude significance and phase uncertainty are similar to the other two wavelengths. The fit phase angles are in good agreement at 100 and , but orthogonal to that at .
2.2 Periodograms
The simple interpretation of a high significance result for the single-frequency fit is to confirm the presence of the model. However, this is only true when compared against the null-hypothesis—random noise with respect to a constant signal as a function of . One less restrictive subset of models are sinusoids at other single frequencies. We test fits to these other frequencies using the generalized Lomb-Scargle periodogram for unevenly spaced data as described by Zechmeister & Kürster (2009). This analysis is equivalent to performing least-squares fits to every frequency in turn (Scargle, 1989).
A key parameter in the periodogram, and the subsequent probability estimate, is the number of independent frequencies, , in the data. For unevenly spaced data the number of independent frequencies can be on order the number of data points, (Horne & Baliunas, 1986). Given the relative uncertainties and “clumpiness” of the data in - space this is a likely upper limit so we choose (see Table 1). Since the data are limited to a real spatial circle any signal must repeat at periods of , so only periods with integer fractions of may exist (360, 180, 120, … ).
For radii – from BNKL, the 100 and periodograms peak at frequency , a period of (Figure 3). The data peaks at (), although is the next largest power. The fact a peak does not occur at does not imply that such a signal is absent, but simply that it is not the dominant frequency in the data. The false alarm probability (FAP) measures whether or not any given peak contributes significantly to the signal.

The FAP describes the probability that a signal would be observed in the case of random noise and the absence of that signal. The FAP follows from and a properly normalized periodogram. The powers and FAPs in Figure 3 and Table 1 use the “sample variance” normalization of Horne & Baliunas (1986, also Zechmeister & Kürster 2009). We note that FAP increases for increasing , thus the choice of yields upper limits on the FAPs. The smallest FAPs correspond to the largest periodogram powers and confirm the presence of a 180-degree component in the 100 and data (FAPs = 0.4% and 0.004%, respectively). However, frequency components away from the peak can also have very small FAPs, indicating the presence of multiple components. For example, in the case of the data, the FAPs for the 360- and 180-degree components are 0.01 and 1.0 percent, respectively. The component is likely the result of localized spatial features overlayed on the periodic signal, thereby breaking the symmetry and moving power to other frequencies.
3 Discussion
3.1 Comparison to Predictions
3.1.1 The 180 degree Component
The radiative torque model predicts an increased alignment efficiency when the direction of the radiation, , is parallel to the grain spin axis and to the magnetic field orientation, (Hoang & Lazarian, 2009). In the absence of changes in collisional disalignment and magnetic field orientation the measured polarization fraction is a measure of this alignment efficiency. Thus one expects the variation in polarization as a function of to exhibit a signal with a period.
The periodogram has a strong peak at the expected period, has a low FAP (2.6%), and the phase angle peaks close to (Table 1). While the periodogram peaks at a period, the component also has a low FAP (3.1%). Additionally, the phase angle shows good agreement between and (– with uncertainties –). The phase angles are similar in the two lower radius bins (– and –) but are orthogonal to both the expected RAT signal and the results at 100 and . As the emission is optically thin (; Cole 1999), the three wavelengths sample dust along the entire line-of-sight. However, they sample different environments since the shorter wavelengths are more sensitive to hotter dust closer to the photon sources. The heating of the warmer/closer dust is dominated by BNKL while heating of the cooler dust likely has contributions from diffuse radiation outside that immediate environment.
While the use of a sinusoid to characterize the variation is chosen for simplicity, any symmetric 180-degree signal (e.g., a triangle or square wave) must contain this fundamental frequency. The limitation in searching for a single frequency is a loss in observed power, making it less likely to observe a signal in its absence. The periodogram analysis provides a natural way to find this missing power.
The analysis presented here can also be applied to the optical polarization data around the star HD 97300, where Andersson et al. (2011) found a strong signal and peak alignment efficiency within of . Similarly, we find that the component dominates the HD 97300 data with and phase .
3.1.2 Other Frequency Components
The single-frequency fits assume the signal is the only signal present. However, at the and components have FAPs of 1.0%, and at the and components have FAPs 0.1%. This indicates the simultaneous presence of multiple components such that one component cannot necessarily be ignored when fitting for the other. Formally, including a component to the data and including a component to the do significantly improve the fits (as measured by an -test). However, the corresponding amplitudes and phases vary only within the uncertainties reported in Table 1. Therefore, the presence of multiple frequency components can neither change any conclusions with respect to , nor can it explain the large phase offset for the data.
The physical interpretation of a component is simply the fact that data are not equivalent when reflected about the origin. For example, the OMC-1 intensity map is clearly asymmetric in the north-south direction, with Orion-S dominating in the south. If this radiation source has an influence on grain alignment and/or polarization, then one can expect some significant signal at and for that signal to get stronger as data closer to Orion-S are included. However, the limited data (three radius bins) are insufficient to test this hypothesis.
We have attempted to limit the possible effects from Orion-S by removing data in a small region around it (Section 2). However, some data in that direction show large excursions from the best single-frequency fit at angles and (Figure 2). These data are mostly located in spatial regions towards Orion-S with – and distances beyond . Removing those data from the analysis (at radii –) removes the and components from the data (FAPs 99% at both and ). At the both the and components remain and the phase angle () is in better agreement with that at . This change has little effect on the conclusion that the component exists with high confidence at . Changes in the data fits are minimal, with values consistent with those in Table 1, but the FAP is increased to 12%.
3.2 Distance Dependence
If grain alignment is due to radiative torques, and no other factors contribute significantly to either alignment or disalignment, then the alignment decreases with distance from the radiation source. We divide each dataset into three distance bins with respect to BNKL, all with upper limits of but varying lower limits of , , and and repeat the analyses in Section 2 (Table 1). FAPs are low (7.5%) for all wavelengths and radii. The shorter wavelengths see an increase in the amplitude and drop in FAP in the largest distance bin only. The amplitudes increase across all three bins, although the largest has a relatively high FAP (7.5%).
We attribute the increasing signal, as opposed to the expected decrease, to lower polarization values towards the core regions of BNKL. This drop in polarization is either the result of loss of grain alignment due to the large collision rate at higher space densities or large changes in polarization position angle, either along the line of sight or within the telescope beam.
3.3 A Systematic Search
Section 2 measures the directional dependence of RAT centered only on the submillimeter intensity peak BNKL/IRc2. It is reasonable to ask whether there are other such sources, and whether a signal would be obtained in other regions of the map.
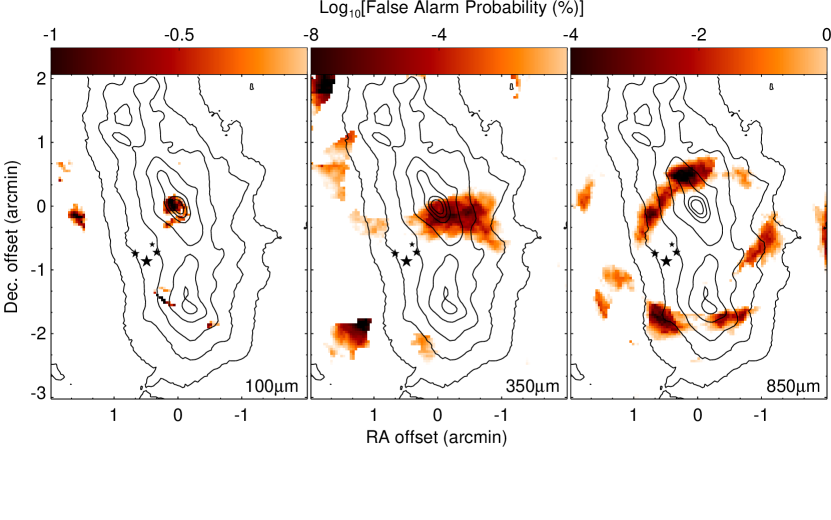
Figure 4 shows the FAPs across the entire OMC-1 map, generated by applying the same periodogram analysis to every point in the map. Here we show the analysis for the component within the – radius bin at each point. This choice provides qualitatively similar results to those at – but with an increased contrast for clarity. Note that the data set itself covers a region larger than that shown in Figure 1, so FAPs at the apparent edge of the map are still valid with this annulus.
The FAPs are relatively high at all points in the map except for a few scattered regions. It is reasonable to expect that, by chance, some significant signal would be observed, especially in low intensity regions where uncertainties are larger. The proximity of the low FAPs to BNKL lends further support to the analysis already presented. At 100 and there are clear signals towards BNKL, as expected for the RAT hypothesis. Possible signals also exist in an extended region at and just to the east of Orion-S at .
The FAP towards BNKL is very high (20–60%) but low in areas just outside of BNKL and Orion-S. This is consistent with the earlier hypothesis (Section 3.1) that cooler dust emitting at the longer wavelengths and further from the strong FIR sources has strong heating and RAT contributions from sources other than BNKL.
There are no strong signals towards the Trapezium stars, which might be expected to generate high RATs due to photons from the bright OB stars. Since those stars are further from the dust ridge (0.25 – 0.5 pc; O’dell 2001) than BNKL, and the optical light is heavily extincted by that dust, they have little influence on the heating of grains observed in the FIR.
3.4 Angle Projection
The input to the RAT model is the three-dimensional space angle between the magnetic- and radiation-field directions. In this work we measure the two-dimensional projection onto the plane of the sky, (previously defined as ). From the dot product of the radiation and magnetic field space vectors we have
| (2) |
where are the inclination angles of the field vectors with respect to the line of sight. The largest signal with respect to occurs when both vectors are in the plane of the sky () but becomes unmeasurably low when one vector lies near the line of sight (). For our work here it is important to note rotates with the same period as , just with different amplitudes.
The projection effect is fairly small since the magnetic field in OMC-1 has an inclination angle of (Houde et al., 2004). However, the projected radiation angle may be a stronger effect. For the line-of-sight distance estimate we assume the cloud depth is approximately the same as its width and use a half-width (Houde et al., 2009). Thus, the inclination angle is as low as –– at the edge of the cloud. However, integration through the cloud depth likely shifts the average angle to larger values since the angle increases for dust closer to the cloud center and the central regions dominate the integrated column density.
The effects of line-of-sight averaging and binning in the plane of the sky lowers any signal as the dispersion increases within any given bin. However, if this had a large effect on these data, no azimuthal signal would be detected. The existence of strong signals, and at multiple wavelengths, implies such averaging and projection effects do not strongly effect our conclusions.
4 Summary
In radiative grain alignment anisotropic radiation provides the torques to align the grains with interstellar magnetic fields. The model makes several observable predictions, including a more efficient alignment if the direction of the radiation field anisotropy, , is parallel to the magnetic field orientation, . In the case of data about the bright source BNKL/IRc2 in Orion, the polarization fraction peaks within of these angles. For data the agreement is also good at , but the two directions are orthogonal at .
Periodogram analyses show that the polarization fraction as a function of the angle difference at all three wavelengths is dominated by a signal with a period of , as expected for a RAT. In most cases, the probabilities that these signals arise from random noise (the false alarm probabilities, FAPs) are less than 1%. Contributions from signals with other periods do not significantly change the quantitative values of the fit amplitudes, phases, or FAPs. The map of the FAPs has a narrow spatial minimum towards BNKL at , is more extended at , but is outside the core at . This drop in signal with increasing wavelength is expected since grains emitting predominantly at are warmest, and thus closest, to the BNKL source. Emission at longer wavelengths arises from cooler grains further from the source with increased heating contributions from sources outside BNKL.
Based on the low FAPs for periods and the good agreement between angular peaks at 100 and we find strong evidence for a detection of the predicted angular dependence of RATs This work, taken together with the optical work towards HD 97300 (Andersson et al., 2011), provides the best current tests of the RAT-predicted angular alignment dependence.
| Wavelength | Radii | FAPaaThe False Alarm Probability (FAP) is the probability a signal would be observed in the case of random noise. | bbNumber of data points used in analysis. | ||||||
|---|---|---|---|---|---|---|---|---|---|
| () | (arcmin) | (percent) | (percent) | (percent) | (percent) | (degrees) | (degrees) | (percent) | |
| 100 | 0.0 – 1.5 | 3.8 | 0.2 | 1.4 | 0.3 | 6 | 2.6 | 27 | |
| 0.5 – 1.5 | 4.0 | 0.2 | 1.4 | 0.3 | 5 | 0.4 | 25 | ||
| 1.0 – 1.5 | 4.0 | 0.2 | 2.1 | 0.3 | 4 | 0.08 | 14 | ||
| 350 | 0.0 – 1.5 | 2.5 | 0.1 | 0.3 | 0.1 | 7 | 3.1 | 91 | |
| 0.5 – 1.5 | 2.5 | 0.1 | 0.3 | 0.1 | 0 | 7 | 1.0 | 82 | |
| 1.0 – 1.5 | 2.4 | 0.1 | 0.6 | 0.1 | 4 | 51 | |||
| 850 | 0.0 – 1.5 | 3.6 | 0.1 | 0.9 | 0.2 | 86 | 6 | 0.2 | 136 |
| 0.5 – 1.5 | 3.8 | 0.1 | 1.1 | 0.2 | 84 | 5 | 0.004 | 115 | |
| 1.0 – 1.5 | 3.0 | 0.2 | 1.3 | 0.3 | 69 | 7 | 7.5 | 41 |
References
- Andersson (2015) Andersson, B.-G. 2015, in Astrophysics and Space Science Library 407, Magnetic Fields in Diffuse Media, eds. A. Lazarian, E. M. de Gouveia Dal Pino, & C. Melioli (New York: Springer), 59
- Andersson et al. (2015) Andersson, B.-G., Lazarian, A., & Vaillancourt, J. E. 2015, ARA&A, 53, 501
- Andersson et al. (2011) Andersson, B.-G., Pintado, O., Potter, S. B., Straižys, V., & Charcos-Llorens, M. 2011, A&A, 534, A19
- Andersson & Potter (2010) Andersson, B.-G. & Potter, S. B. 2010, ApJ, 720, 1045
- Cole (1999) Cole, D. M. 1999, High-resolution far-infrared observations of star-forming regions, Ph.D. thesis, THE UNIVERSITY OF CHICAGO
- Dolginov & Mytrophanov (1976) Dolginov, A. Z. & Mytrophanov, I. G. 1976, Ap&SS, 43, 291
- Dotson et al. (2000) Dotson, J. L., Davidson, J., Dowell, C. D., Schleuning, D. A., & Hildebrand, R. H. 2000, ApJS, 128, 335
- Dotson et al. (2010) Dotson, J. L., Vaillancourt, J. E., Kirby, L., et al. 2010, ApJS, 186, 406
- Draine & Weingartner (1997) Draine, B. T. & Weingartner, J. C. 1997, ApJ, 480, 633
- Hall (1949) Hall, J. S. 1949, Science, 109, 166
- Hildebrand (1988) Hildebrand, R. H. 1988, QJRAS, 29, 327
- Hiltner (1949a) Hiltner, W. A. 1949a, ApJ, 109, 471
- Hiltner (1949b) —. 1949b, Science, 109, 165
- Hoang & Lazarian (2008) Hoang, T. & Lazarian, A. 2008, MNRAS, 388, 117
- Hoang & Lazarian (2009) —. 2009, ApJ, 697, 1316
- Horne & Baliunas (1986) Horne, J. H. & Baliunas, S. L. 1986, ApJ, 302, 757
- Houde et al. (2004) Houde, M., Dowell, C. D., Hildebrand, R. H., et al. 2004, ApJ, 604, 717
- Houde et al. (2009) Houde, M., Vaillancourt, J. E., Hildebrand, R. H., Chitsazzadeh, S., & Kirby, L. 2009, ApJ, 706, 1504
- Lazarian et al. (2015) Lazarian, A., Andersson, B.-G., & Hoang, T. 2015, in Polarimetry of Stars and Planetary Systems, eds. L. Kolokolova, J. H. Hough, & A.-C. Levasseur-Regourd, chap. III (New York: Cambridge University Press), in press
- Lazarian & Hoang (2007) Lazarian, A. & Hoang, T. 2007, MNRAS, 378, 910
- Matthews et al. (2009) Matthews, B. C., McPhee, C. A., Fissel, L. M., & Curran, R. L. 2009, ApJS, 182, 143
- O’dell (2001) O’dell, C. R. 2001, ARA&A, 39, 99
- Purcell (1979) Purcell, E. M. 1979, ApJ, 231, 404
- Scargle (1989) Scargle, J. D. 1989, ApJ, 343, 874
- Vaillancourt (2006) Vaillancourt, J. E. 2006, PASP, 118, 1340
- Vaillancourt et al. (2008) Vaillancourt, J. E., Dowell, C. D., Hildebrand, R. H., et al. 2008, ApJ, 679, L25
- Zechmeister & Kürster (2009) Zechmeister, M. & Kürster, M. 2009, A&A, 496, 577