galaxies: individual (M101) — galaxies: ISM — X-rays: galaxies — X-rays: ISM
Iron emission line from the spiral galaxy M101
Abstract
Archival Suzaku data of the face-on spiral galaxy M101 were analyzed. An intense emission line at 6.72 keV was detected in the central region. This line is identified with a K-line from He-like iron, which indicates the existence of a thin thermal plasma with a temperature of several keV. The iron line luminosity within the central 5 arcmin radius region is estimated to be (2–12)1037 erg s-1. The origin of the iron emission line is discussed.
1 Introduction
The study of X-ray properties of spiral galaxies was made possible by the Einstein satellite (e.g., [Fabbiano (1989)]). X-ray observations with spatial resolution resolved individual X-ray sources and revealed the existence of diffuse X-ray emission with 1 keV (e.g., [Fabbiano (1989), Fabbiano et al. (1992), Read et al. (1997), Tyler et al. (2004), Owen & Warwick (2009), Mineo et al. (2012)]). The diffuse X-ray emission is considered to originate from gas shock-heated by supernova (SN) explosions and stellar wind interactions and made by star formation activity. Fe-K lines at 6.7 keV were detected from starburst galaxies (e.g., [Pietsch et al. (2001), Boller et al. (2003), Ranalli et al. (2008), Mitsuishi et al. (2011)]) and ultraluminous infrared galaxies (e.g., Iwasawa et al. 2005, 2009), indicating the existence of a hot plasma with a temperature of 1 keV. The Fe-K line was also detected from the central region of the normal spiral galaxy M31 (Takahashi et al., 2004), while the line has not been found in any other normal spiral galaxies so far.
Unresolved thermal X-ray emission with an intense Fe-K line has been found in the Milky Way (MW). This is called Galactic Diffuse X-ray Emission (GDXE). The GDXE is found in the Galactic disk (e.g., Worrall et al. (1982); Warwick et al. (1985); Koyama et al. (1986); Yamauchi & Koyama (1993); Kaneda et al. (1997); Sugizaki et al. (2001)), the Galactic center (e.g., Koyama et al. 1989, 1996, 2007b; Yamauchi et al. 1990), and the Galactic bulge regions (e.g., Yamauchi & Koyama (1993); Kokubun (2001); Revnivtsev (2003)). Although information on the properties of the GDXE has increased since its discovery, its origin remains unsolved. The most important issue is whether the GDXE is truly diffuse emission or composition of numerous faint X-ray sources. If the diffuse origin is correct, the hot plasma having a huge thermal energy is hard to be confined by the Galactic gravity. On the other hand, if the point source model is correct, a large number of sources having a thin thermal emission (=5–10 keV) with intense Fe-K emission lines are required.
The Fe-K emission line may be a common feature among galaxies. Thus, research for spiral galaxies is valuable for not only exploring the activities of the galaxies but also understanding the GDXE.
M101 (NGC 5457) is a nearby face-on SAB(rs)cdI galaxy (de Vaucouleurs et al., 1991) at the distance of 6.8 Mpc (Saha et al., 2006). It is located at the high Galactic latitude, (, )=(\timeform102D.0, \timeform+59D.8) and the Galactic absorption is low (=1.161020 cm-2, Dickey & Lockman 1990). M101 is a vigorously star-forming galaxy. A color index, , is relatively small (0.45, NED). UV band images, a sensitive probe for detection of young stellar clusters, show a clear spiral arm structure with bright regions (e.g., Bianchi et al. (2005); Kuntz & Snowden (2010)). Most of the bright regions coincide with giant HII regions, sites of intense star formation qualified as starbursts.
Previous X-ray observations of M101 with Einstein, ROSAT, XMM-Newton, and Chandra resolved many point sources and found diffuse X-ray emission with 1 keV (Trinchieri et al. (1990); Wang et al. (1999); Pence et al. (2001); Kuntz et al. (2003); Tyler et al. (2004); Jenkins et al. 2004, 2005; Warwick et al. (2007); Kuntz & Snowden (2010)). The bulk of the diffuse soft X-ray emission is correlated with the UV emission (Kuntz et al., 2003; Warwick et al., 2007; Kuntz & Snowden, 2010). The spectral properties are similar to those of the giant HII regions (Kuntz et al., 2003; Kuntz & Snowden, 2010; Sun et al., 2012). These facts imply that the diffuse soft X-ray emission is associated with star-formation activity: stellar winds from massive stars, SNe, and superbubbles (Kuntz et al., 2003; Warwick et al., 2007; Kuntz & Snowden, 2010).
Due to the lack of the sensitivity in the hard X-ray band (Einstein and ROSAT) or the high detector background (Chandra and XMM-Newton), it would be difficult to find a hotter component. The X-ray Imaging Spectrometers (XIS) onboard the Suzaku satellite has better spectral resolution and lower/more stable intrinsic background than the previous X-ray satellites (Koyama et al., 2007a; Mitsuda et al., 2007). Especially, the XIS has the best sensitivity in the iron line band. We analyzed Suzaku archival data of M101 and found an emission line from the highly ionized iron, a sign of a hot plasma with a temperature of several keV. The results of a preliminary analysis were reported in Yamauchi (2014). In this paper, we present the results of a further analysis and discuss the origin of the iron emission line. Throughout this paper, the quoted errors are at the 90% confidence level.
2 Observations and data reduction
Suzaku observation of M101 was made with the XIS (Koyama et al. (2007a)) on the focal planes of the thin foil X-ray Telescopes (XRT, Serlemitsos et al. (2007)) on 2006 November 23–25 (Obs. ID=801063010). The Hard X-ray Detector (HXD: Takahashi et al. (2007); Kokubun et al. (2007)) observed M101 simultaneously, but only the XIS data were used because we focus on an iron emission line from a thin thermal plasma. The observed field of the XIS was a \timeform17.’8\timeform17.’8 area with the center at (, )J2000.0= (\timeform210.D8674, \timeform+54.D3599). The XIS consists of 4 sensors. XIS sensor-1 (XIS 1) is a back-side illuminated CCD (BI), while the other three XIS sensors (XIS 0, 2, and 3) are front-side illuminated CCDs (FIs). One of the FIs (XIS 2) stopped working on 2006 November 9. Therefore, we utilized the XIS 0, XIS 1, and XIS 3 data for analyzing. The XIS was operated in the normal clocking mode.
Data reduction and analysis were made using the HEAsoft version 6.13. The XIS pulse-height data for each X-ray event were converted to Pulse Invariant (PI) channels using the xispi software and the calibration database version 2013-07-24. We excluded the data obtained at the South Atlantic Anomaly, during the earth occultation, and at the low elevation angle from the earth rim of 5∘ (night earth) and (day earth) and also removed hot and flickering pixels. After the screening, we used the grade 0, 2, 3, 4, and 6 data. The resultant exposure time was 98.9 ks.
3 Analysis and results
3.1 Image
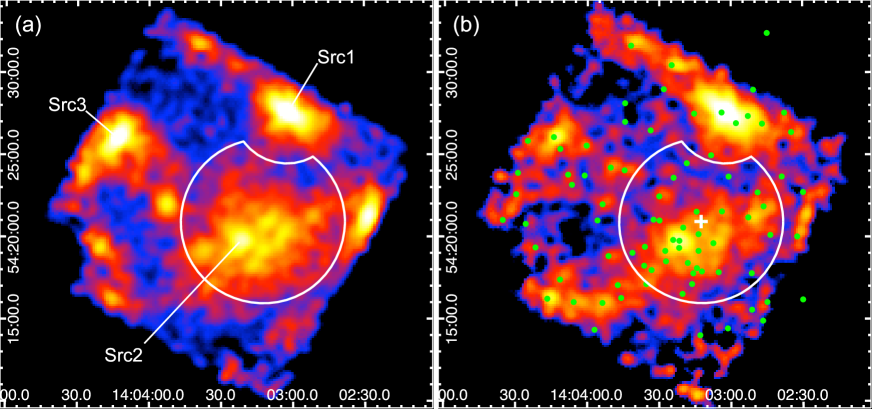
Figure 1 shows X-ray images in the 0.5–2 and 2–8 keV energy bands. For maximizing photon statistics, the data of XIS 0, 1, and 3 were added. Two bright X-ray sources near to the northwest (Src1) and the northeast (Src3) edges were clearly found. Their source positions were determined to be (RA, Dec)J2000.0=(\timeform14h03m02s.6, \timeform+54D27’37”) and (RA, Dec)J2000.0=(\timeform14h04m12s.8, \timeform+54D26’06”), respectively. The typical positional uncertainty of Suzaku is 19′′ (Uchiyama et al., 2008). In addition, the systematic error of the peak determination is 8′′. Taking the uncertainties into account, we identified these sources with XMM-1 (XMMU J140303.9542734) and XMM-3 (XMMU J140414.1542604) in Jenkins et al. (2004, 2005), respectively. X-ray luminosities of XMM-1 and XMM-3 have been estimated to be 1039 erg s-1 (Jenkins et al., 2004), and hence the two sources are possibly ultra luminous X-ray sources. We confirmed that both sources have high luminosities of 1039 erg s-1 in the present Suzaku observation (see Appendix).
A relatively bright X-ray source (Src2) was found near to the field of view (FOV) center. The source position was determined to be (RA, Dec)J2000.0=(\timeform14h03m21s.6, \timeform+54D19’49”). There are two possible counterparts within the error region, XMM-9 (XMMU J140321.6541946) and XMM-14 (XMMU J140324.2541949) (Jenkins et al. 2004, 2005). In addition to Src2, unresolved X-ray emission together with faint point sources is found in the central region of M101.
3.2 4–10 keV band spectra
X-ray spectra were extracted from a circular region with a radius of 5 arcmin, 9.9 kpc at the distance of 6.8 Mpc. The contribution of the bright X-ray source, Src1, was excluded, but those of Src2 and the faint sources were included (see figure 1). The non-X-ray background (NXB) was taken from the night earth data using xisnxbgen (Tawa et al., 2008). After subtracting the NXB, we merged the XIS 0 and XIS 3 spectra, but treated the XIS 1 spectrum separately because the response functions of the FIs and BI are different. The XIS 03 and XIS 1 spectra were simultaneously fitted with the same model. Response files, Redistribution Matrix Files (RMFs) and Ancillary Response Files (ARFs), were made using xisrmfgen and xissimarfgen, respectively.
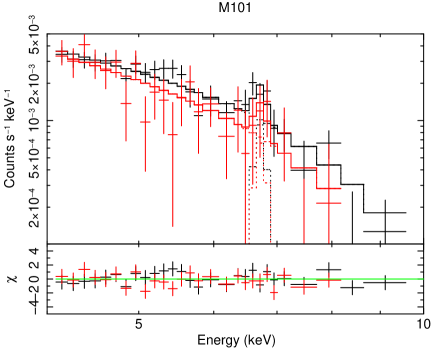
Figure 2 shows the NXB-subtracted spectra in the 4–10 keV energy band. At first, we fitted the spectra with a power-law (PL) function and found positive residuals at 6–7 keV in both the FI and BI spectra. We added an emission line (Line) model with a line width of null. The value was 8.98, showing that the additional emission line model is statistically significant with a confidence level of 99 %. The best-fit parameters are listed in table 1 and the best-fit model is plotted in figure 2. The center energy was determined to be 6.72 keV. The line is identified with a K-shell transition line from He-like iron, which indicates that the existence of an optically thin hot plasma with a temperature of several keV. We derived an iron line luminosity, , to be =(84)1037 erg s-1 within the central 5′ radius region from the best-fit parameters.
| Parameter | Value |
|---|---|
| Model: PLLine | |
| 2.2 | |
| (keV) | 6.72 |
| (photons s-1 cm-2) | (1.30.7)10-6 |
| /d.o.f. | 36.8/50 |
∗ Within the 5′ radius circle.
3.3 0.5–10 keV band spectra
| Parameter | Value | |
|---|---|---|
| M101 | Model A | Model B |
| (keV) | 5.1 | 6.9 |
| Norm∗† | (1.6)10-4 | (1.20.1)10-4 |
| (keV) | 6.72 | — |
| (photons s-1 cm-2) | (1.0)10-6 | — |
| Abundance‡ (Solar) | — | 1 (fixed) |
| (keV) | 0.187 | 0.187 |
| Abundance | 1 (fixed) | 1 (fixed) |
| Norm | (2.40.2)10-4 | (2.40.2)10-4 |
| (keV) | 0.86 | 0.86 |
| Abundance | 1 (fixed) | 1 (fixed) |
| Norm | (4.00.5)10-5 | (4.20.5)10-5 |
| (keV) | 6.2 (fixed) | 6.2 (fixed) |
| Norm | 1.410-4 (fixed) | 1.410-4 (fixed) |
| (cm-2) | 1.16 (fixed) | 1.16 (fixed) |
| Sky BGD | ||
| (keV) | 0.1 (fixed) | 0.1 (fixed) |
| Abundance | 1 (fixed) | 1 (fixed) |
| Norm | 2.0910-6 (fixed) | 2.0910-6 (fixed) |
| (keV) | 0.27 (fixed) | 0.27 (fixed) |
| Abundance | 1 (fixed) | 1 (fixed) |
| Norm | 1.5910-7 (fixed) | 1.5910-7 (fixed) |
| 1.412 (fixed) | 1.412 (fixed) | |
| Norm | 8.1710-7 (fixed) | 8.1710-7 (fixed) |
| (cm-2) | 1.16 (fixed) | 1.16 (fixed) |
| /d.o.f. | 196.8/195 | 204.9/197 |
∗ Defined as
10-14 / (4),
where is the hydrogen density (cm-3),
is the electron density (cm-3), and is the distance (cm).
† Within the 5′ radius circle.
‡ Relative to the solar value (Anders & Grevesse, 1989).
§ The unit is cm-5 arcmin-2.
¶ The unit is photons s-1 cm-2 keV-1 arcmin-2 at 1 keV.
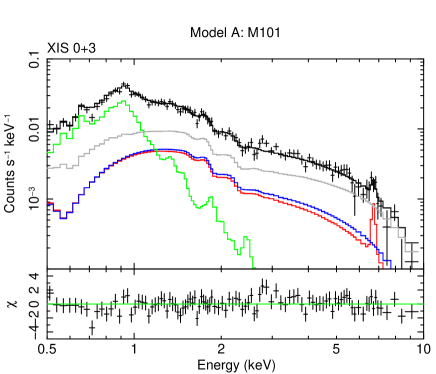
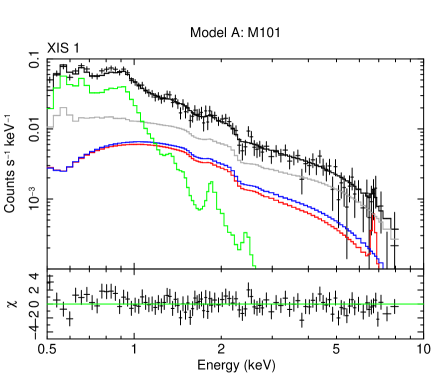
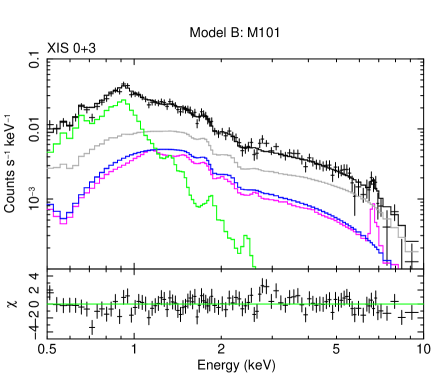
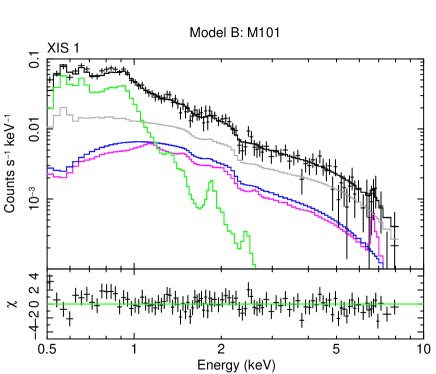
Next, we tried to fit the wide band spectra with a realistic model. Figure 3 shows the spectra in the 0.5–10 keV energy band. The spectra contain the sky background and X-ray emission from M101. Several authors have demonstrated that the sky background is typically represented by a three-component model, a local hot bubble (LHB), a MW halo (MWH), and the Cosmic X-ray Background (CXB) (e.g., Konami et al. (2012); Akamatsu et al. (2013); Ota et al. (2013)). According to the previous works, we used the following model,
| (1) |
where TP is a thin thermal plasma emission (apec model in XSPEC) and ABS is the photoelectric absorption by interstellar matter in the MW. All the spectral parameters were fixed to values in Ota et al. (2013) (LHB and MWH) and Kushino et al. (2002) (CXB).
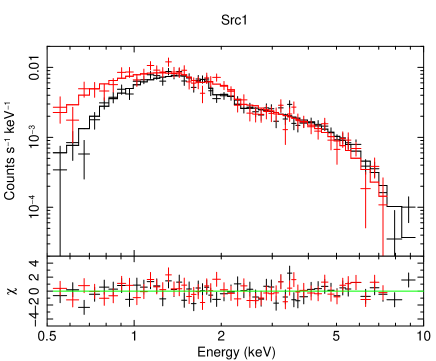
As described in section 3.2, we found a thermal component with a several keV temperature responsible for the iron line emission in M101. We modeled the emission as thermal bremsstrahlung (BR)Line. The source region contains the bright source Src2, whose X-ray emission was represented by the BR model (see figure 4 and table 3). The temperature and the normalization were fixed to values in table 3 (BRSrc2). The source region also contains other X-ray point sources with luminosities of less than 1038 erg s-1 (e.g., Jenkins et al. 2004, 2005; Warwick et al. 2007), most of which would be neutron star low-mass X-ray binaries (NS-LMXBs). The spectra of NS-LMXBs are well represented by a model consisting of a multicolor disk (MCD) model and a blackbody model (Mitsuda et al., 1984; Makishima et al., 1989) and can be approximated by a BR model with a temperature of several keV to 10 keV. Due to the spectral similarity, it is difficult to distinguish X-ray emission of a thin thermal plasma with a several keV from that of NS-LMXBs in a spectral fitting. Thus, the contributions of NS-LMXBs were included in the hottest component, the BRLine model. The Chandra and XMM-Newton observations showed the existence of the diffuse soft X-ray emission, composed of two or three thermal components (e.g., Kuntz et al. (2003); Warwick et al. (2007); Kuntz & Snowden (2010)). The Suzaku spectra also required at least two thin thermal components. Thus, we modeled the diffuse soft X-ray emission as TPlow and TPhigh. We note that the model includes X-rays from soft X-ray sources such as stars, HII regions, and old supernova remnants (SNRs) in the source region.
The model for M101 (Model A) is expressed as follows,
| (2) |
The value for ABS was fixed to 1.161020 cm-2 (Dickey & Lockman, 1990), while the cross sections of the photoelectric absorption were taken from Morrison and McCammon (1983). The abundances of the TP model were fixed to the solar values (Anders & Grevesse, 1989). This model gave an acceptable fit (reduced =196.8/195=1.009). The best-fit model is plotted in figure 3, while the best-fit parameters are listed in table 2. We derived to be (64)1037 erg s-1 from the best-fit parameters.
We also tried the spectral fitting by replacing BRLine with another thin thermal plasma model, TPFe (Model B),
| (3) |
The abundances were assumed to be solar values. This model also gave an acceptable fit (reduced =204.9/197=1.040). The results are listed in table 2, while the best-fit model is plotted in figure 3.
4 Discussion
We found the 6.7 keV line from M101, which indicates the existence of a thin thermal plasma with a temperature of several keV. Based on the results of the 4–10 keV and 0.5–10 keV band analyses, we obtain =(2–12)1037 erg s-1. An equivalent width (EW) is estimated to be 1.00.7 keV from the BRLine model fit. Since the continuum emission includes X-rays from point sources such as NS-LMXBs, the EW estimated above is a lower limit for the hot plasma. Here, we discuss the origin of the intense iron emission line.
4.1 Point source
X-ray binaries containing a black hole or a neutron star are bright in X-rays. Their emission is generally optically thick or power-law-like, and the 6.7 keV line is absent or very weak (e.g., White, Nagase, & Parmar (1995); Tanaka & Lewin (1995); Asai et al. (2000)). Thus, the spectral properties are much different. On the other hand, cataclysmic variables (CVs), active binaries (ABs), and young stellar objects (YSOs) in star forming regions are known to have a thin thermal emission with the iron emission line (e.g., Ezuka & Ishida (1999); Güdel et al. (1999); Yamauchi et al. (1996)). Thus, the stellar sources with a luminosity of 1034 erg s-1 are thought to be potential candidates.
M101 is the spiral galaxy similar in morphological type to the MW. From the similarity, we can expect that the properties of the X-ray source populations in the two galaxies are similar. The cumulative luminosity density of the stellar sources (CVs, ABs, and YSOs) in the MW is estimated to be /=(4.50.9)1027 erg s-1 (Sazonov et al., 2006), where is the luminosity in the 2–10 keV band and is the stellar mass. Adopting the rotation velocity of 170 km s-1 (see table 1 in Kuntz et al. (2003), and references therein), we can estimate the total mass within the central 5′ radius region to be 6.71010. Assuming all the mass is equal to the stellar mass, we obtain the total stellar source luminosity of =(2.4–3.6)1038 erg s-1. Since M101 also contains interstellar matter and dark mater, this value is an upper limit of the stellar source luminosity. The metal abundances and temperatures of ABs and YSOs observed in the MW are typically 0.3 times solar and 2–5 keV, respectively (e.g., Güdel et al. (1999); Yamauchi et al. (1996)), while the spectra of CVs are represented by a multi-temperature plasma emission model (cevmkl model in XSPEC) with the maximum temperature of 20 keV and the metal abundance of at most 0.5 solar (e.g., Baskill et al. (2005); Ishida et al. (2009)). Assuming the above spectral model, we can estimate to be 3–4% of . Then, we obtain =(0.7–1.4)1037 erg s-1, which is lower than the observed value. Thus, the well-known stellar sources cannot account for the observed .
4.2 Diffuse hot plasma
The intense 6.7 keV iron line is found in young and middle-aged SNRs. The plasma with a temperature of 2–5 keV and the solar abundance (Anders & Grevesse, 1989) exhibits the intense 6.7 keV iron line with the EW of 1–2 keV. Thus, hot plasmas produced by SN explosions are a possible candidate. Active star formation in the past leads to multiple SN explosions, and then a large amount of diffuse hot plasma would be produced. Radio observations have found many HI holes and shells, probably produced by SNe or stellar winds (e.g., Allen & Goss (1979)). One of them, near to giant HII region NGC 5462, is a large hole (size1.5 kpc) surrounded by expanding HI shell with a kinetic energy of a few 1052 erg (Kamphuis et al., 1991). Furthermore, SNR MF83 and an X-ray source in NGC 5471B are suggested to be hypernova remnants (Wang, 1999; Chen et al., 2002; Sun et al., 2012). These facts indicate huge energy release in the past.
Adopting the typical SNR luminosity of 1034-36 erg s-1, (e.g., Tsunemi et al. (1986); Seward (2000)), we can estimate of each SNR to be 71032–11035erg s-1, and hence the total number of SNRs, , to account for the observed is 700–105. Taking into account that a typical SNR age with a several keV temperature () is 104 yr, a SN rate is estimated to be /0.07–10 yr-1. This scenario requires a higher SN rate than the current value (0.02 yr-1, Matonick & Fesen 1997).
A magnetic field may play an important role. If the magnetic reconnection as seen on the solar surface is occurred in the galaxy scale, a large amount of hot plasma would be produced (Tanuma et al., 1999). Furthermore, the magnetic field may confine the hot plasma (Makishima, 1994). However, information on the magnetic field (the strength, location, and configuration) is too limited to discuss it in detail. Measurements of the magnetic field are very important for further investigation.
4.3 Comparison with the GDXE
The thin thermal emission with the intense iron emission line is a similar feature to the GDXE. Here, we compare our results with those of the GDXE.
A deep observation of the GDXE at (, )=(\timeform0.D08, \timeform-1.D42) has resolved almost the GDXE flux into point sources (Revnivtsev et al., 2009) and the origin of the GDXE is proposed to be due to a superposition of many faint point sources such as CVs and ABs (Revnivtsev et al., 2009; Yuasa et al., 2012). Yuasa et al. (2012) reported that the GDXE spectra were successfully fitted by a sum of the spectra of magnetic CVs and ABs. The best-fit model requires a larger Fe abundance (0.6–0.9 solar) than observed values from CVs (e.g., Yuasa et al. (2010)) and ABs (e.g., Güdel et al. (1999)) in the solar vicinity. This suggests that the well-known CVs and ABs cannot account for the iron line intensity of the GDXE, similar to the M101 results. CVs and ABs with higher metal abundances or other X-ray sources having more intense iron emission lines are required.
If the thin thermal emission mainly originates from the stellar sources, would be proportional to the galaxy mass. of M101 is larger than that of the GDXE (1037 erg s-1, the sum of the Galactic disk, the Galactic center, and the Galactic bulge components, Yamauchi et al. (1990); Yamauchi & Koyama (1993)), but M101 is slightly less massive than the MW (see table 1 in Kuntz et al. (2003), and references therein). This may suggest that a substantial amount of iron line emission originates from high energy phenomena except for stellar sources.
5 Conclusion
We found an intense 6.7 keV iron line from the face-on spiral galaxy M101, This indicates the existence of a thin thermal plasma with a temperature of several keV. The iron line luminosity of the central region (5 arcmin radius) is estimated to be (2–12)1037 erg s-1, larger than that of the GDXE. The line intensity is stronger than those attributed to stellar sources, while the SNR scenario requires a higher SN rate than the current value. A large number of unresolved X-ray sources with an intense iron emission line may exist or unknown mechanisms may be at work. In order to understand the origin of the hot plasma, further observations with high spatial resolution and high sensitivity are encouraged.
Acknowledgement
The author is grateful to all members of the Suzaku team. I thank Akihiko Tomita and Hiromitsu Takahashi for helpful discussion. This research made use of the NASA/IPAC Extragalactic Database (NED) operated by the Jet Propulsion Laboratory, California Institute of Technology, under contract with NASA. This work was supported by the Japan Society for the Promotion of Science (JSPS) KAKENHI Grant Number 24540232.
Appendix: X-ray spectra of bright sources
| Source | Src1 | Src2 | Src3 |
|---|---|---|---|
| Source region | ellipse: 2′4′ | circle: 1′ radius | ellipse: 2′3′ |
| Parameter | Value | ||
| Model: MCDABS | |||
| ( cm-2) | 73 | 1.16 (fixed) | 1.16 (fixed) |
| (keV) | 1.60.1 | 1.3 | 0.560.04 |
| † | 47 | 366 | 235 |
| /d.o.f. | 98.6/101 | 138.8/98 | 96.0/81 |
| Observed flux‡ ( erg s-1 cm-2) | 6.4 | 1.7 | 1.9 |
| -corrected flux‡ ( erg s-1 cm-2) | 6.7 | 1.7 | 1.9 |
| Model: BRABS | |||
| ( cm-2) | 224 | 1.16 (fixed) | 64 |
| (keV) | 7.0 | 6.2 | 1.3 |
| Norm§ | (5.60.3)10-4 | (1.40.1)10-4 | (4.6)10-4 |
| /d.o.f. | 101.1/101 | 126.8/98 | 79.0/80 |
| Observed flux‡ ( erg s-1 cm-2) | 6.8 | 1.9 | 2.0 |
| -corrected flux‡ ( erg s-1 cm-2) | 8.0 | 2.0 | 2.3 |
| Model: PLABS | |||
| ( cm-2) | 315 | 1.16 (fixed) | 24 |
| 1.80.1 | 1.70.1 | 3.1 | |
| Norm¶ | (1.6)10-4 | (3.4)10-5 | (1.4)10-4 |
| /d.o.f. | 117.5/101 | 132.8/98 | 74.4/80 |
| Observed flux‡ ( erg s-1 cm-2) | 7.1 | 2.1 | 2.1 |
| -corrected flux‡ ( erg s-1 cm-2) | 9.0 | 2.1 | 4.1 |
∗ Temperature at the inner-disk radius.
† is the inner-disk radius at the 6.8 Mpc distance and is the inclination angle.
‡ The 0.5–10 keV band flux calculated from the best-fit model.
§ Defined as
10-14 / (4),
where is the hydrogen density (cm-3),
is the electron density (cm-3), and is the distance (cm).
¶ The unit is photons s-1 cm-2 keV-1 at 1 keV.
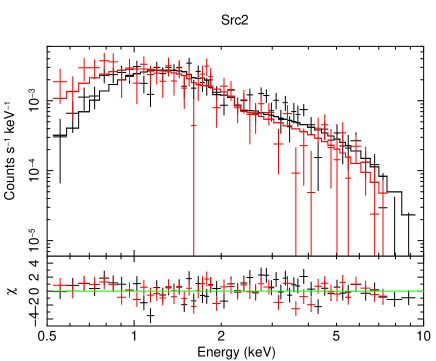
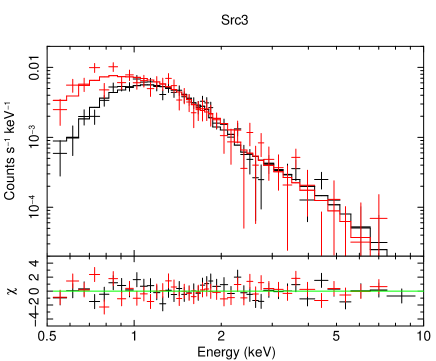
We extracted the source spectra from the source region (see table 3), while the background spectra was extracted from a nearby source free region in the FOV. The NXB for the source and the background spectra were taken from the night earth data. For both the NXB-subtracted source and background spectra, we made vignetting correction using the method described in Hyodo et al. (2008), and subtracted the background spectra from the source spectra. The background-subtracted source spectra are shown in figure 4. We tried to fit the spectra with 3 models: MCD, BR, and PL models. When the value was smaller than the Galactic absorption, the value was fixed to 1.161020 cm-2. The best-fit parameters are listed in table 3. The spectral parameters and fluxes of Src1 (=XMMU J140303.9542734) and Src3 (=XMMU J140414.1542604) are roughly consistent with those in the XMM-Newton observations (Jenkins et al., 2004).
References
- Akamatsu et al. (2013) Akamatsu, H., Inoue, S., Sato, K., Matsushita, K., Ishisaki, Y., & Sarazin, C. L. 2013, PASJ, 65, 89
- Allen & Goss (1979) Allen, R. J., & Goss, W. M. 1979, A&AS, 36, 135
- Anders & Grevesse (1989) Anders, E., & Grevesse, N. 1989, Geochim. Cosmochim. Acta, 53, 197
- Asai et al. (2000) Asai, K., Dotani, T., Nagase, F., & Mitsuda, K. 2000, ApJS, 131, 571
- Baskill et al. (2005) Baskill, D. S., Wheatley, P. J., & Osborne, J. P. 2005, MNRAS, 357, 626
- Bianchi et al. (2005) Bianchi, L., et al. 2005, ApJ, 619, L71
- Boller et al. (2003) Boller, T., et al. 2003, A&A, 411, 63
- Chen et al. (2002) Chen, C., Chu, Y., Gruendl, R., Lai, S., & Wang, Q. D. 2002, AJ, 123, 2462
- de Vaucouleurs et al. (1991) de Vaucouleurs, G., de Vaucouleurs, A., Corwin, H. G., Buta, R. J., Paturel, G., & Fouque, P. 1991, Third Reference Catalogue of Bright Galaxies (Berlin: Springer)
- Dickey & Lockman (1990) Dickey, J. M., & Lockman, F. J. 1990, ARA&A, 28, 215
- Ezuka & Ishida (1999) Ezuka, H., & Ishida, M. 1999, ApJS, 120, 277
- Fabbiano (1989) Fabbiano, G. 1989, ARA&A, 27, 87
- Fabbiano et al. (1992) Fabbiano, G., Kim, D.-W., & Trinchieri, G. 1992, ApJS, 80, 531
- Güdel et al. (1999) Güdel, M., Linsky, J. L., Brown, A., & Nagase, F. 1999, ApJ, 511, 405
- Hyodo et al. (2008) Hyodo, Y., Tsujimoto, M., Hamaguchi, K., Koyama, K., Kitamoto, S., Maeda, Y., Tsuboi, Y., & Ezoe, Y. 2008, PASJ, 60, S85
- Ishida et al. (2009) Ishida, M., Okada, S., Hayashi, T., Nakamura, R., Terada, Y., Mukai, K., & Hamaguchi, K. 2009, PASJ, 61, S77
- Iwasawa et al. (2005) Iwasawa, K., Sanders, D. B., Evans, A. S., Trentham, N., Miniutti, G., & Spoon, H. W. W. 2005, MNRAS, 357, 565
- Iwasawa et al. (2009) Iwasawa, K., Sanders, D. B., Evans, A. S., Mazzarella, J. M., Armus, L., & Surace, J. A. 2009, ApJ, 695, L103
- Jenkins et al. (2004) Jenkins, L. P., Roberts, T. P., Warwick, R. S., Kilgard, R. E., & Ward, M. J. 2004, MNRAS, 349, 404
- Jenkins et al. (2005) Jenkins, L. P., Roberts, T. P., Warwick, R. S., Kilgard, R. E., & Ward, M. J. 2005, MNRAS, 357, 401
- Kamphuis et al. (1991) Kamphuis, J., Sancisi, R., & van der Hulst, T. 1991, A&A, 244, L29
- Kaneda et al. (1997) Kaneda, H., Makishima, K., Yamauchi, S., Koyama, K., Matsuzaki, K., & Yamasaki, N. Y. 1997, ApJ, 491, 638
- Kokubun (2001) Kokubun, M. 2001, Ph D. thesis the University of Tokyo
- Kokubun et al. (2007) Kokubun, M., et al. 2007, PASJ, 59, S23
- Konami et al. (2012) Konami, S., Matsushita, K., Gandhi, P., & Tamagawa, T., 2012, PASJ, 64, 117
- Koyama et al. (1986) Koyama, K., Makishima, K., Tanaka, Y., & Tsunemi, H. 1986, PASJ, 38, 121
- Koyama et al. (1989) Koyama, K., Awaki, H., Kunieda, H., Takano, S., Tawara, Y., Yamauchi, S., Hatsukade, I., & Nagase, F. 1989, Nature, 339, 603
- Koyama et al. (1996) Koyama, K., Maeda, Y., Sonobe, T., Takeshima, T., Tanaka, Y., & Yamauchi, S. 1996, PASJ, 48, 249
- Koyama et al. (2007a) Koyama, K., et al. 2007a, PASJ, 59, S23
- Koyama et al. (2007b) Koyama, K., et al. 2007b, PASJ, 59, S245
- Kuntz et al. (2003) Kuntz, K. D., Snowden, S. L., Pence, W. D., & Mukai, K. 2003, ApJ, 588, 264
- Kuntz & Snowden (2010) Kuntz, K. D., & Snowden, S. L. 2010, ApJS, 188, 46
- Kushino et al. (2002) Kushino, A., Ishisaki, Y., Morita, U., Yamasaki, N. Y., Ishida, M., Ohashi, T., & Ueda, Y. 2002, PASJ, 54, 327
- Makishima (1994) Makishima, K. 1994, in New Horizon of X-Ray Astronomy, First Results from ASCA, ed. F. Makino & T. Ohashi (Tokyo: Universal Academy Press, Inc.), 171
- Makishima et al. (1989) Makishima, K., et al. 1989, PASJ, 41, 531
- Matonick & Fesen (1997) Matonick,D.M., & Fesen, R. A. 1997, ApJS, 112, 49
- Mineo et al. (2012) Mineo, S., Gilfanov, M., & Sunyaev, R. 2012, MNRAS, 426, 1870
- Mitsuda et al. (1984) Mitsuda, K., et al. 1984, PASJ, 36, 741
- Mitsuda et al. (2007) Mitsuda, K., et al. 2007, PASJ, 59, S1
- Mitsuishi et al. (2011) Mitsuishi, I., Yamasaki, N. Y., & Takei, Y. 2011, ApJ, 742, L31
- Morrison & McCammon (1983) Morrison, R., & McCammon, D. 1983, ApJ, 270, 119
- Ota et al. (2013) Ota, N., Fujino, Y., Ibaraki, Y., Böhringer, H., & Chon, G. 2013, A&A,
- Owen & Warwick (2009) Owen, R. A., & Warwick, R. S. 2009, MNRAS, 394, 1741
- Pence et al. (2001) Pence, W. D., Snowden, S. L., Mukai, K., & Kuntz, K. D. 2001, ApJ, 561, 189
- Pietsch et al. (2001) Pietsch, W., et al. 2001, A&A, 365, L174
- Ranalli et al. (2008) Ranalli, P., Comastri, A., Origlia, L., & Maiolino, R. 2008, MNRAS, 386, 1464
- Read et al. (1997) Read, A. M., Ponman, T. J., & Strickland, D. K. 1997, MNRAS, 286, 626
- Revnivtsev (2003) Revnivtsev, M. 2003, A&A, 410, 865
- Revnivtsev et al. (2009) Revnivtsev. M., Sazonov, S., Churazov, E., Forman, W., Vikhlinin, A., & Sunyaev, R. 2009, Nature, 458, 1142
- Saha et al. (2006) Saha, A., Thim, F., Tammann, G. A., Reindl, B., & Sandage, A. 2006, ApJS, 165, 108
- Sazonov et al. (2006) Sazonov, S., Revnivtsev, M., Gilfanov, M., Churazov, E., & Sunyaev, R. 2006, A&A, 450, 117
- Serlemitsos et al. (2007) Serlemitsos, P., et al. 2007, PASJ, 59, S9
- Seward (2000) Seward, F. D. 2000, in Allen’s Astrophysical Quantities, 4th ed., ed. A. N. Cox (New York, Springer), Chapter 9
- Sugizaki et al. (2001) Sugizaki, M., Mitsuda, K., Kaneda, H., Matsuzaki, K., Yamauchi, S., & Koyama, K. 2001, ApJS, 134, 77
- Sun et al. (2012) Sun, W., Chen, Y., Feng, L., Chu, Y., Chen, C., Wang, Q. D., & Li, J. 2012, ApJ, 760, 61
- Takahashi et al. (2004) Takahashi, H., Okada, Y., Kokubun, M., & Makishima, K. 2004, ApJ, 2004, 615, 242
- Takahashi et al. (2007) Takahashi, T., et al. 2007, PASJ, 59, S35
- Tanaka & Lewin (1995) Tanaka, Y., & Lewin, W. H. G. 1995, in X-ray Binaries, ed. W. H. G. Lewin, J. van Paradijs, & E. P. J. van den Heuvel (Cambridge: Cambridge Univ. Press), Chapter 3
- Tanuma et al. (1999) Tanuma, S., et al. 1999, PASJ, 51, 161
- Tawa et al. (2008) Tawa, N., et al. 2008, PASJ, 60, S11
- Trinchieri et al. (1990) Trinchieri, G., Fabbiano, G., & Romaine, S. 1990, ApJ, 356, 110
- Tsunemi et al. (1986) Tsunemi, H., Yamashita, K., Masai, K., Hayakawa, S., & Koyama, K. 1986, ApJ, 306, 248
- Tyler et al. (2004) Tyler, K., Quillen, A. C., LaPage, A., & Rieke, G. H. 2004, ApJ, 610, 213
- Uchiyama et al. (2008) Uchiyama, Y., et al. 2008, PASJ, 60, S35
- Wang (1999) Wang, Q. D. 1999, ApJ, 517, L27
- Wang et al. (1999) Wang, Q. D., Immler, S., & Pietsch, W. 1999, ApJ, 523, 121
- Warwick et al. (1985) Warwick, R. S., Turner, M. J. L., Watson, M. G., Willingale, R. 1985, Nature, 317, 218
- Warwick et al. (2007) Warwick, R. S., Jenkins, L. P., Read, A. M., Roberts, T. P., & Owen, R. A. 2007, MNRAS, 376, 1611
- White, Nagase, & Parmar (1995) White, N. E., Nagase, F., & Parmar, A. N. 1995, in X-ray Binaries, ed. W. H. G. Lewin, J. van Paradijs, & E. P. J. van den Heuvel (Cambridge: Cambridge Univ. Press), Chapter 1
- Worrall et al. (1982) Worrall, D. M., Marshall, F. E., Boldt, E. A., & Swank, J. H. 1982, ApJ, 255, 111
- Yamauchi et al. (1990) Yamauchi, S., Kawada, M., Koyama, K., Kunieda, H., Tawara, Y., Hatsukade, I. 1990, ApJ, 365, 532
- Yamauchi & Koyama (1993) Yamauchi, S., & Koyama, K. 1993, ApJ, 404, 620
- Yamauchi et al. (1996) Yamauchi, S., Koyama, K., Sakano, M., & Okada, K. 1996, PASJ, 48, 719
- Yamauchi (2014) Yamauchi, S. 2014, proc. of ”Suzaku-MAXI 2014: Expanding the Frontiers of the X-ray Universe”, eds. M. Ishida, R. Petre, and K. Mitsuda, 420
- Yuasa et al. (2010) Yuasa, T., et al. 2010, A&A, 520, A25
- Yuasa et al. (2012) Yuasa, T., Makishima, K., & Nakazawa, K. 2012, ApJ, 753,129