Unveiling Architecture Documentation:
Brazilian Stakeholders in
Perspective
Abstract
Over the years, software architecture has become a established discipline, both in academia and industry, and the interest on software architecture documentation has increased. In this context, the improvement of methods, tools, and techniques around architecture documentation is of paramount importance. We conducted a survey with 147 industrial participants (31 from Brazil), analyzing their current problems and future wishes. We identified that Brazilian stakeholders need updated architecture documents with the right information. Finally, the automation of some parts of the documentation will reduce the effort during the creation of the documents. But first, is necessary to change the culture of the stakeholders. They have to participate actively in the architecture documents creation.
Index Terms:
Software architecture, documentation, survey.I Introduction
Making software architecture explicit and persistent is a key factor for using the potential it offers as an enabler for efficient and effective software development, specially in scenarios of increasing system size and complexity, and globally distributed development teams. This is reflected by the fact that almost all comprehensive approaches for software architecture also address documentation [1, 2], by the existence of a standard for the description of software architectures [3], and the concern with architectural knowledge management [4].
Nevertheless, many industrial organizations still have issues with respect to software architecture documentation, that range from the absence of any architectural documentation in place to the inability of leveraging the potential that lies in existing documentation. As consequence, software development may suffer from growing communication and alignment efforts, and potential architecture erosion problems during evolution.
As a foundation for the improvement of methods and tools around software architecture documentation, we conducted a survey with industrial participants, investigating their current problems and wishes for the future, mainly focusing on the developers point of view [5].
We contacted 92 IT organizations from Europe, Asia, North and South America. A total of 147 participants, from different countries (such as Germany, Finland, Japan, USA, Sweeden and Brazil), answered the survey and were included in the data analysis.
Our main findings were that architecture documentation should become up-to-date and consistent in order to better serve the stakeholders’s needs, and that they demanded for more specific architecture documentation, targeted at their concrete context and tasks.
In this work, we present a more detailed analysis on the answers provided by Brazilian stakeholders. We depart from our previous work [5] to provide a preliminary characterization on the state-of-practice on architecture documentation in Brazil. And therefore, create a basis for future improvement of methods and tools for architecture documentation in Brazil, to make development more efficient and effective.
We defined the main goal of this study according to the GQM template [6] as:
“Characterizing the current situation and improvement potential of software architecture documentation with respect to architectural information and its representation from the perspective of Brazilian developers in industry as the basis for developing practically applicable methods and tools to make implementation work more efficient and effective.”
Our focus is Brazilian software developers, more specifically, a subset from those software developers surveyed in [5]. While methods and tools might target architects in the documents’ creation, in this study, we asked stakeholders about their view as users of the documentation.
In this study, we refined the four research questions used in [5]:
-
•
RQ1: Which architectural information do stakeholders currently receive for support the activities and which problems do they perceive?
-
•
RQ2: Which representation of architectural information do stakeholders currently receive for support the activities and which problems do they perceive?
-
•
RQ3: Which architectural information would stakeholders like to get for their activities?
-
•
RQ4: Which representation of architectural information would stakeholders like to get for their activities?
II Research Methodology
We followed the activities described in Kitchenham et al. approach [7]: setting the objectives, survey design, developing and evaluating the survey instrument (online questionnaire), conducting the survey, and analyzing the data.
II-A Planning the Survey
The focus group for the survey was software stakeholders in industry. According to [1], a stakeholder of an architecture is someone who has a vested interest in it.
Thereby, it was not important whether they actually had software architecture documentation available in their work, because asking them about their wishes for the future was possible in either way.
To distribute information about the survey we decided to use email, however we did not want to just contact random software companies. To increase the chances for a higher response rate, we compiled a list of fitting past and current contacts from industry.
As we typically have only one or two contact persons, we contacted them directly and asked to distribute the information about the survey internally to software stakeholders in their organization. In this way, we contacted IT organizations (25 from Brazil), with four to around 100,000 employees.
II-B Designing and Conducting the Survey
The research questions provided the framework for derivation of our survey questions. Figure 1 presents the resulting survey questions structure as a matrix. The key distinction between the as-is situation for the participant and wishes for a to-be situation related to architecture documentation. Moreover, we asked for information about the participants’ background.
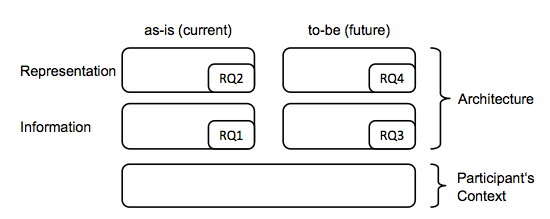
Figure 2 presents the survey questions flow. It starts with a question about the availability of architecture documentation for the participants. This question has an impact on the further survey questions flow: only if a participant indicates that he has architecture documentation available, the questions about the as-is situation are asked, otherwise they are not visible for the participant.
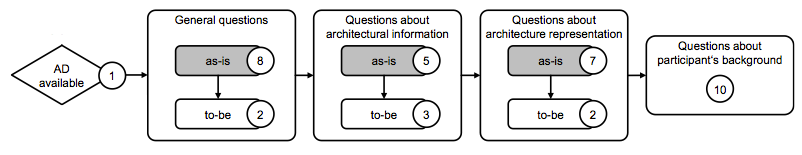
The survey main part are three pages of questions, each visually separated into a set for the as-is situation and a set for the to-be situation: first, we asked general questions about architecture documentation, not differentiating between the information aspects and their representation. Second, we asked questions with a focus on architectural information in architecture documentation. Third, we asked questions about the architecture information representation. Finally, we asked questions about the participants’ background.
We had two types of questions: first, question with a fixed set of answers, partially single and partially multi selection ones. Second, there were questions with a free text answer. Moreover, we created an online questionnaire containing 42 questions. We conducted the survey in the period from December 1st, 2012 to January 31st, 2013.
II-C Analyzing the Data
Only a subset of the participants who started the survey actually finished it. We considered the survey as finished when the participants finished and submitted it. For the analysis and evaluation, when we talk about participants we refer to the ones having finished the survey.
In total, 147 stakeholders (31 Brazilians) from different countries (such as Germany, Brazil, Finland, Japan, USA, and Sweeden) participated and have been included in the data analysis.
To analyze the Brazilian perspective, we separate the Brazilian stakeholders (BRA) from the other (N-BRA) participants. Nevertheless, we did not have a complete data set for each question, as not all questions were mandatory. That is, for each question the sample varies.
As described, we asked for this availability and excluded the questions about current architecture documentation if there is none. Not all participants had architecture documentation available for their tasks. Thus, for the questions about current architecture documentation we have only answers of a subset of the participants.
For questions with fixed answers we counted the results in the analysis. For the evaluation of free text results, we grouped the answers into coherent categories with a name chosen by us as perceived meaningful to cover the full range of answers.
Then we also aligned these answer categories across questions where it was meaningful. Finally, we analyzed the survey data based on descriptive statistics and hypothesis testing.
III Results
In this section we analyzed all the survey participants answers.
III-A Overview of Survey Participants and their Context
All participants work in industry and are related to software development. In case of the Brazialian participants, they are affiliated to Brazilian or multinational companies located in Brazil.
The survey aims at the development perspective on software architecture. Figure 3 depicts the distribution of participants’ occupational positions.
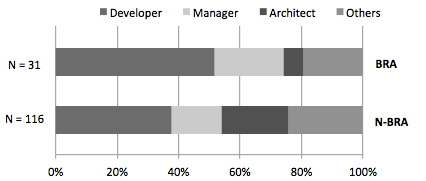
We use the stakeholders classification proposed by [1]. Moreover, we considered developer as a synonym for implementer. As suggested by Garlan, the implementer is responsible for the development of specific elements according to designs, requirements, and architecture. In other words, they have the same meaning.
The survey initial purpose focused only on how developers used the architecture documentation. Since the documentation is constantly used by several stakeholders, we included software development stakeholders such as architects, designers, testers, etc.
The Brazilian participant largest group is developers (52%), followed by managers (22%) and architects (7%). On the other hand, the participation of non-Brazilian developers (38%) and architects (22%) was significant. The participants’ position was asked as free text, thus we grouped the answers into the depicted categories.
In order to evaluate the participants professional experience in their position, we asked them for the number of years working in this or a similar position. The answers, grouped from an open question, were the following:
-
•
0 to 3 years: BRA – 16% and N-BRA – 33%;
-
•
4 to 7 years: BRA – 52% and N-BRA – 33%;
-
•
8 to 11 years: BRA – 23% and N-BRA – 15%;
-
•
12 to 15 years: BRA – 3% and N-BRA – 12%; and
-
•
more than 15 years: BRA – 6% and N-BRA – 13%.
In order to characterize the participants affiliation, we asked for the industry sectors they work in (see Figure 4). Most participants (both Brazilian and non-Brazilian) work for companies that have software development for multiple industries (27%) as their main business. Other Brazilian strong sectors in our survey are government (13%), energy (10%), finance (10%), and telecommunication (10%). The non-Brazilian strong sectors are building construction management (13%) and automotive (10%)
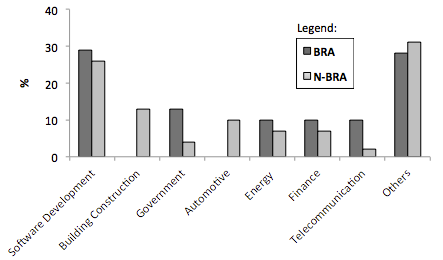
While the survey in general was anonymous, we asked the participants at the end whether they agree with publishing their company’s name in the study. Participating companies included among others: Recife Center for Advanced Studies and Systems (C.E.S.A.R), Accenture, Ogilvy & Mather, Serpro, Dataprev, ThoughtWorks.
We identified differences in the number of people in the companies contributing to software development. The answers were the following:
-
•
none: BRA – 0% and N-BRA – 15%;
-
•
less than 100: BRA – 39% and N-BRA – 44%;
-
•
100 to 1000: BRA – 26% and N-BRA – 34%;
-
•
1001 to 5000: BRA – 22% and N-BRA – 3%; and,
-
•
more than 5001: BRA – 13% and N-BRA – 4%;
The majority (BRA – 58% and N-BRA – 45%) of the participants companies develops software according to a combination of agile and conventional development processes. In the case of Brazilian stakeholders, 23% work with agile development processes, only 6% work with conventional development processes, and 13% do not use a structured development process at all. The numbers are similiar for non-Brazilian participants, 32% work with agile development processes, and only 7% work with conventional development processes.
Furthermore, we asked them to rate the product size they are contributing to. In order to simplify the answering, the participants defined the product size estimate, were the following:
-
•
very large: BRA – 19% and N-BRA – 22%;
-
•
large: BRA – 26% and N-BRA – 32%;
-
•
medium-size: BRA – 29% and N-BRA – 34%
-
•
small: BRA – 23% and N-BRA – 9%; and,
-
•
very small: BRA – 3% and N-BRA – 4%.
Finally, we identified that 87% of the Brazilian stakeholders that work with large product size, also work with a combination of agile and conventional development process.
III-B Architectural Information: The as-is Situation
In the general questions, we asked “What do you consider as the main problems with the architecture documentation you work with?” and received with respect to architectural information the following most frequent questions:
-
•
Outdated architecture documentation;
-
•
Inadequate level of granularity;
-
•
Implementation not in sync with architecture; and
-
•
Unnecessary information.
We asked about the amount of architecture documentation available and its up-to-dateness. The results are depicted in Figure 5. This also confirms that architecture documentation is often not up-to-date and if at all updated with a strong delay. This supports the findings reported in [8].
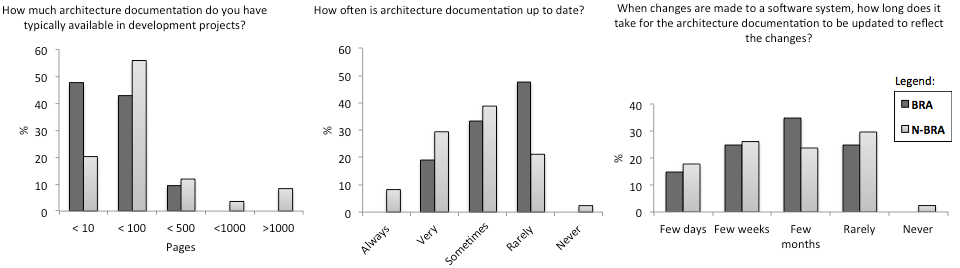
The stakeholders’ majority has access to architecture documentation with less than 100 pages (BRA – 43% and N-BRA – 56%). It is worthwhile to mention that almost half of the Brazilian participants (48%) has, only, 10 pages of architecture documentation available in their development projects.
Moreover, 56% of the participants (both Brazilian and non-Brazilian) deal with documents up to 10 and 100 pages. Addressing this concern, 83% of them document the architecture of very large (22%), large (29%) and medium (33%) products. In other words, stakeholders that work with larger product size, have insufficient documentation available (fewer pages).
About the architecture documentation up-to-dateness, on the one hand, only 8% of the participants (non-Brazilian stakeholders) access documentation that is always up-to-date, on the other, 48% of the Brazilian stakeholders access documentation that is rarely up-to-date.
We also identified that, in the case of the Brazilian participants, 70% of the documentation up to 10 pages are rarely up-to-date. Therefore, two facts were observed: (i) The project architecture did not change and (ii) The architectural decision making is not documented at all.
Finally, we asked the participants “When changes are made to a software system, how long does it take for architecture documentation to be updated to reflect the changes?” The answers were the following:
-
•
Few days: BRA – 15% and N-BRA – 18%;
-
•
Few weeks: BRA – 25% and N-BRA – 26%;
-
•
Few months: BRA – 35% and N-BRA – 24%;
-
•
Rarely: BRA – 25% and N-BRA – 30%; and
-
•
Never: BRA – 0% and N-BRA – 2%.
When changes occur in the project documents up to 100 pages, they are rarely updated (53%). In documentation up to 10 pages, 27% of the documents are rarely up-to-date.
Regarding the architecture documentation quality, the Figure 6 presents how the stakeholders rate the architecture documentation quality.
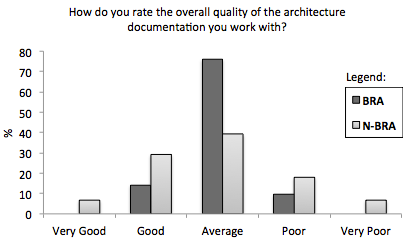
Although access outdated documents with a small number of pages, the participants majority considers the quality of the document as average (BRA – 76% and N-BRA – 39%). Furthermore, 96% of the documentation that rarely reflects the changes are qualified as poor (37%) and average (60%).
We asked the participants to rate their perceived adequacy of the amount of architecture information provided (as it can be seen in Figure 7). A tendency can be observed that there is rather too little architectural information available (BRA – 48% and N-BRA – 44%). Some participants agree that there is also necessary information but most participants see unnecessary information provided.
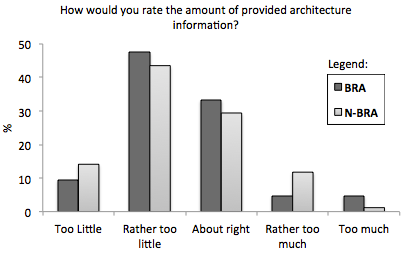
Figure 8 presents the amount of unnecessary (overhead) information in the architecture documentation. While most Brazilian participants (38%) work with documentation that contains a lot of unnecessary information, this is not an issue for most non-Brazilian participants (45%).
Moreover, it is worthwhile to mention that part of these non-Brazilian stakeholders (49%), work with documentation up to 100 pages that are Very Often (38%) or Sometimes (38%) updated.
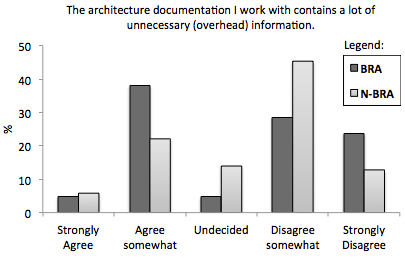
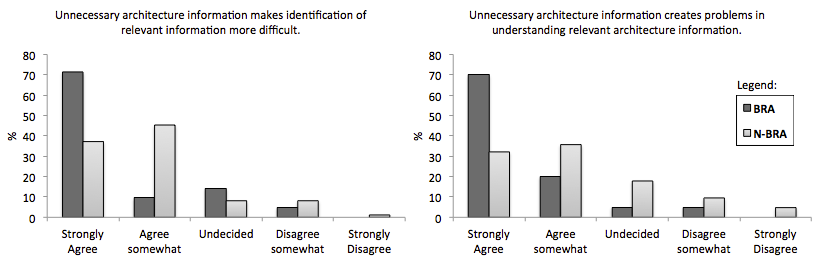
Figure 9 shows that most of participants confirms that unnecessary information in the architecture documentation interferes on the understanding of architecture information making identification of relevant information more difficult.
We also asked the participants “Do you see any other problems or consequences because of unnecessary architecture information?” the following most frequent questions:
-
•
Unnecessary information make the stakeholder pay attention in points that are not relevant;
-
•
It make the documents long and difficult to read;
-
•
People tend to loose interest if given too complex or blurred information to handle; and
-
•
Using time to create and update unnecessary architecture information is obviously time away from something more important.
III-C Representation of the Architectural Information: The as-is Situation
In the general questions, we asked “What do you consider as the main problems with the architecture documentation you work with?” and received with respect to representation of architectural information, the following most frequent questions:
-
•
Inconsistencies and missing structure;
-
•
Information scattered across documents; and
-
•
Missing traceability to other artifacts.
In order to get some insights into the problems with the representation of architecture information, we asked the question described in Table I.
| Answer Category | BRA (%) | N-BRA (%) |
|---|---|---|
| Unnecessary information | 40 | 3 |
| Documents not up-to-date | 30 | 0 |
| Missing details in the written description | 20 | 3 |
| Targets too many groups | 10 | 13 |
| Missing common formats and structures | 0 | 20 |
| Other | 0 | 60 |
We asked about the main formats in which architecture documentation is provided. Architecture documentation is mostly provided as electronic documents (BRA – 68% and N-BRA – 65%), model files (BRA – 35% and N-BRA – 38%), and web pages (BRA – 23% and N-BRA – 36%).
In contrast to what Petre states in [9], UML is the key notation for the description of software architecture in our survey (BRA – 55% and N-BRA – 58%). In Brazil, ADLs are not used at all and only 6% of the non-Brazlian participants worked with it.
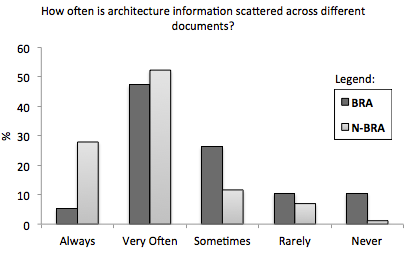
Moreover, the architecture information is often described in Natural Language (BRA – 55% and N-BRA – 71%). The participants also used other forms of representation such as visio, pseudo-code, and informal diagrams. Another result is that architecture information is scattered across documents (see Figure 10).
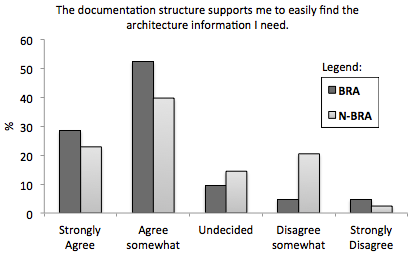
We asked the participants how they perceive the support of their architecture documentation to find specific information and to conduct their development tasks. Figure 11 presents a tendency that the participants perceive the representation as adequate. To refine the insights about the problems finding the needed architecture information, we asked the question described in Table II.
| Answer Category | BRA (%) | N-BRA (%) |
|---|---|---|
| Documents not up-to-date | 29 | 7 |
| Missing strong search functionality | 21 | 13 |
| Too much information | 14 | 4 |
| Missing information | 14 | 4 |
| Information scattered across documents | 7 | 18 |
| Missing traceability | 7 | 13 |
| Other | 7 | 18 |
| Missing clarity in structure | 0 | 24 |
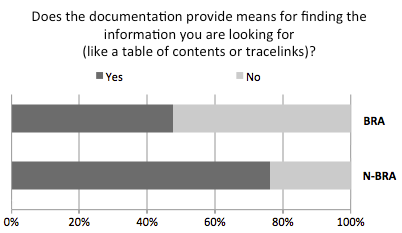
Figure 12 presents that only 50% of the Brazilian participants work with documentation that provide means for finding the information they are looking for.
We also asked the participants what means are included, the following most frequent questions:
-
•
Table of Contents;
-
•
Hyperlinks and Tracelinks;
-
•
Search engine;
-
•
Full-text search of wiki pages; and
-
•
Tagging.
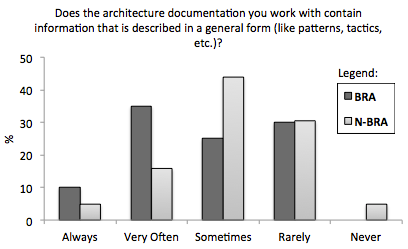
Figure 13 presents how frequent the architecture documentation is described in a general form. 35% of the Brazilian participants work, Very Often, with information described in patterns, tactics, etc. In contrast, 44% of the non-Brazilian participants work with this kind of information.
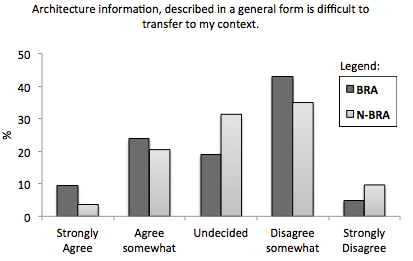
We asked the participants “Architecture Information, described in a general form is difficult to tranfer to my context” as it can be seen in Figure 14. Moreover, the participants’ majority (BRA – 43% and NBRA – 35%) disagree with the question.
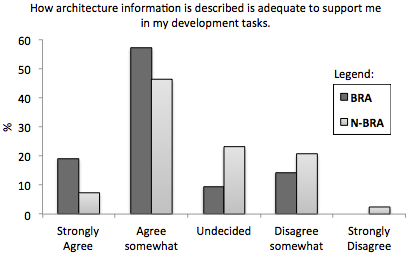
Finally, Figure 15 presents the documentation adequacy to support the participants’ development tasks. Both, Brazilian participants (57%) as well as non-Brazilian participants (46%) agree somewhat with the question.
III-D Architectural Information: The to-be Situation
In the general questions, we asked “What are your wishes in general for the future of architecture documentation?” and received with respect to architectural information the following most frequent questions:
-
•
Up-to-date;
-
•
In sync with implementation;
-
•
Providing a system overview and the big picture; and
-
•
Specific for stakeholders, tasks and contexts.
Furthermore, we asked the participants “What architecture information do you need for best support of your development tasks?” We identified that it is more important to stakeholders to get an overall understanding of the complete system, as well as detailed information on components in their scope together with interfaces and relationships to other components. Table III presents an overview.
| Answer Category | BRA (%) | N-BRA (%) |
|---|---|---|
| Components, interfaces, relationships | 47 | 33 |
| Big picture | 28 | 13 |
| Functional modularization | 15 | 7 |
| Others | 10 | 29 |
| Data model and data flow | 0 | 10 |
| Patterns and best practicies | 0 | 8 |
III-E Representation of Architectural Information: The to-be Situation
We asked the question “What are your wishes in general for the future of architecture documentation?” and got with respect to representation of architectural information the following most frequent questions:
-
•
Easy creation, handling, updating, and maintenance;
-
•
Integrated information, artifacts and tools;
-
•
Readable and understandable; and
-
•
Consistent, structured, and described.
Moreover, we also asked the participants “In what format should architecture documentation be provided in the future?” Table IV presents an overview. It can be noted that webpages and electronic documents are the wishes.
| Answer Category | BRA (%) | N-BRA (%) |
|---|---|---|
| Webpages | 41 | 16 |
| Electronic documents | 21 | 20 |
| Diagrams | 12 | 21 |
| UML | 9 | 18 |
| Wikis | 9 | 7 |
| Natural language | 4 | 17 |
| Other | 4 | 1 |
Then we asked “What means should architecture documentation provide to help you in finding the information you need?” It can be observed that stakeholders wish for interactive ways of working with architecture documentation, where it is possible to search information in different ways and navigate through hierarchical structures and related elements. Also mapping the architecture to the implementation (source code) have been rated as important. Table V presents an overview of the result data.
| Answer Category | BRA (%) | N-BRA (%) |
|---|---|---|
| Interactive search functionality | 21 | 20 |
| Links and navigation | 21 | 19 |
| Mapping to implementation | 16 | 5 |
| Other | 16 | 27 |
| Traces to artifacts | 11 | 13 |
| Directories | 10 | 8 |
| Clear structure | 5 | 8 |
Finally, we asked how architecture should be described to make it useful for the developer’s implementation task. Table VI presents the results. It becomes evident that clarity and structure are of highest importance, in diagrams and language.
| Answer Category | BRA (%) | N-BRA (%) |
|---|---|---|
| Self-explaining, simple diagrams | 50 | 17 |
| Clear, concise, uniform, consistent | 36 | 10 |
| Clear terminology and language | 14 | 8 |
| Other | 0 | 65 |
III-F Statistic Descriptive Analysis
To identify relevant insights, we analyzed all the information produced by the participants. The analysis was performed based on Shapiro-Wilk normality test and Mann-Whitney-Wilcoxon [6] (for non-parametric statistical hypothesis test).
The Likert scale [10] (used in some questions of the survey) measures the extent to which a person agrees or disagrees with the question. The most common scale is 1 to 5. For this reason the following scale were used:
-
•
Strongly Disagree = 1;
-
•
Disagree somewhat = 2;
-
•
Undecided = 3;
-
•
Agree somewhat = 4; and
-
•
Strongly Agree = 5.
We selected five survey questions to analyze them:
-
•
Q1: The architecture documentation I work with contains a lot of unnecessary (overhead) information?
-
•
Q2: Unnecessary architecture information makes identification of relevant information more difficult?
-
•
Q3: The documentation structure supports me to easily find the architecture information I need?
-
•
Q4: Architecture information, described in general form is difficult to transfer to my context?
-
•
Q5: The way how architecture information is described is adequate to support me in my development tasks?
III-F1 Hypothesis Formulation
Based on the previously selected questions, we set up five hypotheses to identify if the Brazilian participants (described below as ) answered the questions differently from the non-Brazilian participants (described below as ).
The Null Hypothesis () considered that there was no difference in the answers. The Null hypotheses are:
Conversely, the Alternative Hypothesis () stated the opposite values. The alternative hypothesis determined that Brazilian participants (described below as ) answer the questions differently from the non-Brazilian participants. We herein define the set of alternative hypotheses, as follows:
III-F2 Hypotheses Testing
First, in order to reduce the dataset errors, we eliminated the outliers. Second, we verified if the sample came from a normally distributed population through Shapiro-Wilk test [6]. Third, since Likert scale questions do not possess a normal probability distribution, in other words, the samples were not “normal”, we used a non-parametric test (Mann-Whitney-Wilcoxon [6]) to analyze the hypothesis.
The tests are primarily presented for a significance level of 5%. Table VII presents the hypothesis testing results from the selected survey questions. The results are detailed next.
| Question | p-value | Statistical Diference? |
|---|---|---|
| Q1 | 0.878 | No |
| Q2 | 0.031 | Yes |
| Q3 | 0.192 | No |
| Q4 | 0.641 | No |
| Q5 | 0.046 | Yes |
As regards the unnecessary information in the documentation (overhead), there were no differences in the answers of Brazilian and non-Brazilian participants. The Null Hypothesis cannot be rejected, since there is no significant difference. The p-value = 0.878, is higher than 5%, which did not reject the null hypothesis, answering the Q1.
Regarding Q2 (Unnecessary information makes identification of relevant information more difficult), the amount of Brazilian participants answers is higher than the non-Brazilian, p-value = 0.031. The p-value is smaller than the significance level, rejecting the null hypothesis .
Moreover, the Null Hypothesis and cannot be rejected, since p-value = 0.192 and 0.641 are higher than the significance level the hypotheses cannot be rejected and no conclusion can be drawn.
Therefore, in regard to Q3 (support to easily find architecture information) and Q4 (information described in general form is difficult to transfer to their context), there are no significant differences between the answers from Brazilian and non-Brazilian participants.
Finally, regarding the Q5 (adequacy to support the stakeholders development task), the p-value = 0.046, is lower than 0.05, rejecting the Null Hypothesis . In other words, there were differences in the answers of Brazilian and non-Brazilian participants.
IV Discussion
In this section, we present the main findings, discuss the survey results, and describe threats to validity.
IV-A Main Findings
This section describes the results of the survey. Please note that the results of the general questions are consistently integrated into this structure. Since this study focused on the perspective of the Brazilian participants, we identified 5 main findings regarding this issue, which are summarized below:
-
1.
The Brazilian stakeholders are used to work small documents (less than 100 pages). The majority of the documentation is provided with unnecessary and outdated information;
-
2.
The decision making is lost during the project development because there is no concern with traceability;
-
3.
The stakeholders (both Brazilian and non-Brazilian stakeholders) wish online and interactive documentation with a powerful search tool that return a more accurate result;
-
4.
The Brazilian stakeholders do not use formal ADLs to document the architecture; and finally,
-
5.
The architecture documentation of most large companies (more than 1500 employees) are small (less than 10 pages) and rarely updated.
IV-B Survey Results
In accordance with [11], in Brazil, the majority of software development companies is composed by small and medium-sized enterprises (Small companies have up to 100 employees and medium-sized have up to 500 employees). In many cases, there is no investment in documentation. As stated by Clements et al. [1], “documentation is often treated as an afterthought”. From this context, we revisit our main research questions and the responses we received from the participants.
In regard to architectural information, we identified the same participants concern to up-to-dateness as described in [5]. The documents used by Brazilian stakeholders are simple (due to the small number of pages) but they need the description of the right information.
Regarding the representation of architecture information, the development of a “online documentation” was the main concern of stakeholders. They considered the implementation of a website to allow the easy creation, handling, updating, and maintenance of the architecture documentation. Moreover, all the information about the architecture (including traceability and decision making) can be concentrated in one place.
The automation of some parts of the architecture documentation is needed, but how to do it once the stakeholders are reluctant to adopt ADLs and DSLs (Domain Specific Languages)? The use of specific languages enables the connection of the architecture documentation with the source code. The changes in the architecture can be mapped in the source code and vice-versa.
As the statistic analysis confirms, the amount of unnecessary architecture information makes identification of relevant information more difficult for the Brazilian stakeholders. Furthermore, the information description is inadequate to support their development tasks.
Finally, in the survey context, we identified that the ideal architecture documentation has up to 100 pages sometimes updated and reflecting the source code changes monthly. Moreover, the number of pages and update frequency are influenced by the system complexity and, consequently, the product size.
IV-C Threats to Validity
According to Wohlin et al. (2000), it is important to consider the question of validity already in the planning phase in order to anticipate possible threats involved in the context of a survey. Following, we describe threats to validity and limitations of the survey.
IV-C1 Generalization of participants
This is an effect of having a participant population not representative of the population we would like to generalize to, i.e. the wrong people participating in the survey.
For this reason, we decided to invite the participants using e-mail, however we did not want to just contact random software companies. To increase the chances for a high response rate, we compiled a list of fitting past and current customers and project partners from industry.
As we typically have only one or two contact persons, we contacted them directly and asked to distribute the information about the survey internally to stakeholders in their organization with the request to participate.
IV-C2 Maturation
This is the effect that subjects react differently as time passes. Some subjects can be affected negatively (feel bored or tired) during the survey. In order to mitigate this boredom, the subjects were free to choose the moment when they were comfortable. Even so, only 147 of the 350 participants completed the survey.
IV-C3 Evaluation apprehension
Some people are afraid of being evaluated [6]. The participants could be afraid that the survey affected their work. In order to avoid this risk, we explained that the survey in general was anonymous. None of their personal information were exposed. During the survey completion, the participants executed their activities without pressure and without time restriction.
IV-C4 Language comprehension
As this research was done in a German-Brazilian cooperation with many participants from Germany and Brazil, we offered the participants to choose their preferred languages such as German, Portuguese and in addition, English.
V Concluding Remarks and Future Work
We conducted a study on the as-is situation of software architecture documentation from the perspective of Brazilian stakeholders. We analyzed the contributions from 147 (Brazilian and non-Brazilian) participants from industry (31 of them from Brazil).
The software architecture is a topic of interest of many companies. Learn how to document the software architecture is essential in to produce high-quality products, reduce costs and rework, and maintain the traceability [1].
We identified some improvement opportunities in [5], which were extended with the Brazilian perspective in this work. The Brazilian stakeholders concerns in not so different from international stakeholders concerns. For this reason, some of our main findings are similar but with some particular differences.
The stakeholders wish the creation of self-explaining and simple diagrams. They need clear, concise, uniform, and consistent information. The architecture documentation has to become up-to-date and interactive. The development of a website combined with a powerful search tool is needed.
We believe that architecture documentation should be created for the user understanding. Moreover, the automation of some parts of the documentation will reduce the effort during the creation of the documents. But first, is necessary to change the stakeholders “culture”. They have to become active actors on the creation of the architecture documentation.
Finally, it is necessary to document and update the “right information”, in the “right moment”. Complex systems tend to require detailed architecture documentation. On the one hand, companies with high employees turnover that invest in documentation, reduce the costs when hiring a new employee. On the other hand, when the architecture is constantly changing, it is relevant to document the architectural decision making.
V-A Future Work
We intend to extend this work to Product Line Architecture documentation. We propose to investigate the differences from single system architecture documentation to Product Line Architecture documentation.
In most cases of the Brazilian context, the necessity of architecture documentation appears when the companies finish the code. For this reason, we also propose the investigation of software architecture recovery techniques.
Acknowledgment
This survey has been conducted in the context of the Fraunhofer Germany-Brazil cooperation between Fraunhofer IESE and UFBA. We would like to thank all the participants that contributed by answering our questions. This work was funded by IFBA grants EDITAL Number BP003-04/2014/PRPGI.
References
- [1] D. Garlan, F. Bachmann, J. Ivers, J. Stafford, L. Bass, P. Clements, and P. Merson, Documenting Software Architectures: Views and Beyond, 2nd ed. Addison-Wesley Professional, 2010.
- [2] N. Rozanski and E. Woods, Software Systems Architecture: Working With Stakeholders Using Viewpoints and Perspectives. Addison-Wesley Professional, 2005.
- [3] “Iso/iec/ieee systems and software engineering – architecture description,” ISO/IEC/IEEE 42010:2011(E) (Revision of ISO/IEC 42010:2007 and IEEE Std 1471-2000), pp. 1–46, Dec 2011.
- [4] R. Farenhorst and R. de Boer, “Knowledge Management in Software Architecture: State of the Art,” in Software Architecture Knowledge Management, M. Ali Babar, T. Dings√∏yr, P. Lago, and H. van Vliet, Eds. Springer Berlin Heidelberg, 2009, pp. 21–38.
- [5] D. Rost, M. Naab, C. Lima, and C. von Flach Garcia Chavez, “Software Architecture Documentation for Developers: A Survey,” in 7th European Conference on Software Architecture. Montpellier, France: Springer, 2013.
- [6] C. Wohlin, P. Runeson, M. C. O. Martin Höst, B. Regnell, and A. Wesslén, Experimentation in Software Engineering: An Introduction, ser. The Kluwer Internation Series in Software Engineering, V. R. Basili, Ed. Norwell, Massachusets, USA: Kluwer Academic Publishers, 2000.
- [7] B. Kitchenham and S. Pfleeger, “Personal Opinion Surveys,” in Guide to Advanced Empirical Software Engineering. Springer London, 2008, pp. 63–92.
- [8] T. C. Lethbridge, J. Singer, and A. Forward, “How software engineers use documentation: The state of the practice,” IEEE Softw., vol. 20, no. 6, pp. 35–39, Nov. 2003.
- [9] M. Petre, “UML in Practice,” in Proceedings of the 2013 International Conference on Software Engineering, ser. ICSE ’13. Piscataway, NJ, USA: IEEE Press, 2013, pp. 722–731.
- [10] S. Jamieson, “Likert scales: how to (ab)use them,” Medical Education, vol. 38, no. 12, pp. 1217–1218, 2004.
- [11] SOFTEX, Software e Serviços de TI: A indústria brasileira em perspectiva, 2nd ed. Observatório SOFTEX, 2012, vol. 1. [Online]. Available: http://publicacao.observatorio.softex.br/