On the stellar halo metallicity profile of Milky Way-like galaxies in the Auriga simulations
Abstract
A recent observational study of haloes of nearby Milky Way-like galaxies shows that only half (four out of eight) of the current sample exhibits strong negative metallicity ([Fe/H]) gradients. This is at odds with predictions from hydrodynamical simulations where such gradients are ubiquitous. In this Letter, we use high resolution cosmological hydrodynamical simulations to study the [Fe/H] distribution of galactic haloes. We find that kinematically selected stellar haloes, including both in-situ and accreted particles, have an oblate [Fe/H] distribution. Spherical [Fe/H] radial profiles show strong negative gradients within 100 kpc, in agreement with previous numerical results. However, the projected median [Fe/H] profiles along the galactic disc minor axis, typically obtained in observations, are significantly flatter. The median [Fe/H] values at a given radius are larger for the spherical profiles than for the minor axis profiles by as much as 0.4 dex within the inner 50 kpc. Similar results are obtained if only the accreted stellar component is considered indicating that the differences between spherical and minor axis profiles are not purely driven by heated disc star particles formed in situ. Our study highlights the importance of performing careful comparisons between models and observations of halo [Fe/H] distributions.
keywords:
galaxies: formation – galaxies: haloes – galaxies: spiral – methods: numerical – methods: Hydrodynamical simulations1 Introduction
The stellar halo metallicity distributions of massive disc galaxies contain important information about their formation histories. Thus, they offer a direct test of galaxy formation models. While models of stellar halos built entirely from accretion events predict mostly flat metallicity profiles (Font et al., 2006; De Lucia & Helmi, 2008; Cooper et al., 2010; Gómez et al., 2012), models which include the contribution of in-situ star formation predict that haloes should have strong negative metallicity gradients (e.g., Font et al., 2011; Tissera et al., 2014).
Hydrodynamical simulations have successfully reproduced the metallicity profile observed in M31’s halo (Font et al., 2011). However, there seems to be some disagreement with the halo profiles observed in other nearby disc galaxies (Monachesi et al., 2013, 2016). Only half of the current sample of eight studied galaxies (including M31 and the MW) presents strong gradients whereas the remaining half shows nearly flat metallicity profiles. The reason behind this discrepancy could plausibly lie in the different ways that observed and modelled metallicity profiles are derived. Results from simulations usually present spherically averaged metallicity profiles (Font et al., 2011; Tissera et al., 2013, 2014). In the Milky Way (MW) and all other massive disc galaxies, measurements of stellar halo metallicity profiles are made only for particular lines of sight which are, most commonly, perpendicular to the galactic disc plane (see e.g., Sesar et al. 2011 for the MW, Gilbert et al. 2014 for M31, Monachesi et al. 2016 for GHOSTS galaxies), although see Ibata et al. (2014) for M31.
In this Letter we investigate the differences between spherically averaged and line of sight metallicity profiles of stellar haloes using high resolution cosmological hydrodynamical simulations of the formation of MW-like galaxies. Thanks to their high mass resolution, these simulations allow us to investigate in detail stellar halo properties of individual simulated galaxies, rather than averaged properties from large lower resolution simulations. Our goal is to explore whether the reported tension between models and observations is real or due to inconsistencies in the way they are compared.
2 Numerical Simulations
We use four high resolution cosmological zoom-in simulations of MW-sized galaxies from the “Auriga” simulation suite, performed using the state-of-the-art cosmological magneto-hydrodynamical code AREPO (Springel, 2010). A detailed description of these simulations can be found in Grand et al. (2016, hereafter G16). Here we briefly describe their main features.
Candidate galaxies were first selected from a parent dark matter only cosmological simulation, carried out in a periodic cube of side 100Mpc. A CDM cosmology was adopted, with parameters , , , and Hubble constant = 100 km s-1 Mpc-1, (Planck Collaboration et al., 2014). Haloes were selected to have masses comparable to that of the MW’s and to be relatively isolated at . By applying a multi-mass particle ‘zoom-in’ technique, each halo was re-simulated at a higher resolution.
Gas was added to the initial conditions and its evolution was followed by solving the Euler equations on an unstructured Voronoi mesh. The typical mass of a dark matter particle is M⊙, and the baryonic mass resolution is M⊙. The physical gravitational softening length grows with the scale factor up to a maximum of 369 pc, after which it is kept constant. The softening length of gas cells is scaled by the mean radius of the cell, with maximum physical softening of 1.85 kpc. The simulations include a comprehensive model for galaxy formation physics (see G16) which includes the most important baryonic processes. The model is specifically developed for the AREPO code and was calibrated to reproduce several observables such as the stellar mass to halo mass function, the galaxy luminosity functions and the history of the cosmic star formation rate density.
A summary of the properties of the galaxies analysed in this work is presented in Table 1. These four galaxies are a subset of the simulation suite introduced in G16 and were chosen to clearly illustrate our results. The full suite shows consistent results with those presented here and will be analysed in more detail in a follow-up work.
| Simulation | ||||||
|---|---|---|---|---|---|---|
| Au 2 | 191.5 | 261.8 | 4.63 | 5.84 | 1.45 | 1.34 |
| Au 6 | 104.4 | 213.8 | 3.92 | 4.53 | 0.67 | 1.30 |
| Au 15 | 122.2 | 225.4 | 3.14 | 4.00 | 0.39 | 0.90 |
| Au 24 | 149.2 | 240.9 | 3.68 | 5.40 | 2.18 | 0.93 |
3 Stellar halo definition
The definition of a stellar halo is rather arbitrary and several different criteria have been used in the past to isolate halo from disc and bulge star particles in simulated disc galaxies. Following previous work, we first define the stellar halo purely based on a kinematic decomposition, regardless of an in-situ or accreted origin for the stars. Discs are aligned with the XY plane as in Gómez et al. (2016). For each star particle, we compute the circularity parameter (Abadi et al., 2003). Here is the angular momentum around the disc symmetry axis and is the maximum specific angular momentum possible at the same specific binding energy, . Three different subsets of star particles, with and 0.65, are selected as the spheroidal component. The contamination from particles with disc kinematics in these subsets decreases with decreasing . The first and weakest constraint (i.e., ) is equivalent to the one adopted by, e.g., Font et al. (2011); McCarthy et al. (2012); Cooper et al. (2015). The third and more restrictive constraint (i.e. ) has been used by, e.g., Tissera et al. (2013, 2014). Following Cooper et al. (2015), particles from the spheroidal component that lie within 5 kpc from the galactic centre are defined to be bulge. Here we do not attempt to select halo star particles as accurately as possible. Instead, our goal is to replicate previously (and commonly) used selection criteria. We also analyse a set of particles with no constraint on , which is readily comparable to observations.
In addition, we analyse a second sample of star particles containing only accreted particles. This allows us to compare with previous results based purely on the accreted component of simulated galaxies (e.g. Font et al., 2006; Cooper et al., 2010; Gómez et al., 2012; Pillepich et al., 2015). One should bear in mind, however, that some of these models are based on dark matter only simulations (e.g. Cooper et al., 2010; Gómez et al., 2012). Thus, the dynamical evolution of the baryonic component in such simulations is simplified due to, e.g., the lack of a disc gravitational potential (see e.g., Bailin et al., 2014). In this work we consider a particle to be accreted if, at its formation time, it was bound to any subhalo other than the host. The stars that form out of gas that was stripped from infalling satellites and has not yet mixed with the surroundings are not included in this sample.
We note that there is an overlap between the kinematically-selected and accreted sets of stellar particles. Since the accreted component of a galaxy dominates beyond 20–30 kpc (e.g. Abadi et al., 2006; Zolotov et al., 2009; Pillepich et al., 2015; Cooper et al., 2015), the star particles in the outer regions ( kpc) are mostly the same in both samples. In all cases only star particles that at are gravitationally bound to the host galaxy are selected.
4 Results
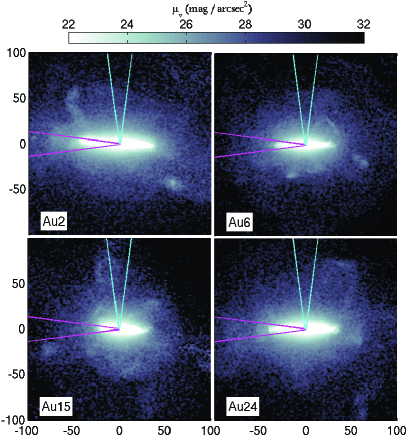
In Figure 1 we show the stellar band surface brightness map of the four galaxies analysed in this work. Only star particles that at are gravitationally bound to the main galaxy are used to create the maps. A visual inspection reveals differences between, e.g, disc size (see Table 1) and amount of substructure and stellar halo shapes. The diversity in morphological properties of these MW-like simulated galaxies reflects the stochasticity inherent to the process of galaxy formation (e.g. Bullock & Johnston, 2005; Cooper et al., 2010).
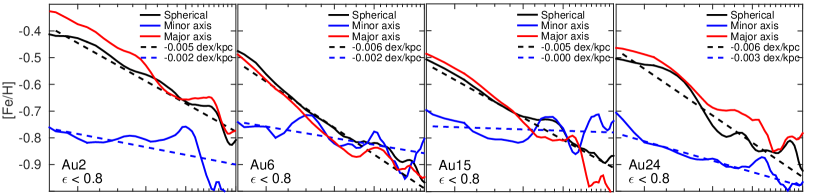
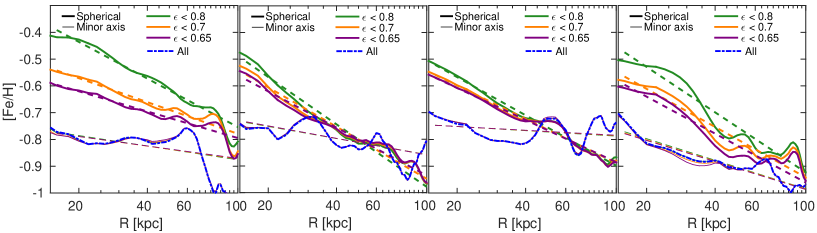
Figure 2 shows median metallicity [Fe/H] profiles for the kinematically selected stellar halo stars. The profiles are shown between 15 and 100 kpc from the galactic centre. These are the regions generally targeted by observations of external stellar haloes, given the difficulty of isolating halo stars in the inner regions of a disc galaxy. The black lines show the overall median [Fe/H] profile, computed in spherical shells around the galactic centre. We refer to this as the spherical profile. The blue and red solid lines show median [Fe/H] profiles along the minor and major axes respectively. These are computed in projected wedges, as illustrated in Figure 1. To increase the number of particles and smooth out sudden variations due to the presence of substructure, we include on both axes particles located within the diametrically opposed wedge. As already stated, observed stellar halo [Fe/H] profiles are typically obtained along galaxy minor axes (e.g. Sesar et al., 2011; Gilbert et al., 2014; Monachesi et al., 2016; Peacock et al., 2015). The spherically averaged [Fe/H] profiles generally presented in theoretical works (e.g., Font et al., 2011; Tissera et al., 2013, 2014) cannot currently be measured either for external galaxies or for the MW.
The top panels of Fig. 2 show the results obtained with . These expose very significant differences between the spherical (black solid lines) and minor axis (blue solid lines) profiles. At least within the inner 50 kpc, the spherical profiles show larger median values, which can differ by as much as 0.4 dex. More importantly, the radial dependence of the median is also different. The dashed lines on each panel show linear fits to the profiles. In general, flatter profiles are obtained along the minor axis compared to their spherical counterpart. The red solid lines show [Fe/H] profiles along the major axis. Clearly, in all cases, the spherical profiles are strongly dominated by the [Fe/H] profiles along the major axis, at least out to kpc. This indicates a flattened metallicity distribution in these stellar haloes. The difference between the major and minor axis profiles is mostly, although not entirely (see below), due to the contribution of in-situ heated disc star particles. These are particles formed in the disc that have been scattered into low orbits and thus classified as halo stars (e.g., Zolotov et al., 2009; Purcell et al., 2010).
The bottom panels of Fig. 2 show the results obtained for 0.8 (green lines), 0.7 (orange lines) and 0.65 (purple lines). This contrasts our results for increasingly conservative classifications of stellar halo particles. Strong differences between minor and spherical [Fe/H] profiles are found even for our most restrictive selection criteria (. In some cases, such as galaxy Au 2, the difference between the median [Fe/H] profiles within 50 kpc becomes slightly smaller but is still significant, dex. Large differences between the steepness of the profiles are found regardless of . We also show, with blue dash-dot lines, the minor axis [Fe/H] profiles obtained when no selection is made. In this case, we omit the spherical profiles as they purely reflect the metallicity distribution of the discs within the inner kpc. Interestingly, the minor axis [Fe/H] profiles are indistinguishable, regardless of the selection criteria. This indicates that the mass fraction of in-situ heated disc stars along the minor axis is negligible at distances larger than 15 kpc (see also Pillepich et al., 2015).
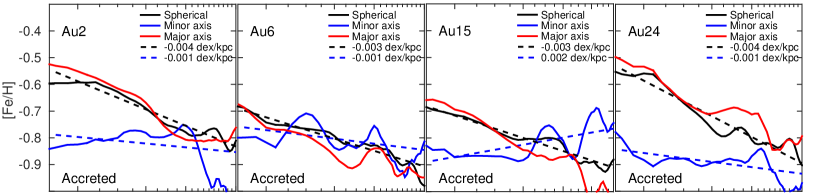
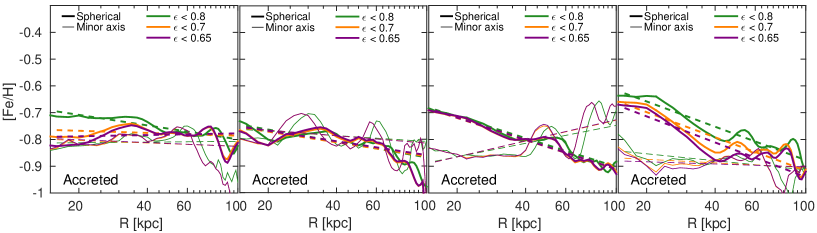
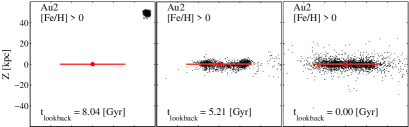
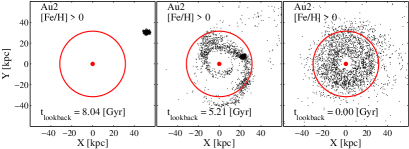
Figure 3 shows [Fe/H] profiles taking into account only accreted particles. The top panels show the results obtained when no constraint in is applied. Three out of the four galaxies show large differences between the spherical and minor axis [Fe/H] profiles, both in their median values and radial behaviour. Differences between these two profiles can be as large 0.3 dex (Au 24). This indicates that the accreted component of these simulated galaxies presents also a flattened distribution. We find that as massive metal rich satellites are accreted, the host galactic disc responds by tilting its orientation (e.g., Yurin & Springel, 2015). As a result, in many cases the cores of massive satellites are disrupted on a plane that is well-aligned with the host disc angular momentum (see e.g., Abadi et al., 2003). Figure 4 shows one example of such accretion events. Prior to infall, at Gyr, this satellite reaches a total peak mass of . By Gyr, the angle between the angular momentum vector of its inner bound core and that of the disc is .
Note that, based on our kinematic selection criteria, not all the accreted particles would belong to the stellar halo. For , the accreted stellar mass fraction that belongs to the disc component varies between 5% (in Au 15) and 35% (in Au 2). The bottom panels of Fig. 3 show accreted [Fe/H] profiles using the three different circularities previously defined. The differences between the spherical and minor axis [Fe/H] profiles disappear for halo Au 2 (left-most panel) in the bottom panels, indicating a strong orbital circularization of the inner metal rich cores of massive accreted satellites (see Fig. 4). Interestingly, for haloes Au 15 and Au 24 the difference between the spherical and minor axis [Fe/H] profiles remains almost the same for all values of . These examples show that the accreted component also contributes to the differences seen (both in median values and radial gradient) between the spherical and minor axis [Fe/H] profiles.
5 Summary and Conclusions
While previous studies based on hydrodynamical simulations indicate that negative metallicity gradients are a ubiquitous feature of simulated MW-like stellar haloes (e.g., Font et al., 2011; Tissera et al., 2013, 2014), half of the current observed sample of eight nearby disc galaxies suggests flat metallicity profiles (e.g., Monachesi et al., 2016). Motivated by this apparent discrepancy, we use four high resolution cosmological hydrodynamical simulations of MW-like galaxies to characterise the metallicity profiles of their stellar haloes. Our goal is to study whether this discrepancy could be due to the different ways in which simulations and data are compared. In contrast to numerical studies where spherically averaged [Fe/H] profiles are shown, observations are obtained along a particular direction, ideally perpendicular to the disc plane so as to minimise disc contamination.
Following previous simulation studies, we define stellar haloes purely based on kinematic criteria. We find that spherical [Fe/H] profiles show large negative gradients, in agreement with previous work. However, significant differences are obtained when the profiles are computed in projection along the minor axis of the galactic disc. Not only are the median [Fe/H] values larger in the spherical profiles (up to dex), at least within the inner 50 kpc, but also the gradients are steeper in general than along the minor axis. Color profiles obtained from mock RGB stars generated as in Monachesi et al. (2013) (not shown here) yield equivalent results. We find that the spherical profiles are dominated by the halo [Fe/H] distribution along the disc’s major axis. We also show that the minor axis [Fe/H] profiles are indistinguishable for the different circularity criteria we have adopted, even when no kinematic selection is imposed. This indicates that a straightforward comparison between observations and models of stellar haloes is possible along the minor axis. Furthermore, of the four examples we have analysed, one has a flat [Fe/H] profile, one has a rather steep trend and the other are intermediate. This diversity is reminiscent of the variety of profiles seen in the observational data.
Interestingly, in most cases, very similar results are obtained when only the accreted component of the stellar halo is considered, indicating that our results are not entirely driven by in-situ heated disc star particles. Note that even in dark matter only simulations, where baryonic effects such as a thin disc potential are not taken into account, stellar haloes generally present a flattened density distribution as a result of an anisotropic distribution of satellite orbits (Cooper et al., 2010). Thus, those models are also expected to show differences between spherical and line-of-sight [Fe/H] profiles.
The existence of stellar halo [Fe/H] gradients (or the lack of them) in massive disc galaxies depends strongly on how the profiles are constructed. Such profiles depend on the adopted definition of the stellar halo, which often differs among observations and theoretical works. Since stellar halo [Fe/H] profiles are an important diagnostic of galaxy formation history, a careful and faithful comparison between observations and models is crucial in order to interpret observations correctly and constrain the models. This will be presented in a follow-up work.
Acknowledgments
AM wishes to thank Eric Bell for stimulating discussions. We are grateful to Simon White for insightful comments and to Adrian Jenkins and David Campbell for the selection of the sample and making the initial conditions. We wish to thank the anonymous referee for their useful comments and suggestions. The ICs were created on the Durham DiRAC-2 Data Centric facility supported by grants: ST/K00042X/1, ST/H008519/1, ST/K00087X/1 and ST/K003267/1. RG and VS acknowledge support through the DFG Research Centre SFB-881 ‘The Milky Way System’ through project A1. VS and RP acknowledge support by the European Research Council under ERC-StG grant EXAGAL-308037 and by the Klaus Tschira Foundation.
References
- Abadi et al. (2003) Abadi M. G., Navarro J. F., Steinmetz M., Eke V. R., 2003, ApJ, 597, 21
- Abadi et al. (2006) Abadi M. G., Navarro J. F., Steinmetz M., 2006, MNRAS, 365, 747
- Bailin et al. (2014) Bailin J., Bell E. F., Valluri M., Stinson G. S., Debattista V. P., Couchman H. M. P., Wadsley J., 2014, ApJ, 783, 95
- Bullock & Johnston (2005) Bullock J. S., Johnston K. V., 2005, ApJ, 635, 931
- Cooper et al. (2010) Cooper A. P., et al., 2010, MNRAS, 406, 744
- Cooper et al. (2015) Cooper A. P., Parry O. H., Lowing B., Cole S., Frenk C., 2015, MNRAS, 454, 3185
- De Lucia & Helmi (2008) De Lucia G., Helmi A., 2008, MNRAS, 391, 14
- Font et al. (2006) Font A. S., Johnston K. V., Bullock J. S., Robertson B. E., 2006, ApJ, 646, 886
- Font et al. (2011) Font A. S., McCarthy I. G., Crain R. A., Theuns T., Schaye J., Wiersma R. P. C., Dalla Vecchia C., 2011, MNRAS, 416, 2802
- Gilbert et al. (2014) Gilbert K. M., et al., 2014, ApJ, 796, 76
- Gómez et al. (2012) Gómez F. A., Coleman-Smith C. E., O’Shea B. W., Tumlinson J., Wolpert R. L., 2012, ApJ, 760, 112
- Gómez et al. (2016) Gómez F. A., White S. D. M., Marinacci F., Slater C. T., Grand R. J. J., Springel V., Pakmor R., 2016, MNRAS, 456, 2779
- Grand et al. (2016) Grand R. J. J., Springel V., Gómez F. A., Marinacci F., Pakmor R., Campbell D. J. R., Jenkins A., 2016, MNRAS,
- Ibata et al. (2014) Ibata R. A., et al., 2014, ApJ, 780, 128
- McCarthy et al. (2012) McCarthy I. G., Font A. S., Crain R. A., Deason A. J., Schaye J., Theuns T., 2012, MNRAS, 420, 2245
- Monachesi et al. (2013) Monachesi A., et al., 2013, ApJ, 766, 106
- Monachesi et al. (2016) Monachesi A., Bell E. F., Radburn-Smith D. J., Bailin J., de Jong R. S., Holwerda B., Streich D., Silverstein G., 2016, MNRAS, 457, 1419
- Peacock et al. (2015) Peacock M. B., Strader J., Romanowsky A. J., Brodie J. P., 2015, ApJ, 800, 13
- Pillepich et al. (2015) Pillepich A., Madau P., Mayer L., 2015, ApJ, 799, 184
- Planck Collaboration et al. (2014) Planck Collaboration et al., 2014, A&A, 571, A16
- Purcell et al. (2010) Purcell C. W., Bullock J. S., Kazantzidis S., 2010, MNRAS, 404, 1711
- Sesar et al. (2011) Sesar B., Jurić M., Ivezić Ž., 2011, ApJ, 731, 4
- Springel (2010) Springel V., 2010, MNRAS, 401, 791
- Tissera et al. (2013) Tissera P. B., Scannapieco C., Beers T. C., Carollo D., 2013, MNRAS, 432, 3391
- Tissera et al. (2014) Tissera P. B., Beers T. C., Carollo D., Scannapieco C., 2014, MNRAS, 439, 3128
- Yurin & Springel (2015) Yurin D., Springel V., 2015, MNRAS, 452, 2367
- Zolotov et al. (2009) Zolotov A., Willman B., Brooks A. M., et al. 2009, ApJ, 702, 1058