Pressure-dependent optical investigations of -(BEDT-TTF)2I3:
tuning charge order and narrow gap towards a Dirac semimetal
Abstract
Infrared optical investigations of -(BEDT-TTF)2I3 have been performed in the spectral range from 80 to 8000 cm-1 down to temperatures as low as 10 K by applying hydrostatic pressure. In the metallic state, K, we observe a 50% increase in the Drude contribution as well as the mid-infrared band due to the growing intermolecular orbital overlap with pressure up to 11 kbar. In the ordered state, , we extract how the electronic charge per molecule varies with temperature and pressure: Transport and optical studies demonstrate that charge order and metal-insulator transition coincide and consistently yield a linear decrease of the transition temperature by K/kbar. The charge disproportionation diminishes by /kbar and the optical gap between the bands decreases with pressure by -47 cm-1/kbar. In our high-pressure and low-temperature experiments, we do observe contributions from the massive charge carriers as well as from massless Dirac electrons to the low-frequency optical conductivity, however, without being able to disentangle them unambiguously.
pacs:
71.30.+h, 74.70.Kn, 78.30.Jw, 72.90.+y, 78.67.WjI Introduction
The two-dimensional organic conductor -(BEDT-TTF)2I3 had been subject to intense studies for quite some timeBender et al. (1984a, b); Dressel et al. (1994) before the metal-to-insulator transition at K was recognized as the entrance of a charge-ordered state.Kino and Fukuyama (1995, 1996); Seo et al. (2004); Takano et al. (2001); Wojciechowski et al. (2003); Dressel and Drichko (2004) Recently, doubt has been casted whether intersite electron-electron repulsion actually is the driving force for the observed charge disproportionation since it became clear that the anions play a major role and might trigger the rearrangement of charge on the donors.Alemany et al. (2012) The application of pressure gradually shifts the metal-insulator transition and the system remains metallic down to lowest temperatures.Kartsovnik et al. (1985); Schwenk et al. (1985); Tajima et al. (2000) The nature of this state as well as the detailed mechanism driving the transitions, however, are far from being fully understood.
Vibrational spectroscopy is probably the most suitable methods to determine the charge per molecule quantitatively and with high accuracy;Drichko et al. (2009); Girlando (2011); Yakushi (2012) our present pressure-dependent infrared experiments enable us to trace the charge disproportionation of -(BEDT-TTF)2I3 down to low temperatures as the transition is suppressed. On the one hand pressure enhances the coupling between the organic BEDT-TTF molecules and the I anion layer via the hydrogen bonds; on the other hand it also modifies the orbital overlap making electronic correlations less effective. Thus we extract information on the bandwidth from the spectral weight redistribution observed in the electronic part of the optical spectra as a function of pressure and temperature.
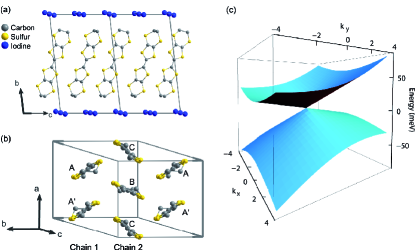
At temperatures below the metal-insulator transition, transport and optical investigations Dressel et al. (1994); Clauss et al. (2010); Ivek et al. (2011) reveal the development of an energy gap that is also found in the band structure calculated by density functional theory,Kino and Miyazaki (2006); Alemany et al. (2012); Peterseim and Dressel (2016) as illustrated in Fig. 14 of the Appendix A. It is not clear, however, what really happens when uniaxial or hydrostatic pressure is applied. From magnetotransport measurementsTajima et al. (2006, 2012a) it was concluded that at high pressure -(BEDT-TTF)2I3 is best characterize as a semiconductor with an extremely narrow energy gap of less than 1 meV. Band structure calculations indicate that the bands actually touch each other at the Fermi energy,Kino and Miyazaki (2006); Alemany et al. (2012) supporting previous suggestions of Suzumura and collaborator.Kondo et al. (2005); Katayama et al. (2006); Kobayashi et al. (2007) They predicted a zero-gap state under high pressure, where – in contrast to graphene – the Dirac points do not occur at high-symmetry points and can be tuned by pressure. Although the Dirac cone is anisotropic and tilted,Tajima et al. (2012a); Kajita et al. (2014) as illustrated in Fig. 1(c), the band dispersion might allow the observation of massless fermions. This puts -(BEDT-TTF)2I3 in a series of several other crystalline bulk materials with similar electronic properties often called three-dimensional Dirac semimetals that have attracted enormous attention in recent years.Wehling et al. (2014)
II Characterization
The structure of -(BEDT-TTF)2I3 shown in Fig. 1 consists of planes of BEDT-TTF molecules alternating with layers of I ions. Within the plane the BEDT-TTF molecules are arranged in two chains with a heringbone pattern. Chain 1 consists of molecules A and A′ which are identical at high temperatures but loose their inversion symmetry at low temperatures.Kakiuchi et al. (2007); Alemany et al. (2012) The other two molecules in the unit cell, molecules B and C, constitute chain 2. It is remarkable that even at high , the charges on the four entities are not identical, but highest for molecule B and lowest charge density on molecule C.Kakiuchi et al. (2007); Ivek et al. (2011) Alemany et al. realized that the origin of this high-temperature charge disproportionation lies in the arrangement of the tri-iodine molecules relative to the BEDT-TTF molecules.Alemany et al. (2012)
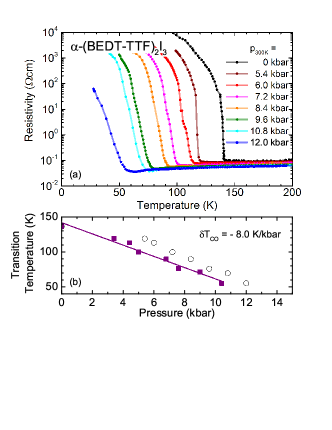
Under ambient conditions -(BEDT-TTF)2I3 can be considered as an electronically quasi-two dimensional system with an in-plane conductivity ratio of 2 and an out-of-plane anisotropy of more than 1000. At 135 K it undergoes a metal to insulator transition,Bender et al. (1984b); Dressel et al. (1994) as seen in Fig. 2(a). The appearance of a second Pake doublet in 13C-NMRTakano et al. (2001), the splitting of charge sensitive modes in Raman-Wojciechowski et al. (2003); Yakushi (2012) and IR-spectroscopy,Moldenhauer et al. (1993); Dressel and Drichko (2004); Ivek et al. (2011) and careful x-ray diffraction measurementsKakiuchi et al. (2007) reveal a significant enhancement in the charge disproportionation. Strong optical nonlinearity and second harmonic generation evidence that the inversion symmetry between the molecules A and A′ is broken;Yamamoto et al. (2008) the symmetry class of the crystal changes from P to P1 at low temperatures. Now, all four molecules are crystallographically independent and carry a different amount of charge. Horizontal stripes are formed with molecule B still being charge-rich and molecule C charge-poor, but either molecule A or A′ being charge rich/poor. This ambiguity in the charge order leads to a twinned state and the formation of domains.Kakiuchi et al. (2007); Yamamoto et al. (2010); Ivek et al. (2010); Tomić and Dressel (2015)
Applying pressure on -(BEDT-TTF)2I3 gradually suppresses the metal-insulator transition;Kartsovnik et al. (1985); Schwenk et al. (1985); Tajima et al. (2000) a magnetic field, however, recovers an insulating state.Kajita et al. (1992); Ojiro et al. (1993) In Fig. 2(a) the temperature dependent dc resistivity is plotted for different values of applied pressure.rem (a) Above the transition, the conductivity exhibits a very weak metallic temperature dependence. Extrapolating our data with K/kbar [Fig. 2(b)] yields the complete absence of gap at kbar:rem (b) the system becomes a zero-gap semiconductor. This Dirac-like semimetal has been suggested theoretically,Katayama et al. (2006) and the linear dispersion explains the very high mobility and low charge-carrier density measured at high pressures.Tajima et al. (2007) Experimentally the existence of massless Dirac fermions has been concluded from various magneto-transport measurements,Kajita et al. (2014) from the NMR relaxation rate,Takano et al. (2010); Hirata et al. (2011) specific heat dataKonoike et al. (2012) and the temperature dependence of the Nernst effect under pressure.Konoike et al. (2013) Recently evidence was presented that the high-mobility massless Dirac carriers coexist with low-mobility massive holes.Monteverde et al. (2013)
Although the infrared optical properties of -(BEDT-TTF)2I3 have been measured repeatedly,Koch et al. (1985); Sugano et al. (1985); Meneghetti et al. (1986); Yakushi et al. (1987); Železny et al. (1990); Dressel et al. (1994); Clauss et al. (2010); Ivek et al. (2010, 2011) to our knowledge no pressure and temperature-dependent optical studies have been reported by now that allow to follow the suppression of charge order and explore the properties of the occurring zero-gap state. Using our recently developed piston pressure cell for infrared measurements Beyer and Dressel (2015) we thus have performed comprehensive optical experiments on -(BEDT-TTF)2I3 that reveal the influence of pressure on the charge disproportionation and the suppression of the optical gap towards the zero-gap state.
III Vibrational Spectroscopy
III.1 Ambient Pressure Results
The BEDT-TTF molecule has three charge sensitive normal modes known as , and in the commonly used D2h symmetry (corresponding to , and in the correct D2 symmetry of the ions in the solid).Girlando (2011) For our infrared experiments we focus on the antisymmetric stretching vibration of the outer C=C double bonds; its resonance frequency scales with the charge according toYamamoto et al. (2005); Girlando (2011)
| (1) |
In order to observe this vibration, the electric field has to be polarized parallel to the BEDT-TTF molecule, i.e. in case of -(BEDT-TTF)2I3 perpendicular to the -conducting planes. With typical crystals as thin as 60 m, this requires either the use of a microscope or measurements on powdered samples.
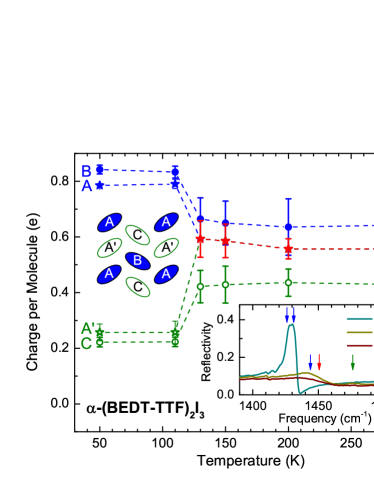
We have performed ambient-pressure measurements on a single crystal of -(BEDT-TTF)2I3 utilizing a Bruker Vertex 80v Fourier-transform spectrometer in combinatation with a Hyperion microscope. Low temperatures were achieved via a helium-flow cryostat that fits the Cassegrain objective. The measured reflectivity in the frequency range of the -vibration is shown in the inset of Fig. 3. At elevated temperatures, it consists of two broad bands. The very weak band at higher frequencies is due to the response of the charge poor molecule C, while the information about the charge on molecules A(A′) and B is contained in the stronger band just below 1450 cm-1. Sensitive fits with phenomenological Lorentz and Fano modelsIvek et al. (2011); Sedlmeier et al. (2012) barely allows for a separation of the two contributions, leaving a significant uncertainty as indicated by the error bars in Fig. 3. Below the transition temperature one very strong band around 1425 cm-1 and a weaker one just above 1500 cm-1 appear; as demonstrated in the inset of Fig. 3, each band contains two contributions. Based on Eq. (1) the lower-frequency modes correspond to and charge on the BEDT-TTF molecule, and the upper-frequency ones to and . The measured and fitted resonance frequencies coincide well with optical results previously reported,Yue et al. (2010); Ivek et al. (2011); Yakushi (2012) but the estimates based on x-ray diffractionKakiuchi et al. (2007) consistently differ by approximately 10%.
III.2 High-Pressure Results
For experiments under hydrostatic pressure we first studied a powdered sample as described in Ref. Beyer and Dressel, 2015 in full detail. The pressed pellet is put right behind the wedged diamond window of a copper-beryllium cell filled with Daphne 7373 silicone oil as pressure-transmitting medium. The cell is attached to a cold-finger helium cryostat that enables us to reach temperatures as low as 6 K. In order to adjust for the pressure loss on cooling, we have performed in-situ calibration measurements by ruby flourescence and Manganin wire. Except otherwise stated, only the actual pressure at any given temperatures is noted throughout the paper. The infrared reflectivity was measured by employing a Bruker IFS 66v/S Fourier transform spectrometer.
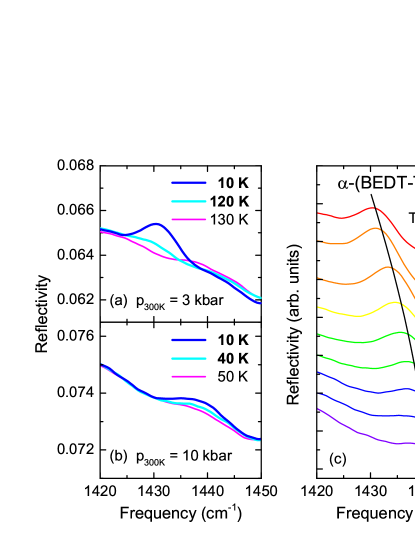
In Fig. 4(a) we plot data taken at kbar in the frequency range around the strong -band. Due to the applied pressure, the transition temperature lies between 130 K and 120 K. The band around 1427 cm-1 can be observed only in the charge-ordered state. Right below it is still weak but grows stronger with lower . While the strength of the band changes with , the resonance frequency in the insulating state is basically temperature independent. At the highest pressure of kbar, is suppressed to K, and the resonance frequency of the vibration is shifted to higher frequencies; as shown in Fig. 4(b) the reflectivity band becomes much weaker in intensity. To follow the pressure dependence more systematically, Fig. 4(c) displays the reflectivity spectra of -(BEDT-TTF)2I3 for various pressure values recorded at K. The resonance frequency shifts continuously to higher frequencies with increasing pressure, and it becomes significantly weaker. The broadening might to some part be due to inhomogeneities in the pressure distribution that is not uncommon in high-pressure powder experiments.
For a quantitative analysis we have to take into account that the recorded signal is reflected off the diamond/sample-interface and that in a pressed pellet the in-plane conductivity contributes considerably.Beyer and Dressel (2015) Without using a Kramers-Kronig analysis, we directly fit the observed reflectivity by Fresnel’s equations and modeling the vibrational bands with Fano resonances.Dressel and Grüner (2002); Sedlmeier et al. (2012) Since the system is over-parametrized, we always made sure that the parameter variation is kept to a minimum when gradually changing and . The findings are complemented by the ambient-pressure -axis reflectivity measurement analyzed above in Sec. III.1, where the results are displayed in Fig. 3. In the metallic state the charge disproportionation is small: the difference between the charge-rich molecule B and the charge-poor molecule C only amounts to roughly to This rises abruptly below : in the CO state the charge-rich molecules B and A differ by approximately compared to the charge-poor molecules A′ and C.
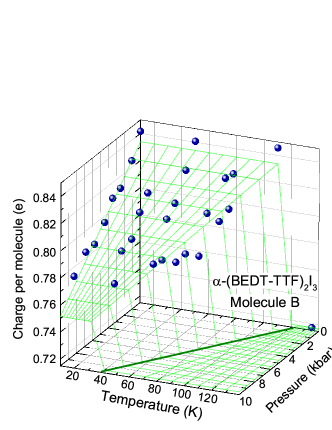
In our pressure-dependent measurements we can only observe the response of the two charge-rich molecules A and B. The higher-frequency analogues, i.e. the charge-poor sites are much weaker (cf. inset of Fig. 3) and hard to identify reliably in the pressurized powder sample. Fig. 5 summarizes the and dependence of the charge on the molecules B, which contains the maximum amount of charge below . Molecule A exhibits a similar behavior. While there is a strong decrease with , we find that the charge disproportionation does not vary appreciably with temperature as .
For a phase transition solely driven by electronic intersite correlations, the charge disproportionation is a measure of the order parameter and one would expect a gradual increase as . In our experiments we find a rather abrupt change in charge imbalance at the charge-order phase transition at any pressure: more reminiscent of a first order transition than the second-order behavior observed in the quasi-one-dimensional Fabre salts (TMTTF).Köhler et al. (2011); Dressel et al. (2012) It is tempting to relate this behavior to the structural modifications associated with the coupling to the anions. This was also observed at the charge-order transition in TMTTF salts,Foury-Leylekian et al. (2010); Yasin et al. (2012); Rose et al. (2013) but probably less dominant and weaker.
Our comprehensive experiments allow us to determine at each individual pressure the transition temperature at which charge order starts to become pronounced. As shown in Fig. 6(a), the phase boundary decreases with approximately -9 K/kbar; hence we extrapolate that at 15 kbar the charge-order transition should vanish completely. These findings are in good agreement with our dc measurements plotted in Fig. 2 and previous results by Tajima et al.;Tajima et al. (2000, 2007) albeit it should be noted that the later experiments monitor the metal-insulator transition, while here we actually probe the charge disproportionation. We conclude a strict coincidence of metal-insulator transition and increase of charge order.
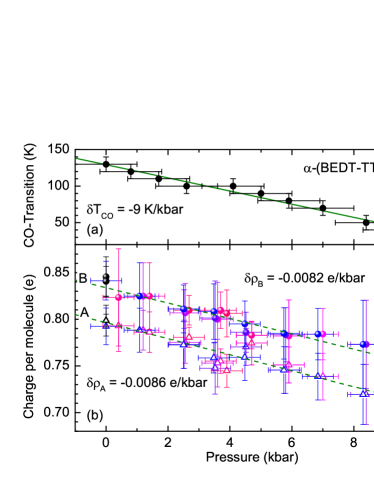
In a next step we can analyze the amount of charge disproportionation reached at low for different pressure applied. Fig. 6(b) displays the variation of charge on the two molecules A and B with increasing pressure.rem (c) The results of the ambient-pressure measurements are included by the black symbols and coincide well with the results of the pressure measurement at low and low . For both molecules the charge decreases linearly by a rate of /kbar and /kbar. Comparing the results presented in both panels, we conclude that there is a linear relation between charge disproportionation and transition temperature . Above kbar the molecules will carry approximately the same amount of charge at low temperatures as they do for ambient conditions in the metallic state above .
The question remains, why the charge disproportionation is leveled off as hydrostatic pressure is applied. In a purely electronic pictureKino and Fukuyama (1995, 1996); Seo et al. (2004) intersite Coulomb repulsion drives the transition. With pressure the intermolecular distances are reduced leading to a slight changes of , but most important to a pronounced enhancement of the orbital overlap,Kondo et al. (2005); Kino and Miyazaki (2006) i.e. of the bandwidth as discussed in Sec. IV.1. In Fig. 15 of the Appendix B we plot the amount of charge as a function of effective Coulomb repulsion and find that and seem to saturate for large Coulomb interaction . On the other hand, the interaction of the BEDT-TTF molecules via the ethylene endgroups is supposed to increase with . Alemany et al. suggested, that the coupling to the I anions is crucial for the charge disproportionation.Alemany et al. (2012) At this point it is not clear how the pressure-dependent charge redistribution can be reconciled with this idea. Unfortunately, our temperature and pressure-dependent studies of the ethylene vibrations do not offer any hint in this regard.rem (d)
While we did confine ourselves to the mode here, in principle a similar analysis could be performed with other charge-sensitive molecular vibrations. However, we cannot reach a comparable sensitivity and accuracy as discussed in Appendix C in more detail. Instead we compare our findings to pressure and temperature dependent Raman measurements of the (ag) and (ag) modes. Due to a lower resolution, Wojciechowski et al. could not estimate the charge on each molecule separately but only detect the lowest and the highest charge and thus estimated the difference between charge rich and charge poor sites:Wojciechowski et al. (2003) it decreases from at ambient pressure to at kbar. This corresponds to a rate of approximately /kbar, in excellent agreement with our measurements.
IV Electronic Properties
In order to explore the electrondynamic properties of -(BEDT-TTF)2I3 when developing charge-order and approaching the zero-gap, the optical reflectivity off the highly conducting -plane of a single crystal has been measured from room temperature down to K applying pressure up to kbar. Due to the rather large opening of the diamond window of 2 mm diameter, we can record data well below 100 cm-1.Beyer and Dressel (2015) Examples of the optical reflectance for different polarizations, pressure values and temperatures are displayed in Fig. 8. The strong multiphonon absorptions in diamond between 1700 and 2700 cm-1 prevents any reasonable signal to be recorded in this range of frequency. Since the crystal is in optical contact with the window, the reflectivity is probed at the diamond-sample interface; using the known properties of diamond, the optical reflectivity is calculated following the procedure described by Pashkin et al. Pashkin et al. (2006); rem (e)
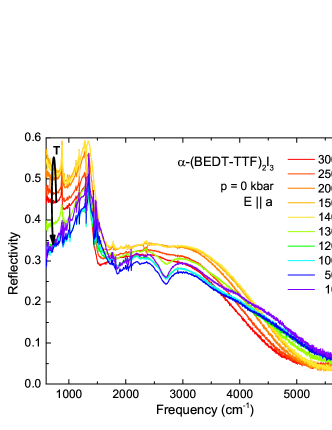
At ambient pressure the low-frequency reflectivity continuously rises with decreasing until the metal-insulator transition is reached at K; the metallic frequency dependence quickly transforms into an insulating behavior that remains unchanged below approximately 120 K. As demonstrated in Fig. 7 the well-pronounced plasma edge then transforms into a gradual decrease of reflectivity with frequency. Detailed discussions of the ambient-pressure optical properties have been reported previously by several groups.Koch et al. (1985); Sugano et al. (1985); Meneghetti et al. (1986); Yakushi et al. (1987); Železny et al. (1990); Dressel et al. (1994); Clauss et al. (2010); Ivek et al. (2010, 2011)
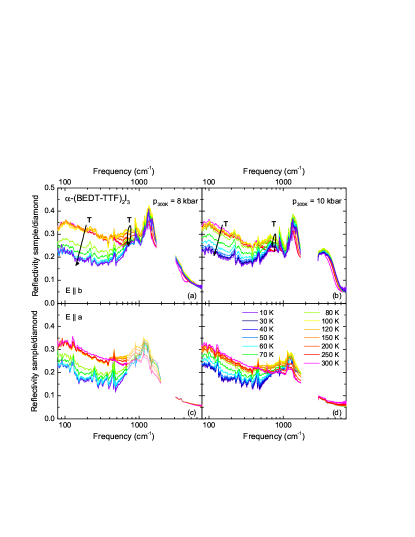
In Fig. 8 the optical reflectivity of -(BEDT-TTF)2I3 is displayed in the far and mid infrared (80 to 8000 cm-1) for both polarizations parallel and perpendicular to the -axis; the plots correspond to the raw data taken off the diamond-to-sample interface at different temperatures as indicated. When a pressure of 8 kbar is applied, in the spectral range above 500 cm-1 the dependence is similar to the ambient pressure response, while the far-infrared reflectivity stays independent down to the metal-insulator transition. When charge order sets in at K the reflectivity decreases abruptly and significantly before it approaches a constant value below 60 K, as seen from Fig. 8(a) and (c).
As the applied pressure increases to 10 kbar and more, the changes with become more gradual and less extensive; the transition shifts to around 50 K and becomes broad. For the polarization the overall is slightly lower, but the temperature behavior is similar. In Fig. 8(b) we can see that there is still a crossing point around 600 cm-1 indicating that spectral weight shifts to the mid-infrared as the temperature is reduced. For the mid-infrared band around 1500 cm-1 is almost absent at elevated temperatures; it grows only when drops below 200 K. Even more interesting is the reduction in the far-infrared reflectivity for K observed in both polarizations. This implies a drastic depletion of charge carriers in the Drude term.
When we compare the low- reflectance at different pressure values, we notice an increase of the far-infrared reflectivity as pressure rises to 10 kbar, but then it comes to a halt. This indicates a growth in spectral weight with pressure and a rise of the low-frequency conductivity as will be discussed in more detail below.
IV.1 Metallic Regime
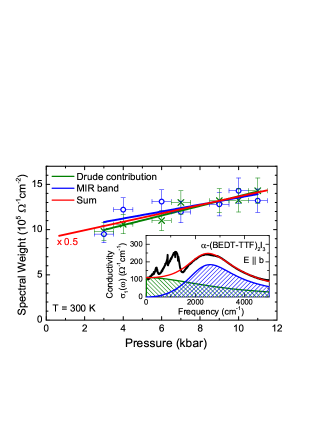
In order to study the influence of pressure on the bandwidth and carrier density in more detail, we have fitted the overall optical conductivity of -(BEDT-TTF)2I3 by a sum of Drude and Lorentz terms, disregarding all vibrational features and emv-coupled modes. Previous bandstructure calculationsEmge et al. (1986); Ishibashi et al. (2006); Kino and Miyazaki (2006); Kondo et al. (2009); Mori (2010); Alemany et al. (2012) yield a semimetallic behavior at ambient conditions: the Fermi surface intersects the valence band and conduction band leading to electron and small hole pockets. Our DFT calculationsPeterseim and Dressel (2016) sketched in the Appendix A, however, evidence only one kind of carriers at K (Fig. 14). Since also the experimental results do not provide any information that allows us to discriminate two Drude contributions according to two separate bands, we restrained ourselves to the simples possible model of one Drude and one Lorentz term. Although this might be a crude and simplified approach, it allows us to disentangle the free charge-carrier contribution from localized electrons, interband transition, etc. centered in the mid-infrared spectral range.Dressel and Grüner (2002); Dressel et al. (2009) Both contributions carry about the same spectral weight , with the plasma frequency. The overall properties are similar for both polarizations, however, the gross spectral weight parallel to the chains is only half compared to .
When hydrostatic pressure is applied, the spectral weight increases in a linear fashion as shown in Fig. 9. The enhancement of the Drude component is more pronounced compared to the mid-infrared band; in total we find a rise of about 50% at 12 kbar, similar for both polarizations. In a first approach this behavior is explained by the enlargement of the bandwidth as the lattice is compressed. DFT calculations also yield an increase of of 27% at high pressure.Kino and Miyazaki (2006); Alemany et al. (2012). The dependence of the dc resistivity (Fig. 2) confirms this conclusion that -(BEDT-TTF)2I3 becomes more metallic with pressure. We have to keep in mind, however, that is proportional to the ratio of carrier density and mass; a reduction in correlations is commonly ascribed to a decrease in the effective mass. It is interesting to note, that in the case of the charge-fluctuating metal -(BEDT-TTF)2KHg(SCN)4 spectral weight moved from the mid-infrared band to the Drude part when hydrostatic pressure of up to 10 kbar is applied. This was interpreted as a reduction of the effective correlations and shift towards metallic behavior.Drichko et al. (2006)
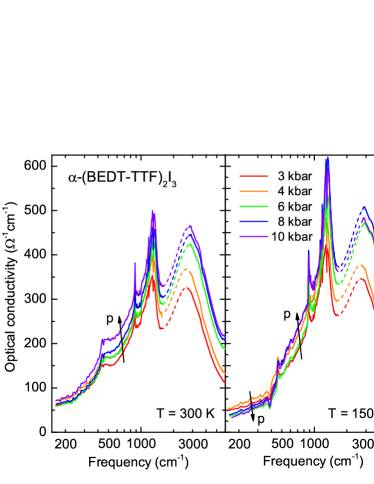
This pressure behavior also becomes obvious from the conductivity spectra at plotted in Fig. 10. Cooling down from room temperature just above the metal-insulator transition ( K), the overall conductivity of -(BEDT-TTF)2I3 increases by approximately 10 %, in accord with previous ambient-pressure measurements and dc transport.Dressel et al. (1994) While the effects on pressure is rather similar around the mid-infrared peak at 2500 cm-1, the pressure dependence becomes more subtle in the far infrared range where a crossover can be identified. This behavior is more pronounced when we cool down further into the zero-gap regime.
IV.2 Narrow-Gap Regime
The optical properties below the metal-insulator transition of -(BEDT-TTF)2I3 are governed by two contributions: first, the free-carrier absorption, which freezes out as is reduced, as demonstrated in Fig. 7; second, by excitations across the gap, which is supposed to gradually close as pressure is applied. At ambient pressure the optical gap is clearly seen in the conductivity spectra around 600 cm-1, similar for both polarizations.Clauss et al. (2010); Ivek et al. (2011) Our bandstructure calculations plotted in Fig. 14(b) show that only 21 meV separate the bands from each other; the direct gap amounts to 55 meV.Peterseim and Dressel (2016) This is in perfect agreement with the values of 30 and 60 meV, respectively, given by Alemany et al.Alemany et al. (2012) Despite several high-pressure resistivity or Hall effect investigations down to low temperatureTajima et al. (2000, 2006, 2012b) nothing is known about the evolution of the transport gap with increasing .
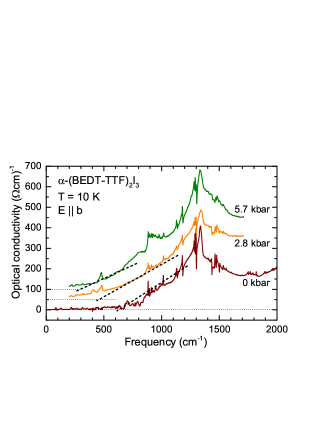
In Fig. 11 we plot of -(BEDT-TTF)2I3 at K for different amounts of hydrostatic pressure. Similar to the high- behavior, the overall conductivity increases; but now it extends down to the far-infrared spectral range. Since we can unambiguously determine the optical gap for ambient pressure by linear extrapolation of to low frequencies, a similar procedure is applied to extract the optical gap for different pressure values, as illustrated by the dashed lines in Fig. 11. A rather similar behavior is observed for the polarization . We want to mention that the determination is tainted with a considerable uncertainty due to the enormous challenge of the low-frequency and high pressure measurements, due to the ambiguity of the data analysis via Drude-Lorentz-fits and Kramers-Kronig analysis, due to the uncertainty of extrapolation etc. Also note that the optical conductivity does not actually drop to zero within the accessible frequency range, and this background seems to become more pronounced as pressure increases; it will be discussed in the preceding Sec. IV.3.
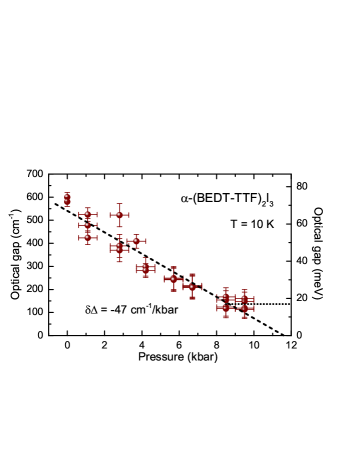
Nevertheless, Fig. 12 summarizes the pressure dependence of the energy gap extracted from our optical measurements on -(BEDT-TTF)2I3 down to low temperatures and frequencies. The data evidence a linear decrease of the optical gap with increasing pressure of approximately -47 cm-1/kbar, i.e. meV/kbar. Despite the error bars, for the highest accessible pressure values we cannot see any further change above the actual low-temperature pressure of 9 kbar. This might taken as an indication that the closing of the gap actually come to a halt with meV. At a first glance this observation seems in contradiction to the metallic behavior reported from dc resistivity measurements;Tajima et al. (2000, 2012a) however, we have to keep in mind that optical experiments only probe direct transitions (),Dressel and Grüner (2002) while temperature-dependent transport measures the smallest distance between two bands, i.e. indirect gaps. From the optical point of view -(BEDT-TTF)2I3 actually becomes a semimetal and not a real zero-gap state. We certainly have to extend our optical experiments to higher pressure and lower frequencies in order to give a final answer to this problem, because calculations of the electronic structure based on the high-pressure x-ray scattering resultsKondo et al. (2005) indicate that the two bands in of -(BEDT-TTF)2I3 actually touch at the Fermi energy.Kino and Miyazaki (2006); Alemany et al. (2012) Here calculations of the optical conductivity for low and different pressure would be helpful, as done for the ambient condictions.Peterseim and Dressel (2016)
IV.3 Dirac Cone and Zero-Gap State
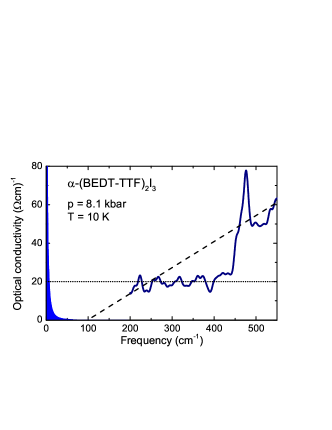
Above we saw that the low-frequency optical conductivity of -(BEDT-TTF)2I3 does not completely vanish when high pressure is applied. Even for lowest temperatures there seems to remain a constant background of approximately as demonstrated in Fig. 13. Is this an indication that the bands start to overlap and -(BEDT-TTF)2I3 becomes a semimetal? Or do the bands touch and we see fingerprints of the Dirac electrons?
In order to clarify whether this background stems from normal massive carriers or from massless Dirac electrons, let us compare the value with transport measurements. From high-pressure data of magnetoresistance and Hall coefficient , it is knownTajima et al. (2000, 2006) that at low temperatures ( K) -(BEDT-TTF)2I3 contains an equal amount of electrons and holes with a density of only and an extremely high mobility of /Vs. The conductivity estimated by is slightly above the value of approximately obtained from dc measurements.Tajima et al. (2007) This implies that a very narrow Drude contribution is present. Using , with the free electron mass, the scattering rate can be estimated to , which corresponds to 2 cm-1; the respective Drude term is sketched in Fig. 13. In other words, if the low- dc conductivity was caused by massive carriers, the Drude roll-off would fall far below the frequency range accessible to us in the present experiments. Previous microwave experiments between 10 and 600 GHz (0.3 - 18 cm-1) did find a rather strong frequency dependence,Dressel et al. (1994) but have been restricted to ambient pressure; probing the low-temperatures microwave response as a function of frequency at high-pressure is not possible at present time.
Some electronic-structure calculations indicate semimetallic bands of -(BEDT-TTF)2I3 under ambient conditions;Kino and Miyazaki (2006); Mori (2010); Alemany et al. (2012) at high pressure this might also extend to low temperatures. In a first approximation the electronic properties of a semimetal can be treated by two independent conduction channels – one for electrons and one for holes – leading to an optical response that is described by the sum of two Drude terms.Dressel and Grüner (2002) If the corresponding relaxation rates differ strongly, both contributions can be discriminated;Wu et al. (2010); Barišić et al. (2010); Homes et al. (2015) in general, however, comparable scattering processes and interband scattering prevent an unambiguous identification and clear-cut separation. In the present case of -(BEDT-TTF)2I3 we do not observe a Drude-like response at low temperatures and cannot conclude on the iussue of one or two-band electronic transport.
Do we see the optical response of the Dirac cone? Based on their semi-empirical investigations of the electronic structure, Katayama, Kobayashi, and SuzumuraKatayama et al. (2006); Kobayashi et al. (2007) suggested that a two-dimensional anisotropic Dirac cone dispersion occurs in -(BEDT-TTF)2I3 at high pressure, in analogy to the linear dispersion of the energy bands of graphene, although the situation is distinct as the states are not protected by topology, the Dirac cone is tilted and the zero-gap states can be tuned by pressure.Tajima et al. (2012a); Kajita et al. (2014) Very recently, Suzumura et al. theoretically examined the dynamical conductivity of the massless electrons in the tilted Dirac cone,Suzumura et al. (2014, 2015) i.e. with different velocities for the first and second band. They found that the behavior deviates from the case of graphene as intraband excitations are enhanced by the tilting compared to that of the interband excitations.
Albeit -(BEDT-TTF)2I3 was the first bulk material were Dirac electrons have been suggested, electronically it can be considered strictly two-dimensional and thus more similar to graphene (cf. Appendix D). Hence the interband optical conductivity per layer should be an universal constantGusynin et al. (2006)
| (2) |
where is the conductance quantum, Js Planck’s constant, and is the number of non-degenerate cones ( for graphene while in the case of -(BEDT-TTF)2I3). The skin depth, , is above 2 m for any in our sample, hence the specific bulk conductivity due to the Dirac particles should be below . This is, however, not the case for any frequency. In other words, the contribution of the Dirac electrons is masked by other channels of conduction.
Our observation is in full accord with the findings of Monteverde et al. who concluded from magnetotransport measurements under hydrostatic pressure that in -(BEDT-TTF)2I3 low-mobility massive holes coexist with the highly-mobile massless Dirac carriers. While transport measurements sum over all carriers, optical measurements are energy selective and thus could provide additional important information in this regard. Unfortunately, the optical conductivity presented in Fig. 13 does not reach high-enough pressure and low-enough frequencies to make definite statements on the true zero-gap state in -(BEDT-TTF)2I3. Experiments in the THz range and at higher pressure are required in order to disentangle the various contributions to the optical conductivity – massless and massive carriers as well as interband and intraband excitations – and determine their dynamical properties.
V Conclusion
We have measured the optical properties of the organic conductor -(BEDT-TTF)2I3 under hydrostatic pressure down to low temperatures and low frequencies. At elevated temperatures the metallic response observed by transport and optics improves with pressure due to the enlarged bandwidth and enhanced carrier density. As pressure rises, the metal-insulator transition is suppressed by -8 K/kbar, this coincides with the increasing charge disporportionation at for which the shift was independently estimate to -9 K/kbar by our infrared measurements. In our vibrational spectra we see how the charge imbalance decreases linearly with pressure by /kar; above approximately 14 kbar the charge per molecules reaches the values known from above the charge ordering transition.
Also at low temperatures the metallic properties become enhanced by pressure and the gap between conduction and valence band is strongly suppressed. The optical gap decreases by -6 meV/kbar up to 9 kbar. Since we do not observe a Drude-like response for the maximum pressure reached, we characterize -(BEDT-TTF)2I3 as a semiconductor with an extremely narrow gap; we cannot see the bands touching. For the highest pressure we find that a constant low-frequency conductivity of remains at small temperatures. Although this is reminiscent of linear dispersion in two-dimensional Dirac systems, the absolute value seems to be too high. We discuss how massive Drude and massless Dirac charge carriers contribute to the high-pressure optical response.
Acknowledgements.
We thank N. Barisić, N. Drichko, E. Rose, D. Wu and S. Zapf for helpful discussions as well as G. Untereiner for technical support. Funding by the Deutsche Forschungsgemeinschaft (DFG) and Deutscher Akademischer Austauschdienst (DAAD) is acknowledged.Appendix A Electronic Band Structure
The band structure of -(BEDT-TTF)2I3 was calculated by ab-initio density functional theory (DFT) as standardly implemented in the software package Quantum Espresso (Version 4.3.2 and 5.1).Giannozzi et al. (2009) We employed a norm-conserving PBE general gradient approximation (GGA) functional Perdew et al. (1996) for all atom types, up to a certain level taking into account the exchange correlation as well as the spatial variation of the charge density. The cut-off energy for the plane waves and electronic density was set to 30 Ry and 120 Ry, respectively. The self-consistent energy calculations were performed on a regularly spaced grid of grid.Monkhorst and Pack (1976) Since -(BEDT-TTF)2I3 is metallic at room temperature, a smearing factor of 0.05 Ry was selected. The crystal structures determined from x-ray scattering experiments at room temperature and low temperature were taken from Refs. Kakiuchi et al., 2007 and Emge et al., 1986. They are used without any optimization of the unit cell parameters or the atomic positions.
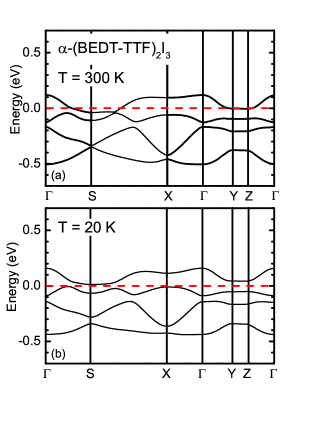
In Fig. 14 we plot the electronic band structure of -(BEDT-TTF)2I3 along the path in units of the triclinic reciprocal lattice vectors. Since the unit cell contains four molecules, four bands are found at the Fermi energy (depicted by the red dashed line). The lower two are well separated from the Fermi level whereas the upper band intersects . From that, we conclude that -(BEDT-TTF)2I3 is a metal with electrons as major carriers, which agrees with previous calculationsKino and Miyazaki (2006); Mori (2010); Alemany et al. (2012) where also electron pockets were found and additionally small hole pockets. As previously discussed by Alemany et al.Alemany et al. (2012), the difference can be ascribed to numerical uncertainties in the calculations since the difference are on the meV regime as well as on the (unrelaxed) used crystal structures leading to small deviations.
At K the bands shift and an indirect gap of 21 meV opens, as shown in Fig. 14(b); optical excitations see the smallest direct gap of 55 meV. For more details on the calculated optical properties see Ref. Peterseim and Dressel, 2016. Very similar results were reported by Alemany et al.Alemany et al. (2012) We also want to note that the bands exhibit basically no dispersion in the -direction, independent on temperature. Treating -(BEDT-TTF)2I3 as a two-dimensional metal or narrow-gap semiconductor, respectively, seems to be a rather good choice.
Appendix B Tuning the Charge-Order
In order to illustrate the dependence of the charge order on electronic correlations, we have replotted the molecular charge and given in Figs. 5 and 6 as a function of effective intersite Coulomb repulsion normalized to the ambient pressure value. The conversion from hydrostatic pressure to effective Coulomb interaction was estimated by using the pressure dependent lattice parameters,Kondo et al. (2005); Kino and Miyazaki (2006); Kondo et al. (2009) assuming a slight distance dependence of the electronic interaction and a strong linear increase of the hopping integral with pressure, known also from comparable organic charge-transfer salts.Rose et al. (2013); Jacko et al. (2013)
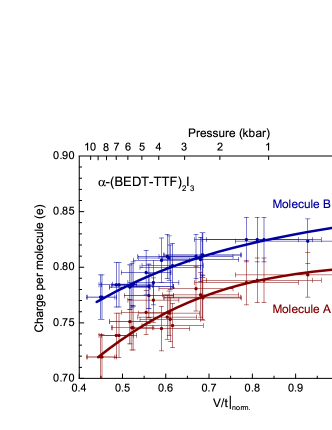
The uncertainty in determining the charge on the molecules A and B from the shift of the molecular vibrations, in measuring the actually applied pressure at low temperatures and in evaluating the effective Coulomb repulsion from the hydrostatic pressure leads to large error bars. Nevertheless, by summarizing the data from various temperatures and pressure runs, we can identify a similar behavior for both molecules. For it extrapolates to the values of 0.64 and determined in the metallic state (Fig. 3). With increasing the molecular charge density seems to saturate at approximately the maximum value obtained at ambient pressure and low temperatures.
Appendix C EMV-Coupled Vibrations
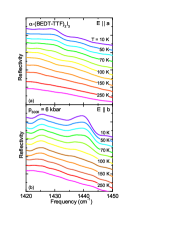
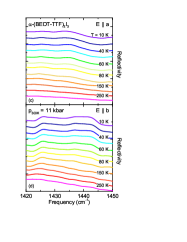
In the Sec. III we analyzed only the asymmetric (b1u) mode obtained from the spectra taken at pressed pellets. This can be complemented by reflection experiments off the -plane (see below) where fingerprints of the charge-sensitive modes (ag) and (ag) become visible in the same range of frequency. These are symmetric vibrations of the two C=C bonds that become infrared active via electron-molecular vibrational (emv) coupling.Dressel and Drichko (2004); Girlando (2011) Their dependence on the charge located on the BEDT-TTF molecule is comparable to the one of the (b1u) mode. In Fig. 16 we plot the optical reflectivity for different polarizations and temperatures taken at a pressure values of 6 and 11 kbar. The vibrational features become more pronounced at low temperaturs; they shift to higher frequencies as pressure increases indicating the significant reduction of charge. Due to the emv coupling and broad spectral feature, we refrain from a quantitative analysis of the temperature and pressure dependence of the (ag) and (ag) modes and refer to more sensitive Raman experiments.Wojciechowski et al. (2003)
Appendix D Dirac Cone
By looking at the frequency dependent conductivity of -(BEDT-TTF)2I3 at low and high , plotted in Fig. 17, one is puzzled by the large range with a linear increase: between 500 and 1400 cm-1 the conductivity follows . Recently such a linear frequency dependence in the optical conductivity of quasicrystals,Timusk et al. (2013) ZrTe5,Chen et al. (2015) and Cd3As3Neubauer et al. (2016) was considered the hallmark for Dirac physics in three dimensions. The arguments are based on calculationsHosur et al. (2012); Bácsi and Virosztek (2013) for the interband optical response of -dimensional Dirac systems, where a power-law frequency dependence was found, with the exponent defined by the energy dispersion . While in two dimensions this leads to the constant conductivity observed in graphene, in three-dimensional Dirac electron systems with a linearly dispersing cone, this yields
| (3) |
where is the conductance quantum, Js Planck’s constant, and is the number of non-degenerate bands.
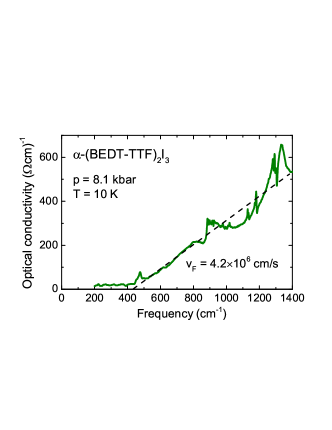
While for graphene, quasi-crystals or Cd3As2 the relevant energy range of intraband transitions may extend up to 1 eV, in the case of -(BEDT-TTF)2I3 the band are much for narrow and tilted. The linear energy dispersion extends only up to meV;Kobayashi et al. (2009) accordingly the regime of linear optical conductivity will be restricted below approximately 1500 cm-1. Using Eq. (3) with the best fit yields the Fermi velocity cm/s, in good agreement with estimates from magnetotransport measurementsTajima et al. (2012b); Monteverde et al. (2013) and theoretical considerations.Kobayashi et al. (2007); Goerbig et al. (2008) As sketched in Fig. 1(c), the Dirac cone of -(BEDT-TTF)2I3 is strongly tilted with a difference in slope by a factor of 10 or more.Kobayashi et al. (2009) In general, optics is not momentum selective and in the case of anisotropic bands we always probe the lowest velocity , independent on polarization.
These considerations pose the question whether our observation of is a fingerprint of the linear band dispersion. By now -(BEDT-TTF)2I3 was always considered a strictly two-dimensional electron system system, in accordance with the bandstructureKino and Miyazaki (2006); Alemany et al. (2012); Peterseim and Dressel (2016) as demonstrated in Fig. 14. However, is this still valid for high pressure, low temperatures and low energies?
References
- Bender et al. (1984a) K. Bender, H. Endres, H.-W. Helberg, I. Hennig, H. Schäfer, H. Keller, and D. Schweitzer, Mol. Cryst. Liq. Cryst. 107, 45 (1984a).
- Bender et al. (1984b) K. Bender, I. Hennig, D. Schweitzer, K. Dietz, H. Endres, and H. Keller, Mol. Cryst. Liq. Cryst. 108, 359 (1984b).
- Dressel et al. (1994) M. Dressel, G. Grüner, J. Pouget, A. Breining, and D. Schweitzer, J. Phys. (Paris) I 4, 579 (1994).
- Kino and Fukuyama (1995) H. Kino and H. Fukuyama, J. Phys. Soc. Jpn. 64, 1877 (1995).
- Kino and Fukuyama (1996) H. Kino and H. Fukuyama, J. Phys. Soc. Jpn. 65, 2158 (1996).
- Seo et al. (2004) H. Seo, C. Hotta, and H. Fukuyama, Chem. Rev. 104, 5005 (2004).
- Takano et al. (2001) Y. Takano, K. Hiraki, H. Yamamoto, T. Nakamura, and T. Takahashi, J. Phys. Chem. Solids 62, 393 (2001).
- Wojciechowski et al. (2003) R. Wojciechowski, K. Yamamoto, K. Yakushi, M. Inokuchi, and A. Kawamoto, Phys. Rev. B 67, 224105 (2003).
- Dressel and Drichko (2004) M. Dressel and N. Drichko, Chem. Rev. 104, 5689 (2004).
- Alemany et al. (2012) P. Alemany, J.-P. Pouget, and E. Canadell, Phys. Rev. B 85, 195118 (2012).
- Kartsovnik et al. (1985) M. V. Kartsovnik, P. A. Kononovich, V. N. Laukhin, A. G. Khomenko, and I. F. Shchegolev, Sov. Phys. JETP 61, 866 (1985).
- Schwenk et al. (1985) H. Schwenk, F. Gross, C.-P. Heidmann, K. Andres, D. Schweitzer, and H. Keller, Mol. Cryst. Liq. Cryst. 119, 329 (1985).
- Tajima et al. (2000) N. Tajima, M. Tamura, Y. Nishio, K. Kajita, and Y. Iye, J. Phys. Soc. Jpn. 69, 543 (2000).
- Drichko et al. (2009) N. Drichko, S. Kaiser, Y. Sun, C. Clauss, M. Dressel, H. Mori, J. Schlueter, E. I. Zhyliaeva, S. A. Torunova, and R. N. Lyubovskaya, Physica B 404, 490 (2009).
- Girlando (2011) A. Girlando, J. Phys. Chem. C 115, 19371 (2011).
- Yakushi (2012) K. Yakushi, Crystals 2, 1291 (2012).
- Goerbig et al. (2008) M. O. Goerbig, J.-N. Fuchs, G. Montambaux, and F. Piéchon, Phys. Rev. B 78, 045415 (2008).
- Clauss et al. (2010) C. Clauss, N. Drichko, D. Schweitzer, and M. Dressel, Physica B 405, S144 (2010).
- Ivek et al. (2011) T. Ivek, B. Korin-Hamzić, O. Milat, S. Tomić, C. Clauss, N. Drichko, D. Schweitzer, and M. Dressel, Phys. Rev. B 83, 165128 (2011).
- Kino and Miyazaki (2006) H. Kino and T. Miyazaki, J. Phys. Soc. Jpn. 75, 034704 (2006).
- Peterseim and Dressel (2016) T. Peterseim and M. Dressel, to be published (2016).
- Tajima et al. (2006) N. Tajima, S. Sugawara, M. Tamura, Y. Nishio, and K. Kajita, J. Phys. Soc. Jpn. 75, 051010 (2006).
- Tajima et al. (2012a) N. Tajima, Y. Nishio, and K. Kajita, Crystals 2, 643 (2012a).
- Kondo et al. (2005) R. Kondo, S. Kagoshima, and J. Harada, Rev. Sci. Instr. 76, 093902 (2005).
- Katayama et al. (2006) S. Katayama, A. Kobayashi, and Y. Suzumura, J. Phys. Soc. Jpn. 75, 054705 (2006).
- Kobayashi et al. (2007) A. Kobayashi, S. Katayama, Y. Suzumura, and H. Fukuyama, J. Phys. Soc. Jpn. 76, 034711 (2007).
- Kajita et al. (2014) K. Kajita, Y. Nishio, N. Tajima, Y. Suzumura, and A. Kobayashi, J. Phys. Soc. Jpn. 83, 072002 (2014).
- Wehling et al. (2014) T. Wehling, A. Black-Schaffer, and A. Balatsky, Adv. Phys. 63, 1 (2014).
- Kakiuchi et al. (2007) T. Kakiuchi, Y. Wakabayashi, S. Hiroshi, T. Takahashi, and T. Nakamura, J. Phys. Soc. Jpn. 76, 113702 (2007).
- Moldenhauer et al. (1993) J. Moldenhauer, C. Horn, K. Pokhodnia, D. Schweitzer, I. Heinen, and H. Keller, Synthetic Met. 60, 31 (1993).
- Yamamoto et al. (2008) K. Yamamoto, S. Iwai, S. Boyko, A. Kashiwazaki, F. Hiramatsu, C. Okabe, N. Nishi, and K. Yakushi, J. Phys. Soc. Jpn. 77, 074709 (2008).
- Yamamoto et al. (2010) K. Yamamoto, A. Kowalska, and K. Yakushi, Appl. Phys. Lett. 96, 122901 (2010).
- Ivek et al. (2010) T. Ivek, B. Korin-Hamzić, O. Milat, S. Tomić, C. Clauss, N. Drichko, D. Schweitzer, and M. Dressel, Phys. Rev. Lett. 104, 206406 (2010).
- Tomić and Dressel (2015) S. Tomić and M. Dressel, Rep. Progr. Phys. 78, 096501 (2015).
- Kajita et al. (1992) K. Kajita, T. Ojiro, H. Fujii, Y. Nishio, H. Kobayashi, A. Kobayashi, and R. Kato, J. Phys. Soc. Jpn. 61, 23 (1992).
- Ojiro et al. (1993) T. Ojiro, K. Kajita, Y. Nishio, H. Kobayashi, A. Kobayashi, R. Kato, and Y. Iye, Synthetic Met. 56, 2268 (1993).
- rem (a) The experiments are performed by standard four-probe method with the single crystal placed in a copper-beryllium cell filled with Daphne oil, similar to the one used for the optical experiments.
- rem (b) Most publications only indicate the pressure applied at room temperature. Upon cooling, this value changes significantly. Except otherwise stated, we consitently quote the actual pressure for any temperature given. This implies that the complete suppression of the insulating state might be reached at considerably lower pressure than 12-15 kbar, given in previous references.
- Tajima et al. (2007) N. Tajima, S. Sugawara, M. Tamura, R. Kato, Y. Nishio, and K. Kajita, Europhys. Lett. (EPL) 80, 47002 (2007).
- Takano et al. (2010) Y. Takano, K. Hiraki, Y. Takada, H. M. Yamamoto, and T. Takahashi, J. Phys. Soc. Jpn. 79, 104704 (2010).
- Hirata et al. (2011) M. Hirata, K. Ishikawa, K. Miyagawa, K. Kanoda, and M. Tamura, Phys. Rev. B 84, 125133 (2011).
- Konoike et al. (2012) T. Konoike, K. Uchida, and T. Osada, J. Phys. Soc. Jpn. 81, 043601 (2012).
- Konoike et al. (2013) T. Konoike, M. Sato, K. Uchida, and T. Osada, J. Phys. Soc. Jpn. 82, 073601 (2013).
- Monteverde et al. (2013) M. Monteverde, M. O. Goerbig, P. Auban-Senzier, F. Navarin, H. Henck, C. R. Pasquier, C. Mézière, and P. Batail, Phys. Rev. B 87, 245110 (2013).
- Koch et al. (1985) B. Koch, H. P. Geserich, W. Ruppel, D. Schweitzer, K. H. Dietz, and H. J. Keller, Mol. Cryst. Liq. Cryst. 119, 343 (1985).
- Sugano et al. (1985) T. Sugano, K. Yamada, G. Saito, and M. Kinoshita, Solid State Commun. 55, 137 (1985).
- Meneghetti et al. (1986) M. Meneghetti, R. Bozio, and C. Pecile, J. Phys. (Paris) 47, 1377 (1986).
- Yakushi et al. (1987) K. Yakushi, H. Kanbara, H. Tajima, H. Kuroda, G. Saito, and T. Mori, Bull. Chem. Soc. Jpn. 60, 4251 (1987).
- Železny et al. (1990) V. Železny, J. Petzelt, R. Swietlik, B. Gorshunov, A. Volkov, G. Kozlov, D. Schweitzer, and H. Keller, J. Phys. (Paris) 51, 869 (1990).
- Beyer and Dressel (2015) R. Beyer and M. Dressel, Rev. Sci. Instr. 86, 053904 (2015).
- Yamamoto et al. (2005) T. Yamamoto, M. Uruichi, K. Yamamoto, K. Yakushi, A. Kawamoto, and H. Taniguchi, J. Phys. Chem. B 109, 15226 (2005).
- Sedlmeier et al. (2012) K. Sedlmeier, S. Elsässer, D. Neubauer, R. Beyer, D. Wu, T. Ivek, S. Tomić, J. A. Schlueter, and M. Dressel, Phys. Rev. B 86, 245103 (2012).
- Yue et al. (2010) Y. Yue, K. Yamamoto, M. Uruichi, C. Nakano, K. Yakushi, S. Yamada, T. Hiejima, and A. Kawamoto, Phys. Rev. B 82, 075134 (2010).
- Dressel and Grüner (2002) M. Dressel and G. Grüner, Electrodynamics of Solids (Cambridge University Press, Cambridge, 2002).
- Köhler et al. (2011) B. Köhler, E. Rose, M. Dumm, G. Untereiner, and M. Dressel, Phys. Rev. B 84, 035124 (2011).
- Dressel et al. (2012) M. Dressel, M. Dumm, T. Knoblauch, and M. Masino, Crystals 2, 528 (2012).
- Foury-Leylekian et al. (2010) P. Foury-Leylekian, S. Petit, G. Andre, A. Moradpour, and J. Pouget, Physica B 405, S95 (2010).
- Yasin et al. (2012) S. Yasin, B. Salameh, E. Rose, M. Dumm, H.-A. Krug von Nidda, A. Loidl, M. Ozerov, G. Untereiner, L. Montgomery, and M. Dressel, Phys. Rev. B 85, 144428 (2012).
- Rose et al. (2013) E. Rose, C. Loose, J. Kortus, A. Pashkin, C. A. Kuntscher, S. G. Ebbinghaus, M. Hanfland, F. Lissner, T. Schleid, and M. Dressel, J. Phys.: Condens. Matter 25, 014006 (2013).
- rem (c) As the applied pressure increases, the lattice hardens, generally causing an upshift of the vibrational frequencies. This is less effective for the molecular vibrations considered here. Nevertheless, our estimate of charge disproportionation has to be considered as an upper bound.
- rem (d) It might be usefull to perform a complete ab initio calculation of the lattice and molecular vibrations taking cations and anions into account. For -(BEDT-TTF)2Cu2(CN)3 this sort of comprehensive study did bring new insight into the electrodynamic properties; M. Dressel, P. Lazić, A. Pustogow, E. Zhukova, B. Gorshunov, J. A. Schlueter, O. Milat, B. Gumhalter, and S. Tomić, Phys. Rev. B 93, 081201 (2016).
- Pashkin et al. (2006) A. Pashkin, M. Dressel, and C. A. Kuntscher, Phys. Rev. B 74, 165118 (2006).
- rem (e) According to our previously established procedure for the analysis of pressure-dependent infrared reflection experiment, the measured spectra are first fitted by the RefFit-software [A. B. Kuzmenko, Rev. Sci. Instrum. 76, 083108 (2005)] in order to achieve the most suitable extrapolation of the experimental spectra to lower and higher frequencies necessary for the Kramers-Kronig analysis. This way, the subtle change around are taken into account in the more sensitive way compared to the simplifying approaches of constant reflectivity and standard Hagen-Rubens extrapolation. The reflectivity in the diamond absorption range was linearly interpolated; the diamond interface is taken into account as a phase factor. The optical conductivity is calculated via Kramers-Kronig relations and compared to the RefFit results for consistency check (cf. Refs. Pashkin et al., 2006; Beyer and Dressel, 2015).
- Emge et al. (1986) T. J. Emge, P. C. W. Leung, M. A. Beno, H. H. Wang, J. M. Williams, M.-H. Whangbo, and M. Evain, Mol. Cryst. Liq. Cryst. 138, 393 (1986).
- Ishibashi et al. (2006) S. Ishibashi, T. Tamura, M. Kohyama, and K. Terakura, J. Phys. Soc. Jpn. 75, 015005 (2006).
- Kondo et al. (2009) R. Kondo, S. Kagoshima, N. Tajima, and R. Kato, J. Phys. Soc. Jpn. 78, 114714 (2009).
- Mori (2010) T. Mori, J. Phys. Soc. Jpn. 79, 014703 (2010).
- Dressel et al. (2009) M. Dressel, D. Faltermeier, M. Dumm, N. Drichko, B. Petrov, V. Semkin, R. Vlasova, C. M ziere, and P. Batail, Physica B 404, 541 (2009).
- Drichko et al. (2006) N. Drichko, M. Dressel, C. A. Kuntscher, A. Pashkin, A. Greco, J. Merino, and J. Schlueter, Phys. Rev. B 74, 235121 (2006).
- Tajima et al. (2012b) N. Tajima, R. Kato, S. Sugawara, Y. Nishio, and K. Kajita, Phys. Rev. B 85, 033401 (2012b).
- Wu et al. (2010) D. Wu, N. Barišić, P. Kallina, A. Faridian, B. Gorshunov, N. Drichko, L. J. Li, X. Lin, G. H. Cao, Z. A. Xu, et al., Phys. Rev. B 81, 100512 (2010).
- Barišić et al. (2010) N. Barišić, D. Wu, M. Dressel, L. J. Li, G. H. Cao, and Z. A. Xu, Phys. Rev. B 82, 054518 (2010).
- Homes et al. (2015) C. C. Homes, M. N. Ali, and R. J. Cava, Phys. Rev. B 92, 161109 (2015).
- Suzumura et al. (2014) Y. Suzumura, I. Proskurin, and M. Ogata, J. Phys. Soc. Jpn. 83, 094705 (2014).
- Suzumura et al. (2015) Y. Suzumura, I. Proskurin, and M. Ogata, J. Phys.: Conf. Ser. 603, 012011 (2015).
- Gusynin et al. (2006) V. P. Gusynin, S. G. Sharapov, and J. P. Carbotte, Phys. Rev. Lett. 96, 256802 (2006).
- Giannozzi et al. (2009) P. Giannozzi, S. Baroni, N. Bonini, M. Calandra, R. Car, C. Cavazzoni, D. Ceresoli, G. L. Chiarotti, M. Cococcioni, I. Dabo, et al., J. Phys.: Condens. Matter 21, 395502 (2009).
- Perdew et al. (1996) J. P. Perdew, K. Burke, and M. Ernzerhof, Phys. Rev. Lett. 77, 3865 (1996).
- Monkhorst and Pack (1976) H. J. Monkhorst and J. D. Pack, Phys. Rev. B 13, 5188 (1976).
- Jacko et al. (2013) A. Jacko, H. Feldner, E. Rose, F. Lissner, M. Dressel, R. Valentí, and H. Jeschke, Phys. Rev. B 87, 155139 (2013).
- Timusk et al. (2013) T. Timusk, J. P. Carbotte, C. C. Homes, D. N. Basov, and S. G. Sharapov, Phys. Rev. B 87, 235121 (2013).
- Chen et al. (2015) R. Y. Chen, S. J. Zhang, J. A. Schneeloch, C. Zhang, Q. Li, G. D. Gu, and N. L. Wang, Phys. Rev. B 92, 075107 (2015).
- Neubauer et al. (2016) D. Neubauer, J. P. Carbotte, A. A. Nateprov, A. Löhle, M. Dressel, and A. V. Pronin, Phys. Rev. B 93, 121202 (2016).
- Hosur et al. (2012) P. Hosur, S. A. Parameswaran, and A. Vishwanath, Phys. Rev. Lett. 108, 046602 (2012).
- Bácsi and Virosztek (2013) A. Bácsi and A. Virosztek, Phys. Rev. B 87, 125425 (2013).
- Kobayashi et al. (2009) A. Kobayashi, S. Katayama, and Y. Suzumura, Sci. Technol. Adv. Mater. 10, 024309 (2009).