33email: Anthony.Jones@ias.u-psud.fr
Mantle formation, coagulation and the origin of cloud/core shine:
I. Modelling dust scattering and absorption in the infra-red
Abstract
Context. The observed cloudshine and coreshine (C-shine) have been explained in terms of grain growth leading to enhanced scattering from clouds in the J, H and K photometric bands and the Spitzer IRAC 3.6 and 4.5 m bands.
Aims. Using our global dust modelling approach THEMIS (The Heterogeneous dust Evolution Model at the IaS) we explore the effects of dust evolution in dense clouds, through aliphatic-rich carbonaceous mantle formation and grain-grain coagulation.
Methods. We model the effects of wide band gap a-C:H mantle formation and the low-level aggregation of diffuse interstellar medium dust in the moderately-extinguished outer regions of molecular clouds.
Results. The formation of wide band gap a-C:H mantles on amorphous silicate and amorphous carbon (a-C) grains leads to a decrease in their absorption cross-sections but no change in their scattering cross-sections at near-IR wavelengths, resulting in higher albedos.
Conclusions. The evolution of dust, with increasing density and extinction in the diffuse to dense molecular cloud transition, through mantle formation and grain aggregation, appears to be a likely explanation for the observed C-shine.
Key Words.:
Interstellar Medium: dust, emission, extinction – Interstellar Medium: molecules – Interstellar Medium: general1 Introduction
The study of starlight scattering by dust dates back to the pioneering work of Struve & Elvey (1936), Struve (1937), Henyey & Greenstein (1941), Witt (1968) and Mattila (1970b, a) who made some of the earliest measurements of the rather high dust albedo () and its scattering asymmetry parameter at visible wavelengths. Later studies showed that the near-infrared (NIR) albedo in the J (m), H (m) and K (m) bands is also high () (Witt et al. 1994; Lehtinen & Mattila 1996). Further, Lehtinen & Mattila (1996) showed that the NIR surface brightness of translucent and denser clouds can be explained by scattered radiation with little need for a contribution from dust emission at these wavelengths.
Motivated by the “extraordinary” images of the Perseus region made by Foster & Goodman (2006), Padoan et al. (2006) provided a formalism to convert NIR (J, H, and K band) scattering measurements into accurate column density estimates over a wide range of visual extinction (i.e., mag.). In their extinction mapping of the Perseus molecular cloud complex in the J, H and K bands, in regions with mag, Foster & Goodman (2006) noted some “emission” structures associated with the clouds, which they then dubbed “cloudshine”. Foster & Goodman (2006) also interpreted their observations in terms of starlight scattering by dust in clouds and assumed it to be a measure of the dust mass distribution in denser regions.
Seemingly related to cloudshine is the observed “emission” in the Spitzer IRAC 3.6 and 4.5 m bands, which was termed “coreshine” by Steinacker et al. (2010). The IRAC 5.8 m band, in contrast, shows weak absorption while the IRAC 8 m band appears in absorption. Steinacker et al. (2010) and Andersen et al. (2013) interpret cloudshine and coreshine observations in terms of the scattering of mid-IR photons by big grains (radii m) deeper within the cloud and conclude that this is evidence for significant dust growth within clouds. As Andersen et al. (2013) find, assuming spherical and homogeneous dust particles, the required cloudshine and coreshine grains must be significantly larger than the largest diffuse interstellar medium (ISM) grains (e.g., radii m), from which they must have formed. This explanation requires an increase in the largest, individual grain volumes by a factor of .
The approach that we use here is an application of the composition- and size-dependent optical properties derived for a-C(:H) materials (the optEC(s) and optEC(s)(a) datasets, Jones 2012a, b, c) and the application of these within the framework of the Jones et al. (2013) interstellar dust model, which has been compared to recent Planck observations (Ysard et al. 2015; Fanciullo et al. 2015). The original Jones et al. (2013) dust model was revised to encompass more realistic olivine- and pyroxene-type amorphous silicates with metallic iron and iron sulphide nano-inclusions (Köhler et al. 2014). This model was then extended to allow us to follow the evolution of the dust properties in the transition between diffuse and dense interstellar media (Jones et al. 2014; Köhler et al. 2015, and also the companion paper, Ysard et al. 2015, hereafter called paper II). This modelling approach provides a general framework within which the solutions to several interesting interstellar conundrums such as “volatile” silicon in photo-dissociation regions (PDRs), sulphur and nitrogen depletions, the origin of the blue and red photoluminescence and the diffuse interstellar bands (DIBs) may yet be found (Jones 2013, 2014). This approach has also led to suggestions for viable routes to interstellar/circumstellar fullerene formation (Micelotta et al. 2012) and to the formation of molecular hydrogen in moderately excited photo-dissociation regions (Jones & Habart 2015). Additionally, we have studied dust evolution in energetic environments such as supernova-driven shock waves and a hot coronal gas (Micelotta et al. 2010b, a; Bocchio et al. 2012, 2013, 2014).
In this paper we explore a likely self-consistent solution for both cloudshine and coreshine (hereafter collectively called C-shine) via dust growth through the formation of aliphatic-rich amorphous hydrocarbon mantles,111Here we imply the formation of outer a-C:H layers on grains by the accretion of carbon and hydrogen atoms from the gas and/or by the hydrogenation of pre-existing a-C(:H) grain surfaces. a-C:H, and the onset of grain-grain aggregation. The combination of mantle formation and minimal coagulation lead to rather unusual optical properties. In the companion paper (Ysard et al. 2015, paper II) we use a radiative transfer model to explore the effects of this dust evolution scenario to explain the origin of C-shine.
We now refer to our evolutionary dust modelling approach, and all future developments and extensions of it, under the umbrella acronym THEMIS (The Heterogeneous dust Evolution Model at the IaS). For a detailed description of the THEMIS framework the reader is referred to Jones et al. (2016).
This paper is organised as follows: Section 2 considers carbon mantle formation in the ISM in terms of the mantle composition and its spectroscopic and optical properties, Section 3 explores a-C:H mantle effects on the dust absorption and scattering properties, Section 4 discusses the astrophysical implications and Section 5 presents our conclusions.
2 a-C:H formation
In the ISM the amorphous hydrocarbon, a-C(:H), dust component is most likely a mix of wide band gap, H-rich, aliphatic-rich (hereafter a-C:H) and narrow band gap, H-poor, aromatic-rich (hereafter a-C) materials (Jones 2012a, b, c, 2013).222Using Figs. 1 and 5 from Jones (2012b) we can better define the a-C(:H) material descriptors “H-rich and aliphatic-rich” and “H-poor and aromatic-rich” in terms of their hydrogen atom and sp3 and sp2 carbon atom fractions, , and , respectively (where ) and the ratio . The Tauc band gap for a-C(:H) materials is given by and these materials are clearly,
H-rich and aliphatic-rich for and ( eV) and
H-poor and aromatic-rich for and ( eV).
Intermediate materials (, , eV) exhibit and most of their sp2 carbon atoms are in olefinic bonding configurations rather than in aromatic structures. The accretion of C and H atoms in the diffuse ISM is often assumed to lead to the formation of a-C:H mantles on aromatic-rich carbonaceous dust surfaces (e.g., Jones et al. 1990; Mennella et al. 2002; Chiar et al. 2013; Cecchi-Pestellini et al. 2014a, b). The supposition of inner aromatic/outer aliphatic layering on carbonaceous dust has now been called into question in works that point out the likely dominant effects of UV photo-processing in the diffuse ISM333Diffuse ISM is here taken to mean regions where the Jones et al. (2013)/Köhler et al. (2014) model is applicable, i.e., where A and cm-3.
(Godard et al. 2011; Jones 2012a, b, c, 2013; Jones et al. 2013, 2014). Further, Jones et al. (2013, 2014)
have shown that a-C:H mantles can probably only form in the transition from the diffuse ISM to the dense molecular clouds where there is moderate extinction (, Jones et al. 2014). A self-consistent approach to the formation and (photo-)evolution of interstellar a-C(:H) materials appears to be able to explain many dust observables (Jones 2012a, b, c, 2013; Jones et al. 2013, 2014; Köhler et al. 2014; Jones 2014; Fanciullo et al. 2015; Köhler et al. 2015; Ysard et al. 2015, paper II).
Recent work by Parvathi et al. (2012) indicates a total interstellar carbon abundance of (C/H) ppm and, with ppm in dust in the diffuse ISM (Jones et al. 2013; Ysard et al. 2015), there is likely a large reservoir of gas phase carbon ( ppm) in the low density ISM that could accrete onto dust in denser regions. In low extinction regions () a-C(:H) grain mantles will be composed of a-C because of photo-processing/dehydrogenation by EUV-UV photons (Jones 2012a, b; Jones et al. 2013, 2014). However, with higher density and extinction the surface layers should be be richer in hydrogen (i.e., a-C:H) because of the reduced effects of EUV-UV photolysis and/or the increased importance of carbon mantle re-hydrogenation (Mennella et al. 2002; Godard et al. 2011; Jones et al. 2014). Thus, C and H atom accretion from the gas phase and/or surface hydrogenation in a moderately extinguished medium () could lead to the formation of a-C:H mantles on all grains. The characteristic extinction properties of this material are a strong FUV extinction and a weak UV bump, as observed along the line of sight towards HD 207198, which shows a high carbon depletion (i.e., (C/H) ppm, Parvathi et al. 2012).
2.1 The spectroscopy of a-C(:H) materials in the 3 m region
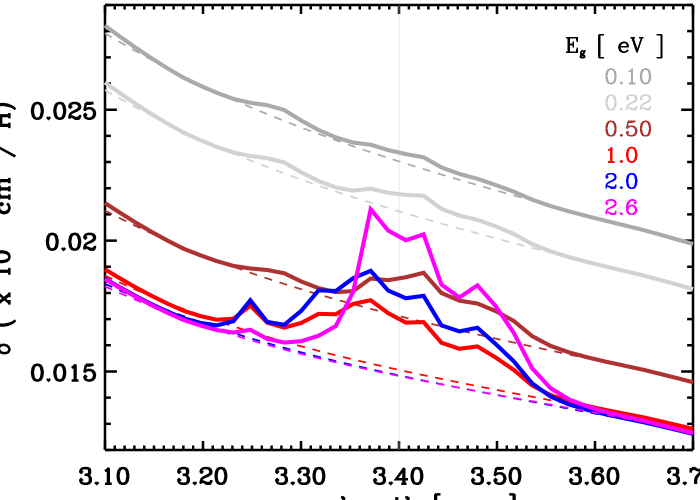
The absorption spectra of a-C(:H) materials in the m wavelength region show a broad, multi-component m feature, which is composed of about ten sub-features due to aliphatic, olefinic and aromatic C-H stretching bands. More than half of these bands are due to aliphatic CHn () bonds. The detailed shape of this absorption band is therefore sensitive to the a-C(:H) material composition (H atom content and band gap, ) and structure (C atom sp3/sp2 bonding ratio) and likely varies with the degree of photo-processing and/or hydrogenation experienced in the ISM (Jones 2012a, b, c; Jones et al. 2013). In Fig. 1 we show the Jones et al. (2013) dust model spectrum in the m region as a function of the a-C(:H) mantle composition. As per Jones (2012b) we use the Tauc definition of the band gap, , to characterise the a-C(:H) materials considered here.
In addition to EUV photons, energetic heavy ion impacts, analogues of cosmic ray irradiation, can also induce structural changes in a-C(:H) solids. Ion irradiation does lead to a significant decrease in the m band strength but its effects on the constituent band-to-band ratios are seemingly small (Godard et al. 2011). From their study Godard et al. (2011) concluded that cosmic ray processing is subordinate to EUV photolytic processing in the ambient ISM except in dense clouds where the EUV photon flux is highly extinguished.
2.2 The mid-IR properties of a-C:H
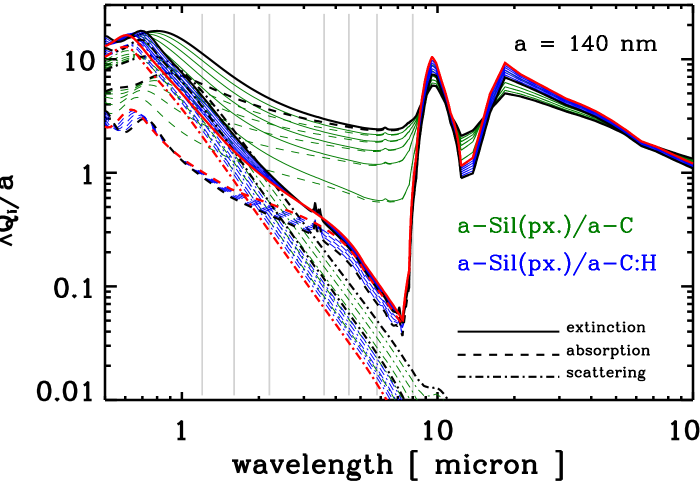
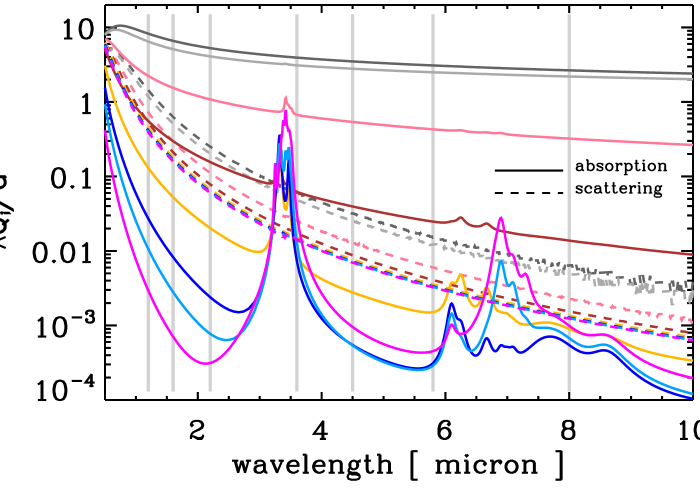
Variations in the band gap of a-C(:H) materials have interesting effects on their optical properties. We illustrate this in Fig. 3 where we show the absorption and scattering efficiency factors, and 444Calculated using the Mie routine BHMIE for homogeneous spheres (Bohren & Huffman 1998). respectively, for a-C:H particles with radius nm. For clarity we plot the data as (where abs and sca, respectively) as a function of wavelength and the Tauc band gap, eV. From these data we note that for 100 nm radius a-C particles ( eV) the NIR extinction (1 mm) is dominated by absorption. However, for wide band gap (1 eV eV) a-C:H particles the absorption decreases with increasing and so allows the normally subordinate scattering to dominate at these wavelengths.
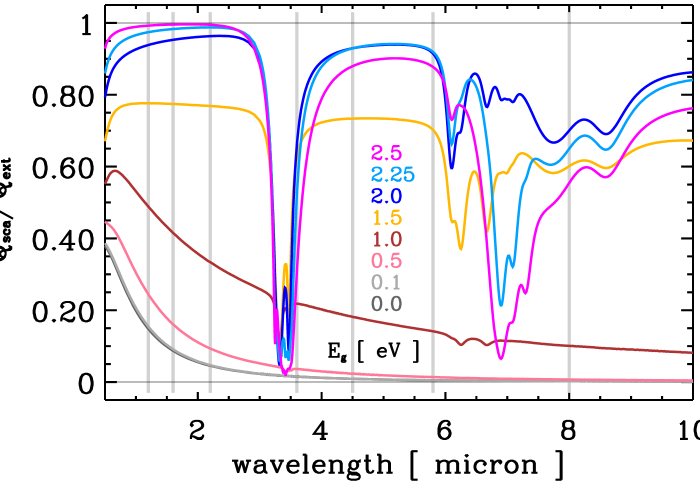
In Fig. 4 we show the scattering contribution to the extinction, plotted as , where . This figure shows that for homogeneous, a-C:H particles ( eV) the J, H, K, and IRAC 4.5 and 5.8 m bands would be dominated by scattering. However, the IRAC 3.6 m band would be affected by the strong absorption bands in the m region and, more importantly, by the emission in these bands coming from stochastically-heated dust in the outer regions of the cloud. Further, the IRAC 8 m band would also be affected by the m a-C(:H) absorption bands and also by the blue wing of the m amorphous silicate band.
The dominance of scattering in a-C:H particles is due to the fact that the absorption (scattering) is determined, principally, by the imaginary (real) part of the complex refractive index, which becomes significantly weaker (remains almost constant) in wider band gap materials (e.g., Jones 2012b, c). Thus, for a fixed mass of material (here equivalent to 100 nm radius particles) with increasing band gap the absorption cross-section can drop by several orders of magnitude in the near-IR, whereas the scattering cross-section evolves comparatively little.
The subordination of absorption to scattering in nm radius, wide band gap a-C:H particles could be a manifestation of Anderson localisation. This effect occurs in disordered (amorphous) materials due to electron wave trapping and the disappearance of conductivity in the metal-insulator transition (Anderson 1958),555A concept for which Philip Anderson, Nevill Mott and John van Vleck shared the 1977 Nobel Prize in Physics. and is strongly dependent upon the dimension (i.e., 1, 2 or 3D) and size of the disordered medium. Anderson localisation occurs with both classical light and sound waves in disordered media. Systems that scatter strongly can be synthesised but observing localisation with light is challenging because the scattering has to be maximised without introducing absorption. This can be achieved by using light with photon energies less than the electronic band gap of a semiconductor material with a high refractive index. Additionally, when the wavelength of the photon is large compared to the particle radius () the mean free path of the absorbing electrons, with energies near the band edge, are smaller than their equivalent wavelength and the electrons are therefore localised. Under these conditions the photons are scattered simply because they cannot be absorbed. This effect and the nearly complete localisation of near-IR light was observed by Wiersma et al. (1997) in a finely-ground gallium arsenide powder.
As well-described by Robertson (1986), a-C(:H) materials are disordered/amorphous solids that exhibit a wide range of semiconducting to insulating properties, depending on their band gap. In the relatively wide band gap optEC(s)(a) a-C:H materials with eV the refractive index, , for m lies within the range and is practically independent of the wavelength and the particle size (Jones 2012b, c), conditions that lead to almost pure scattering particles with suppressed absorption in the IR (see Fig. 3). These conditions are similar to those in the Wiersma et al. (1997) IR scattering experiment and the observed C-shine occurring within thin layers ( nm thick on nm radius grains, i.e., essentially 2D structures) of wide band gap a-C:H mantles on the grains could then be a manifestation of Anderson localisation.
Here we considered the ‘ideal’ and unlikely case of pure grains of wide band gap a-C:H materials. In the following section we therefore extend this study to the more realistic case of a-C(:H) layers on grain cores of various compositions.
3 An exploration of core/mantle grain absorption and scattering effects
We now investigate the effects of absorption and scattering within the framework of our core/mantle dust model (Jones et al. 2013, 2014; Köhler et al. 2014, 2015) and the formation of nm thick carbonaceous mantles. It should be noted that the thicker mantles ( nm) are for illustrative purposes only. In the ISM the carbonaceous mantles are likely to be at most nm thick because of cosmic carbon abundance limitations (Ysard et al. 2015). To do this we explore the absorption and scattering effects of wide band gap a-C:H layers on spherical particles.
3.1 The effects of a-C and a-C:H mantles
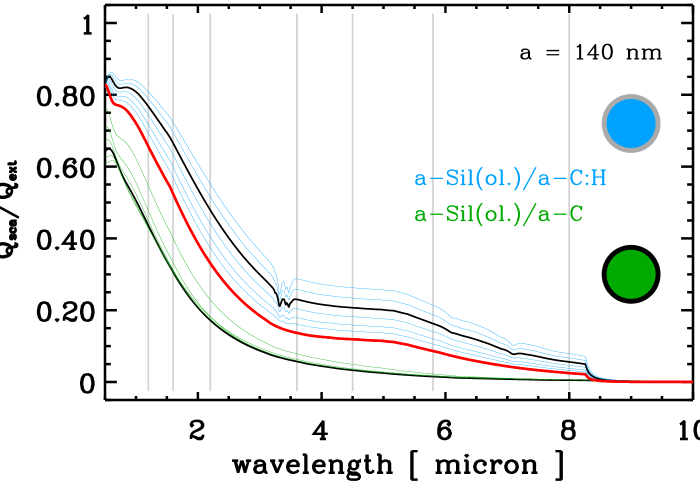
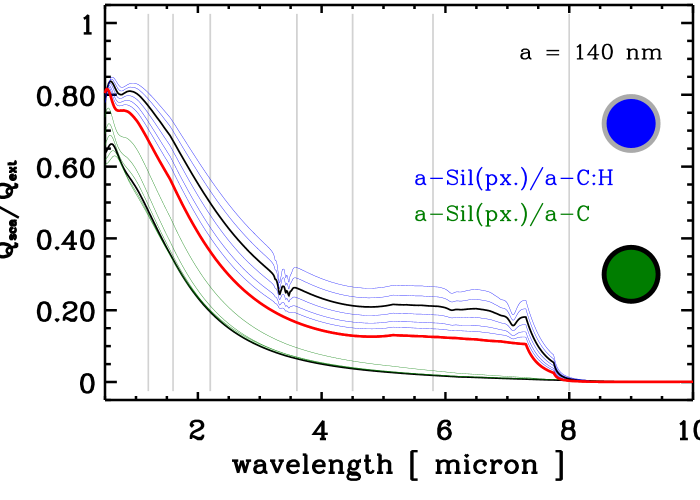
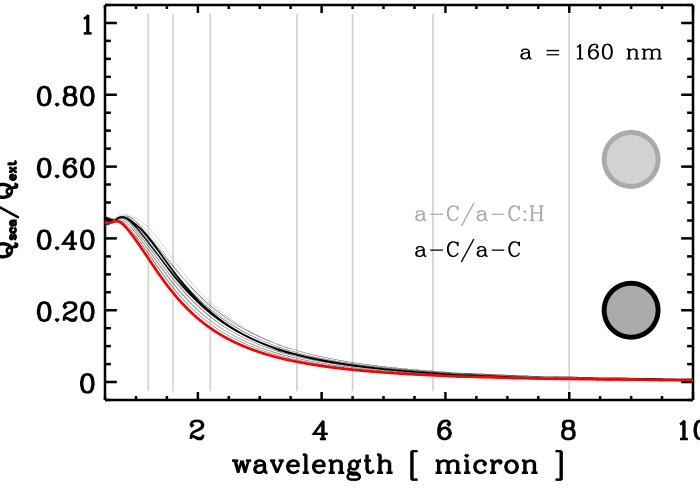
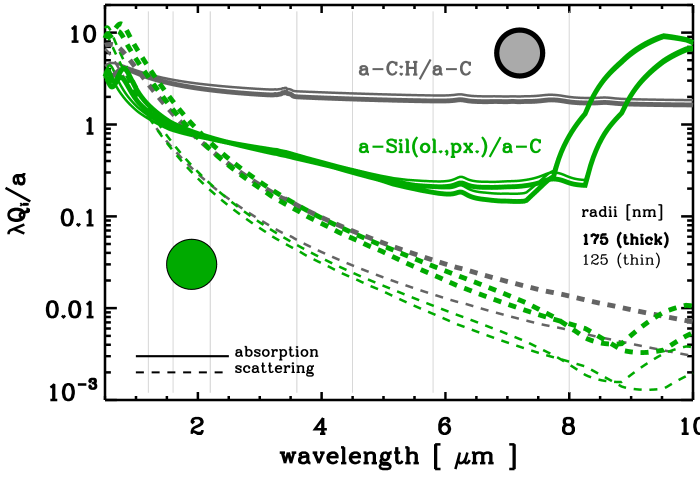
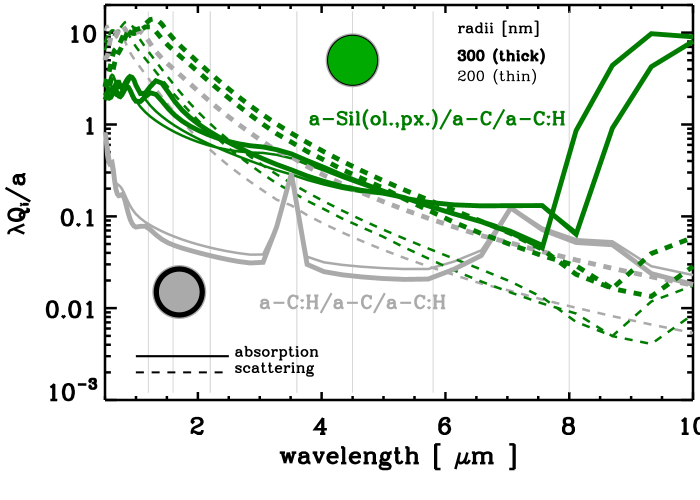
In order to illustrate the underlying effects and to aid our analysis we begin by calculating the optical properties of core/mantle particles using the coated homogeneous sphere Mie routine BHCOAT (Bohren & Huffman 1998). We consider grain cores of amorphous silicate grains, of olivine- and pyroxene-type composition with Fe/FeS nano-inclusions, a-SilFe,FeS (Köhler et al. 2014), and aromatic-rich amorphous carbon grains (Jones 2012c) and, for each core type, we calculate the optical properties as a function of the mantle thickness, , for both a-C ( eV) and a-C:H ( eV) mantles.
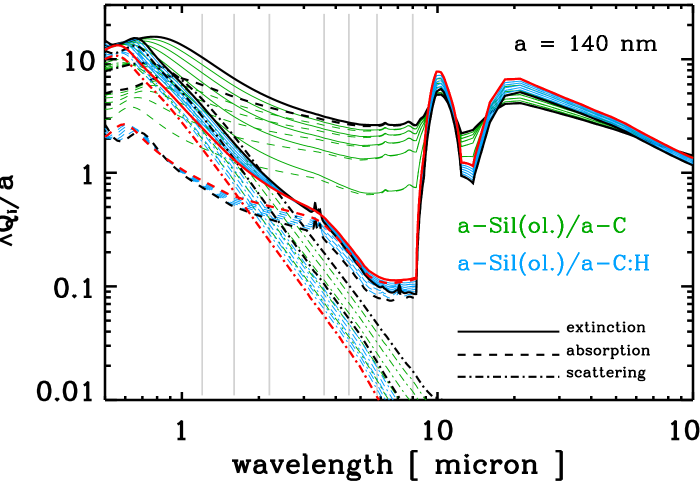
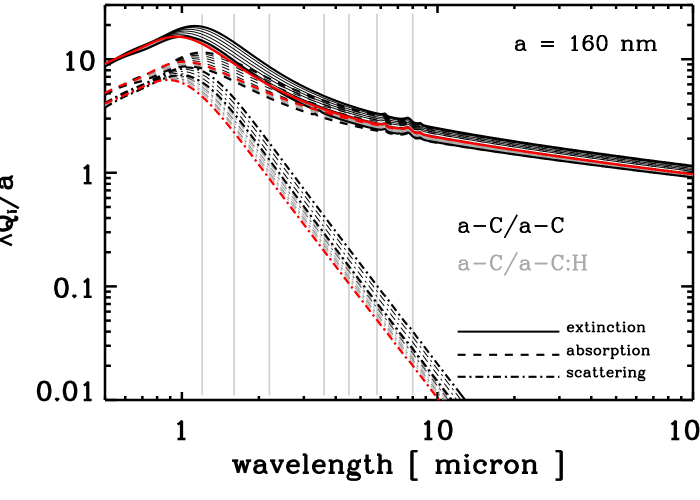
In Fig. 5 we show the core/mantle grain extinction efficiency factors (for ext, sca and abs) plotted as , where is the grain radius, for a-C and a-C:H mantled olivine-type a-SilFe,FeS cores (upper panel) and a-C cores (lower panel) as a function of the mantle depth, ; the red lines show the data for the bare cores. This figure clearly shows that strongly-absorbing a-C mantles on weakly-absorbing cores (e.g., a-SilFe,FeS) significantly increase the absorption in the m region, while little affecting the scattering properties. However, adding grain mass in the form of weakly-absorbing a-C:H mantles leads to only small changes in the optical properties right across the spectrum (m). In fact, the addition of a-C:H mantles increases but decreases at these wavelengths. The net result is that increases (decreases) for m (m).666The data for pyroxene-type cores with Fe/FeS nano-inclusions are very similar to those for olivine-type cores (see Fig. 12, Appendix A). The effects of both a-C and a-C:H mantles on strongly-absorbing grain cores (e.g., a-C) are much less marked (see Fig. 5, lower panel).
We find that a-C mantles lead to a slight decrease in the albedo (/), while a-C:H mantles on the contrary lead to a slight increase in the albedo (see Fig. 13, Appendix A).
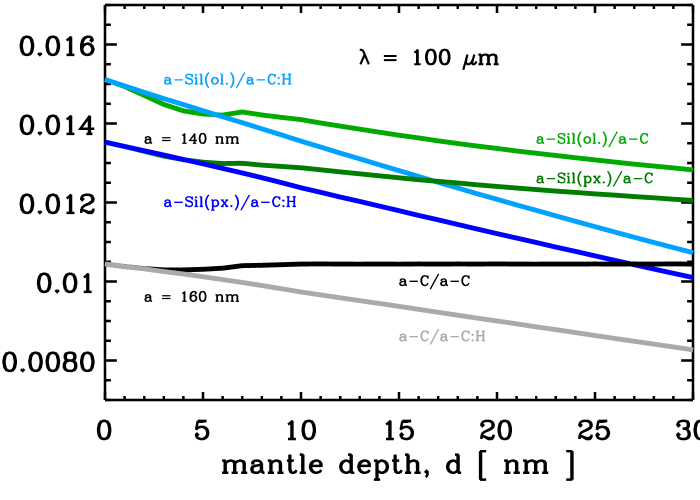
At long wavelengths adding mantles of the same material onto grain cores, i.e., increasing the grain size for a homogeneous grain, leads to the expected constancy of . This behaviour is seen for a-C mantles on a-C cores for mantle depths nm777For mantle thicknesses nm the non-horizontal behaviour is due to an increase in the effective band gap at small dimensions, see Jones (2012c), i.e., the mantle material band gap is eV and the grains are core/mantle and no longer homogeneous. (the horizontal black line in Fig. 6).All other core/mantle combinations do not follow the same constant behaviour because the grains are not homogeneous, i.e., the core and mantle optical properties differ; we return to this key point below.
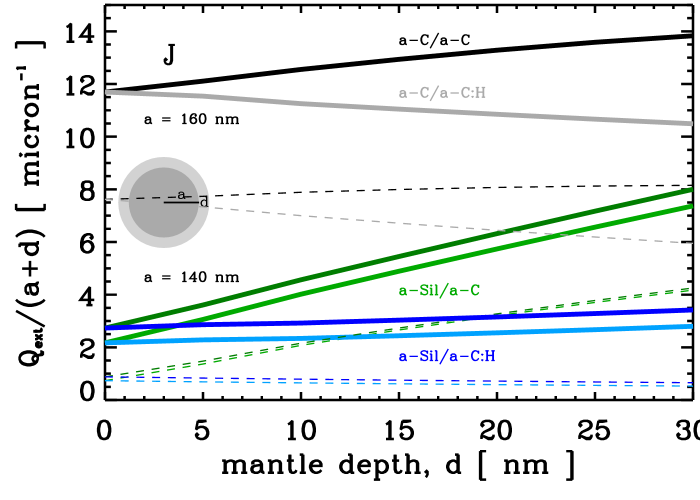
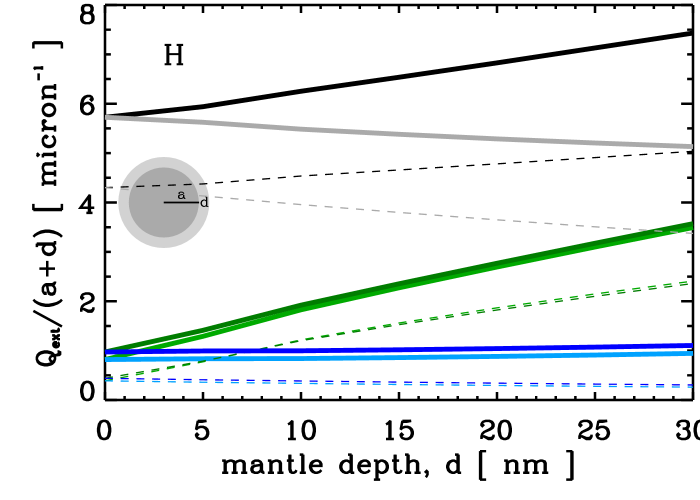
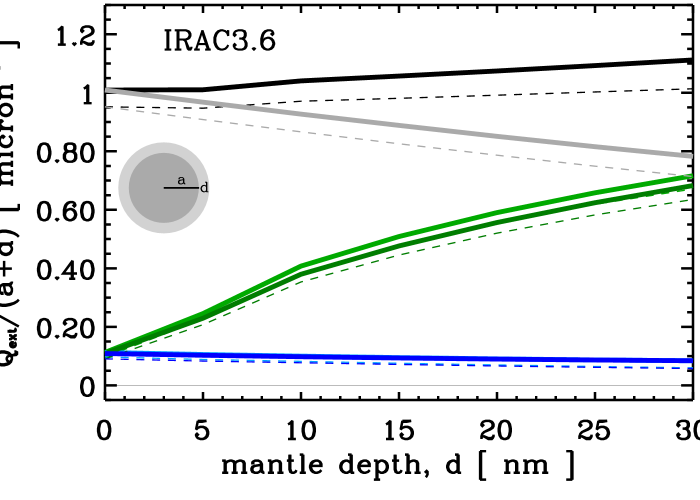
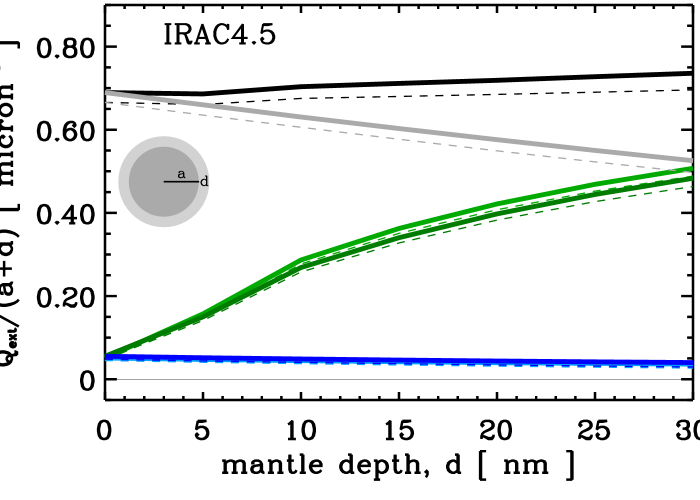
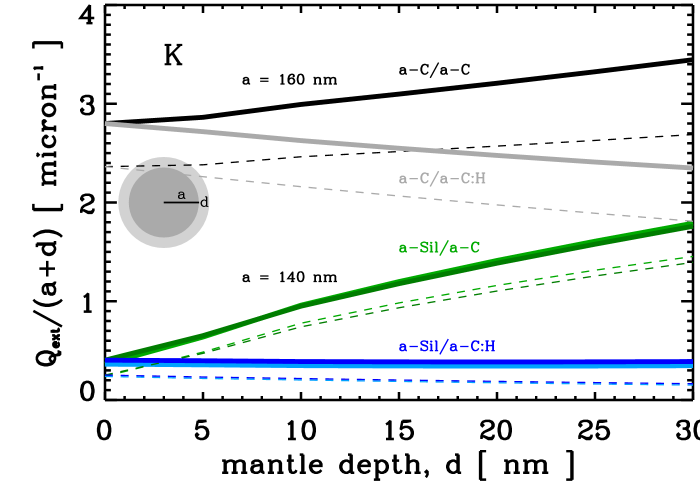
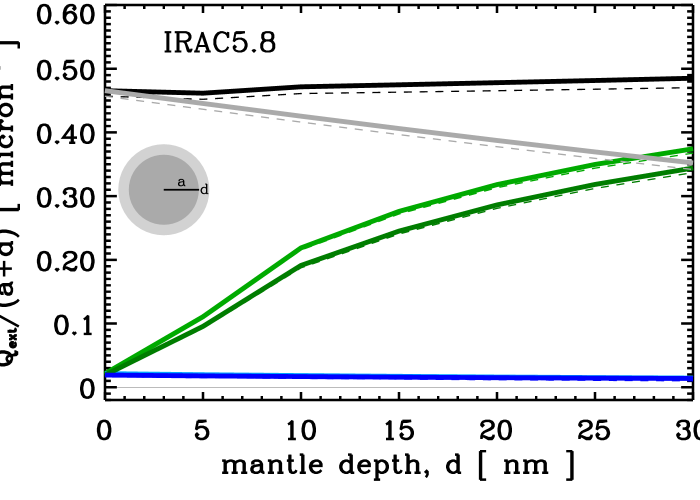
In the C-shine wavelength regime (m) is not independent of and in Figs. 7 and 8 we show the predicted vs. mantle depth, , behaviour at the photometric K and IRAC 5.8 m bands for olivine- and pyroxene type a-SilFe,FeS and a-C grain cores with a-C and a-C:H mantles. The first thing to note in these figures is that the addition of absorbing a-C mantles on all grain core types leads to an increase in as increases.888The ‘knee’ in the data for a mantle thickness nm is due to the larger effective band gap (see the above footnote). Secondly, the addition of a-C:H mantles on a-SilFe,FeS cores leads to approximately constant values of , while this ratio actually decreases with increasing for a-C:H mantles on a-C cores. Thirdly, we note that the optical properties of these materials in the K and IRAC 5.8 m bands are not due to pure absorption, an effect that is more pronounced in the K band data.999The data for the photometric J and H bands and the IRAC 3.6, 4.5 and 8 m bands follow the same trends as for the K and IRAC 5.8 m bands (see Fig. 14, Appendix A).
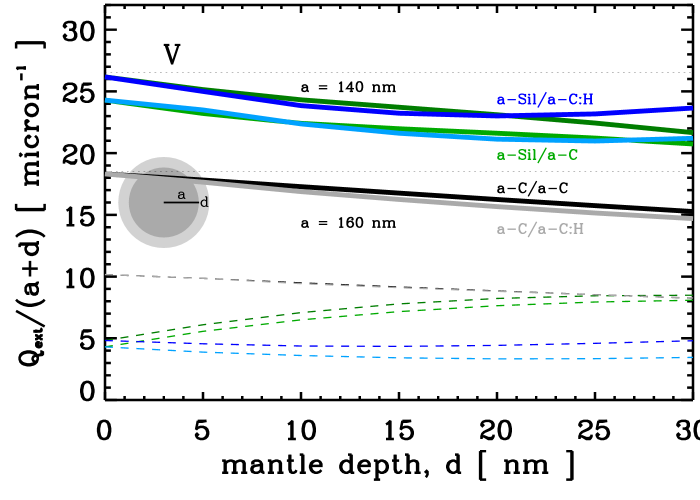
In Fig. 9 we show the effects of a-C and a-C:H mantles on grains in the visible (V band). Here we see that, for all mantle and core material combinations, the extinction cross-sections decrease slightly with increasing particle radius, i.e., with increasing dust mass.
These data therefore reveal a rather counter-intuitive scenario where adding an a-C:H mantle onto dust (i.e., adding dust mass) actually leads to no change or even a decrease in the dust extinction cross-sections in the V band and in the m wavelength region, which are accompanied by an increase in the dust albedo. This strange behaviour is a direct consequence of the optical properties of wide band gap, amorphous, semiconducting a-C:H solids.
3.2 Towards a more realistic dust evolution model: THEMIS
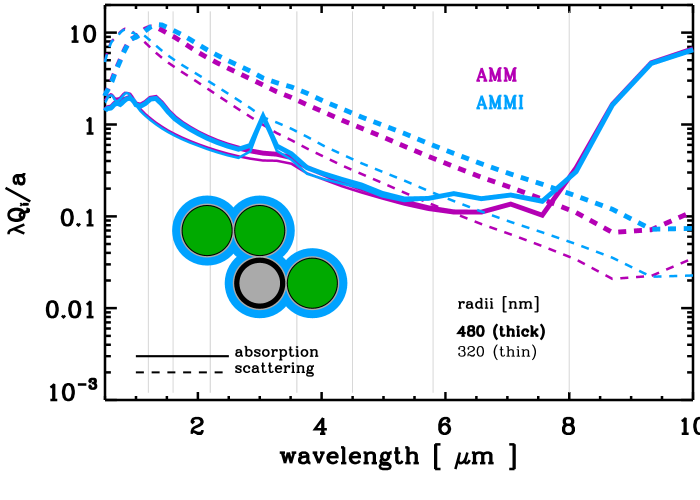
Here we investigate mantle effects within the framework of the multi-component and aggregate grains (consisting of a-SilFe,FeS, a-C and a-C:H materials), with more complex, physically-realistic grain structures. In this case the optical properties are calculated using the discrete-dipole approximation (DDA) method (Draine & Flatau 2000) as per Köhler et al. (2011, 2012, 2014, 2015). As per Köhler et al. (2015) we consider the following grain and aggregate structures:
-
•
CM: core/mantle a-Sil and a-C:H cores with a-C mantles
-
•
CMM: core/mantle/mantle a-Sil and a-C:H cores with
inner a-C and outer a-C:H mantles -
•
AMM: aggregates of CMM grains, and
-
•
AMMI: aggregates of CMM grains with water ice mantles.
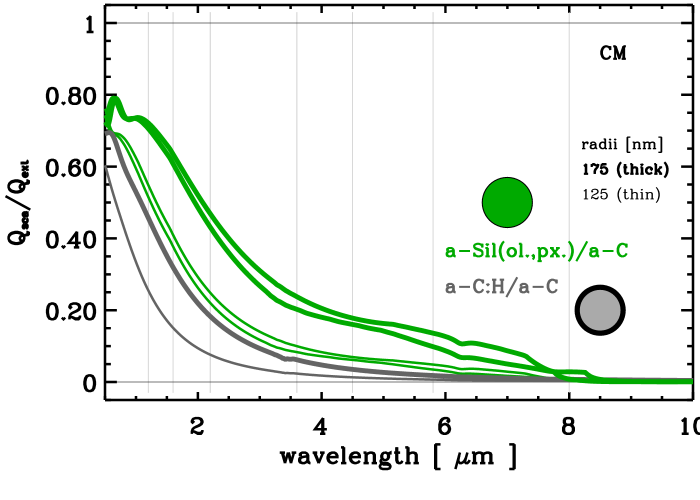
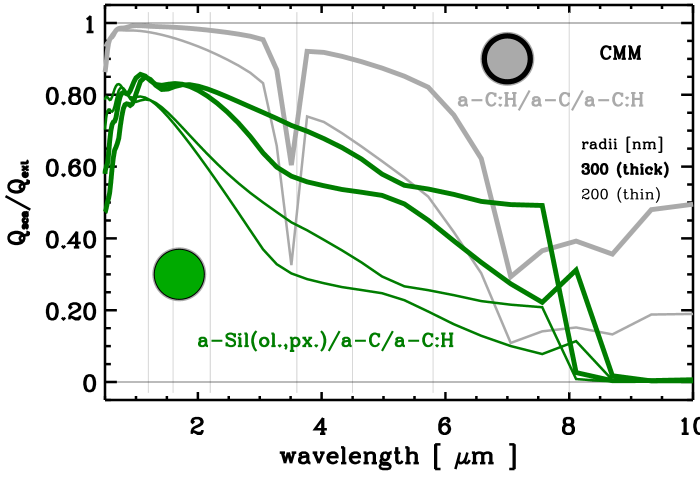
In general, the complexity of the dust composition and structure increases with increasing density along the sequence CM CMM AMM AMMI. The THEMIS albedos are shown in Fig. 10, plotted as , for grain radii near the mass distribution peaks for the CM (upper panel), CMM (middle panel), and AMM and AMMI (lower panel) grains. We note that the addition of a-C:H mantles in the CM CMM transition leads to enhanced scattering, especially in the case of the aC:H/a-C/a-C:H CMM grains (grey lines in the middle panel). These effects become compounded when the CMM grains are coagulated into aggregates (lower panel). We find that the condition for CM grains occurs only in the m region, whereas for CMM (AMM/AMMI) grains this occurs for m (m) as shown in more detail in Fig. 16 in Appendix A.
In Fig. 11 we show the THEMIS albedos (for the full size distributions of CM, CMM, AMM and AMMI grains, Köhler et al. 2015) compared with the available observational data for dark clouds (red and blue data points) and the diffuse galactic light (DGL, black data points). From these data we note that the CMM, AMM and AMMI models are consistent with the NIR dust albedos (J, H and K, Lehtinen & Mattila 1996) and the visible UV albedos (m-1, Mattila 1970b, a; Morgan 1980) for dark clouds (red and blue data points), while the standard diffuse ISM model matches the DGL data more closely. At shorter wavelengths ( nm) there appears to be an inherently greater spread in the observed albedos. The THEMIS albedos for CM, CMM, AMM and AMMI grains cover approximately this same range. However, the number of albedo determinations is limited because the measurements are fraught with difficulty and the uncertainties are therefore generally rather large. We note that the most recent of the albedo determinations shown in Fig. 11 are almost 20 years old.
We have also investigated the effects of coagulating CM grains into aggregates and find that their optical properties (absorption, scattering, albedo etc.) lie closer to those of the CM grains than either the CMM or AMM/AMMI grains. Hence, the coagulation of CM grains into aggregates results in optical properties that are not compatible with the observed evolution of the dust properties in the diffuse to dense cloud transition (Köhler et al. 2015).
4 Astrophysical implications and consequences
The dust evolution processes that we have explored here and elsewhere (e.g., Jones et al. 2013, 2014; Köhler et al. 2014; Ysard et al. 2015; Köhler et al. 2015, etc.), would appear to have some important consequences and wider implications for dust and dust-related chemistry in the diffuse to dense cloud transition.
As discussed by Jones et al. (2013, 2014), carbon accretion and the formation of a-C(:H) mantles appears to be consistent with the observed carbon depletion and allied variations in the extinction curve (Parvathi et al. 2012; Jones et al. 2013). It now appears that carbon could be more abundant in the ISM than previously assumed (e.g., ppm, Parvathi et al. 2012), which if we assume that ppm are in dust in the diffuse ISM (Jones et al. 2013; Ysard et al. 2015) would leave ppm in the gas in the form of CO (and other molecules) and available for carbonaceous mantle formation in the transition from the diffuse ISM to denser regions (Köhler et al. 2015). This is consistent with dust evolution in the outer regions of dense clouds, through a-C:H mantle formation and small grain coagulation onto larger grains, resulting in extinction that is characterised by a weak UV bump and a steep rise in the FUV extinction, (c.f., the HD 207198 line of sight; Parvathi et al. 2012).
Grain surface-driven chemistry and ice accretion have a long and intertwined history. Our work indicates that the surface chemistry in denser interstellar regions (in the absence of icy mantles) probably occurs on a-C:H surfaces that could perhaps play an active role in the chemistry. Thus, the nature of the surface chemistry and molecule formation in translucent regions of the ISM may need to be carefully re-evaluated.
The addition of dust mass via the formation of aliphatic-rich mantles leads to no change in, or even a decrease in, the dust extinction cross-section for large ( nm) grains at wavelengths m. The J, H and K photometric band and Spitzer-IRAC observations are often used to characterise dust at these near-IR wavelengths. In particular the K band is generally the extinction reference normalisation of choice for low extinction and molecular clouds regions. Our results suggest that extreme caution should be exercised in the derivation of any dust sizes and masses from the shape and absolute values of J-, H- or K-normalised near-IR extinction data. Additionally, in translucent clouds the value of derived by extrapolation from J, H and K photometric data is likely to be unreliable.
5 Conclusions
We propose that, within the framework of our THEMIS dust modelling approach, the C-shine observations (cloud- and core-shine) are likely due to the combined effects of aliphatic-rich (i.e., wide band gap a-C:H) hydrocarbon mantle formation and dust coagulation in the diffuse to dense ISM transition. These dust mass- and size-increasing processes lead to a decrease in dust extinction (absorption) cross-section and therefore a net increase in dust albedo because the dust scattering properties are not significantly affected. The counter-intuitive combination of decreased extinction (absorption) with increased dust size and mass is a peculiarity of the optical properties of a-C:H materials. This effect is due to the very low absorptive index, , but relatively high real part, , of the complex index of refraction, , of the a-C:H mantle materials in the visible-IR region. This results in weak IR absorption but normal scattering by the a-C:H-mantled aggregates.
Our results show that B and V band photometric observations of the dust properties in translucent clouds qualitatively track the dust behaviour at FIR wavelengths. However, we find that the same dust will present significantly different trends in the J, H and K photometric bands. Thus, while the J, H and K data are self-consistent, they can show opposite or no trends with the visible extinction and dust emission properties. Thus, the de-coupling of the dust optical properties at the B and V band and FIR wavelengths from those at the J, H and K band wavelengths, due to aliphatic mantle formation, implies that any derivation of , dust sizes and masses from J, H and K photometric band data is likely to be problematic and will need to be carefully re-considered in much greater detail than has been possible here.
In the companion paper (paper II) we couple our THEMIS dust evolution modelling to radiative transfer calculations and compare the results with the observational data.
Acknowledgements.
We thank the referee for critical remarks that helped to improve the manuscript. This research was, in part, made possible through the EU FP7 funded project DustPedia (Grant No. 606847).References
- Andersen et al. (2013) Andersen, M., Steinacker, J., Thi, W.-F., et al. 2013, A&A, 559, A60
- Anderson (1958) Anderson, P. W. 1958, Phys. Rev., 109, 1492
- Bocchio et al. (2014) Bocchio, M., Jones, A. P., & Slavin, J. D. 2014, A&A, 570, A32
- Bocchio et al. (2013) Bocchio, M., Jones, A. P., Verstraete, L., et al. 2013, A&A, 556, A6
- Bocchio et al. (2012) Bocchio, M., Micelotta, E. R., Gautier, A.-L., & Jones, A. P. 2012, A&A, 545, A124
- Bohren & Huffman (1998) Bohren, C. F. & Huffman, D. R. 1998, Absorption and Scattering of Light by Small Particles (Wiley and Sons: New York – Chichester – Brisbane – Toronto – Singapore)
- Cecchi-Pestellini et al. (2014a) Cecchi-Pestellini, C., Casu, S., Mulas, G., & Zonca, A. 2014a, ApJ, 785, 41
- Cecchi-Pestellini et al. (2014b) Cecchi-Pestellini, C., Viti, S., & Williams, D. A. 2014b, ApJ, 788, 100
- Chiar et al. (2013) Chiar, J. E., Tielens, A. G. G. M., Adamson, A. J., & Ricca, A. 2013, ApJ, 770, 78
- Draine & Flatau (2000) Draine, B. T. & Flatau, P. J. 2000, DDSCAT: The discrete dipole approximation for scattering and absorption of light by irregular particles, Astrophysics Source Code Library
- Fanciullo et al. (2015) Fanciullo, L., Guillet, V., Aniano, G., et al. 2015, A&A, 000, 000
- Foster & Goodman (2006) Foster, J. B. & Goodman, A. A. 2006, ApJ, 636, L105
- Godard et al. (2011) Godard, M., Féraud, G., Chabot, M., et al. 2011, A&A, 529, A146+
- Henyey & Greenstein (1941) Henyey, L. G. & Greenstein, J. L. 1941, ApJ, 93, 70
- Hurwitz et al. (1991) Hurwitz, M., Bowyer, S., & Martin, C. 1991, ApJ, 372, 167
- Jones (2012a) Jones, A. P. 2012a, A&A, 540, A1
- Jones (2012b) Jones, A. P. 2012b, A&A, 540, A2 (545, C2)
- Jones (2012c) Jones, A. P. 2012c, A&A, 542, A98 (545, C3)
- Jones (2013) Jones, A. P. 2013, A&A, 555, A39
- Jones (2014) Jones, A. P. 2014, Planet. Space Sci., 100, 26
- Jones et al. (1990) Jones, A. P., Duley, W. W., & Williams, D. A. 1990, QJRAS, 31, 567
- Jones et al. (2013) Jones, A. P., Fanciullo, L., Köhler, M., et al. 2013, A&A, 558, A62
- Jones & Habart (2015) Jones, A. P. & Habart, E. 2015, A&A, 581, A92
- Jones et al. (2016) Jones, A. P., Köhler, M., Ysard, N., Bocchio, M., & Verstraete, L. 2016, in preparation.
- Jones et al. (2014) Jones, A. P., Ysard, N., Köhler, M., et al. 2014, RSC Faraday Discuss., 168, 313
- Köhler et al. (2011) Köhler, M., Guillet, V., & Jones, A. 2011, A&A, 528, A96
- Köhler et al. (2014) Köhler, M., Jones, A., & Ysard, N. 2014, A&A, 565, L9
- Köhler et al. (2012) Köhler, M., Stepnik, B., Jones, A. P., et al. 2012, A&A, 548, A61
- Köhler et al. (2015) Köhler, M., Ysard, N., & Jones, A. 2015, A&A, 579, A15
- Laureijs et al. (1987) Laureijs, R. J., Mattila, K., & Schnur, G. 1987, A&A, 184, 269
- Lehtinen & Mattila (1996) Lehtinen, K. & Mattila, K. 1996, A&A, 309, 570
- Lillie & Witt (1976) Lillie, C. F. & Witt, A. N. 1976, ApJ, 208, 64
- Mattila (1970a) Mattila, K. 1970a, A&A, 9, 53
- Mattila (1970b) Mattila, K. 1970b, A&A, 8, 273
- Mennella et al. (2002) Mennella, V., Brucato, J. R., Colangeli, L., & Palumbo, P. 2002, ApJ, 569, 531
- Micelotta et al. (2012) Micelotta, E. R., Jones, A. P., Cami, J., et al. 2012, ApJ, 761, 35
- Micelotta et al. (2010a) Micelotta, E. R., Jones, A. P., & Tielens, A. G. G. M. 2010a, A&A, 510, A37
- Micelotta et al. (2010b) Micelotta, E. R., Jones, A. P., & Tielens, A. G. G. M. 2010b, A&A, 510, A36
- Morgan (1980) Morgan, D. H. 1980, MNRAS, 190, 825
- Morgan et al. (1976) Morgan, D. H., Nandy, K., & Thompson, G. I. 1976, MNRAS, 177, 531
- Padoan et al. (2006) Padoan, P., Juvela, M., & Pelkonen, V.-M. 2006, ApJ, 636, L101
- Parvathi et al. (2012) Parvathi, V. S., Sofia, U. J., Murthy, J., & Babu, B. R. S. 2012, ApJ, 760, 36
- Pendleton & Allamandola (2002) Pendleton, Y. J. & Allamandola, L. J. 2002, ApJS, 138, 75
- Robertson (1986) Robertson, J. 1986, Advances in Physics, 35, 317
- Steinacker et al. (2010) Steinacker, J., Pagani, L., Bacmann, A., & Guieu, S. 2010, A&A, 511, A9+
- Struve (1937) Struve, O. 1937, ApJ, 85, 194
- Struve & Elvey (1936) Struve, O. & Elvey, C. T. 1936, ApJ, 83, 162
- Wiersma et al. (1997) Wiersma, D. S., Bartolini, P., Lagendijk, A., & Righini, R. 1997, Nature, 390, 671
- Witt (1968) Witt, A. N. 1968, ApJ, 152, 59
- Witt et al. (1997) Witt, A. N., Friedmann, B. C., & Sasseen, T. P. 1997, ApJ, 481, 809
- Witt et al. (1994) Witt, A. N., Lindell, R. S., Block, D. L., & Evans, R. 1994, ApJ, 427, 227
- Ysard et al. (2015) Ysard, N., Köhler, M., Jones, A., et al. 2015, A&A, 577, A110
Appendix A Additional supporting figures
Here we provide the additional figures that are refereed to in the main body of the text. In particular, Fig. 16 shows that for the CM grains scattering exceeds absorption in the m region. However, for CMM grains scattering exceeds absorption out to longer wavelengths, i.e., m, and out to even longer wavelengths for the AMM/AMMI particles (m).