Computational studies on the behaviour of anionic and nonionic surfactants at the SiO2 (silicon dioxide)/water interface
Abstract
Molecular dynamics simulations to study the behaviour of anionic (Sodium Dodecylsulfate, SDS) and nonionic (Monooleate of Sorbitan, SPAN80) surfactants close to a SiO2 (silicon dioxide) surface were carried out. Simulations showed that a water layer was first adsorbed on the surface and then the surfactants were attached on that layer. Moreover, it was observed that water behaviour close to the surface influenced the surfactant adsorption since a semi-spherical micelle was formed on the SiO2 surface with SDS molecules whereas a cylindrical micelle was formed with SPAN80 molecules. Adsorption of the micelles was conducted in terms of structural properties (density profiles and angular distributions) and dynamical behaviour (diffusion coefficients) of the systems. Finally, it was also shown that some water molecules moved inside the solid surface and located at specific sites of the solid surface.
Key words: computer simulations, SDS surfactant, SPAN80 surfactant, adsorption, Cristobalite
PACS: 68.08De, 68.43.Hm, 68.43.Jk
Abstract
Виконано моделювання поведiнки анiонних (додецилсульфат натрiю, SDS) та неiонних (монолеат сорбiтану, SPAN80) сурфактантiв поблизу поверхнi SiO2 (двооксиду кремнiю) методом молекулярної динамiки. Спостерiгаємо, що шар води спочатку адсорбується на поверхнi, а тодi сурфактанти приєднуються до цього шару. Бiльш того, спостережено, що поведiнка води поблизу поверхнi впливає на адсорбцiю суфрактантiв, оскiльки напiв-сферична мiцела утворюється на поверхнi SiO2 з SDS молекулами, в той час, як цилiндрична мiцела формується у випадку молекул SPAN80. Адсорбцiя мiцел описана структурними властивостями (профiлi густини i кутовi розподiли), а також i в термiнах коефiцiєнтiв дифузiї. Показано, що деякi молекули води проникають всередину твердої поверхнi.
Ключовi слова: комп’ютерне моделювання, SDS сурфактант, SPAN80 сурфактант, адсорбцiя, кристобалiт
1 Introduction
Adsorption of surfactant molecules at solid-liquid interfaces has been investigated for years not only for its relevance in science but also for its numerous industrial applications, such as detergency, crude oil refining, treatment of waste water, adsorption on activated charcoal and even in pharmaceutical preparations [1, 2, 3].
In particular, self-assembly of surfactant molecules on solid surfaces has shown different issues from those observed at liquid/vapor and at liquid/liquid interfaces. For instance, it has been observed that interactions between hydrophobic tails, repulsions between headgroups and interactions between surfactant molecules with solid surface [4, 5] could change the isotherms at the critic micellar concentration (CMC). Therefore, studies of surfactant aggregation will help us to obtain more physical insights of self-assembly phenomena [6, 7].
From the experimental point of view, the surfactant adsorption on surfaces has been studied by different techniques, such as streaming potential methods [8], calorimetry [9], neutron reflection [10], ellipsometry [11], fluorescence spectroscopy [12] and atomic force microscopy (AFM) [13]. In fact, AFM has proved to be a reliable technique to obtain information on the topology of surfactant aggregation since it allows us to observe how surfactants are formed on surfaces. For instance, CTAB arrays in parallel stripes on a graphite surface [14], SDS forms hemimicelles on a rough gold surface [15] and similar morphologies have been seen for other surfactants on hydrophobic surfaces [16, 17, 18].
On the other hand, computer simulations have been very useful to study such complex systems. For instance, Monte Carlo simulations have been used to provide information on structural transitions of surfactant aggregation [19] while molecular dynamics simulations have been used to investigate aggregation at atomistic scales [20, 21]. In previous papers we have reported the surfactant behaviour on different surfaces [21, 22, 23, 24]. It has been observed how graphite surfaces impose orientational order on the surfactant tails [21, 24] and how different solid faces of a titanium dioxide produced different aggregates on the surface [22, 23]. In the present work we are interested to extend the studies of surfactant aggregation on a hydrophilic SiO2 (silicon dioxide) surface in order to compare the behaviour of surfactant molecules on different solid substrates.
2 Computational method and model
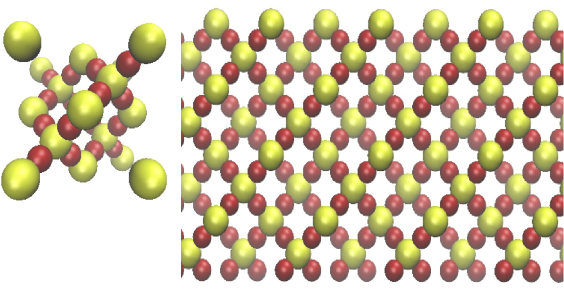
Molecular dynamics simulations of anionic and nonionic surfactant molecules at silicon dioxide surface (SiO2), in its Cristobalite form, were carried out for the present study. The surface was constructed using an atomistic model with a surface orientation (001) (figure 1). The parameters used for a solid surface were taken from reference [25].
For the anionic surfactant molecule, sodium dodecyl sulfate (SDS), a model of 12 united carbon atoms attached to a headgroup (SO4) was simulated by using a force field already reported in the literature [21]. For the nonionic surfactant molecule, Monooleate of Sorbitan (SPAN80), there was used, a model with 17 united carbon atoms, three OH- and one ester groups in the head group. The force field reported in reference [23] was used for this molecule.
In the case of simulations with the anionic molecules, the initial configuration was prepared from a monolayer of 36 molecules in all-trans-configuration with the headgroups initially pointed to the solid surface. Then, 2535 water molecules were added (using the SPC model [26]) to the system and 36 sodium cations (Na+). In the case of simulations with nonionic molecules, 25 molecules were used with the same number of water molecules.
A simulation box having dimensions and Å was used with the usual periodic boundary conditions. The -dimension of the box was long enough to prevent the formation of a second water/solid interface due to the periodicity of the system. Instead, a liquid/vapor interface was present at one end of the box () whereas at the other end of the box () beyond the solid there was an empty space. All simulations were carried out in the NVT ensemble with a time step of 0.002 ps using DL-POLY package [27]. Bond lengths were constrained using SHAKE algorithm with a tolerance of , and the temperature was controlled using the Hoover-Nose thermostat having a relaxation time of 0.2 ps [28] at K. Long-range electrostatic interactions were handled using the Particle Mesh Ewald method, and the Van der Waals interactions were cut off at 10 Å. Finally, the simulations were run up to 40 ns and configurational energy was monitored as a function of time in order to determine the moment the systems have reached equilibrium. Then, the last 2 ns were collected for analysis.
3 Results
In this section we present calculations of the surfactant molecules at the SiO2 surface. Studies on the behaviour of the surfactant molecules and how they aggregate at the liquid/solid interface are discussed.
3.1 Density profiles
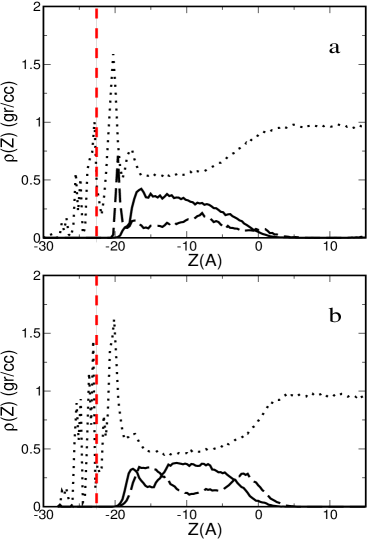
In order to determine where the surfactant molecules arrayed in the system, mass -dependent density profiles for the headgroups and the tails were calculated, i.e., normal to the liquid/solid interface.
From figure 2 we observed that water molecules (dotted line) were not only adsorbed but also absorbed by the solid surface which is located at a position of Å in the figure. In fact, the first water profile peak (to the right of the surface) indicated strong adsorption, i.e., a water layer on the surface. The other water peaks (to the left of the surface) suggested that few particles were inside the solid surface. The presence of water molecules inside SiO2 surfaces has been also observed in real experiments [29, 30]. On the other hand, SDS density profiles showed a strong first peak for the polar group ( Å from the surface in figure 2 (a) suggesting that the surfactant was well adsorbed on the surface. Moreover, it was noted that the peak was located to the right of the adsorbed water layer. The result showed that the surfactant molecules formed a micellar structure adsorbed on the water layer on the solid surface. It was also possible to observe that the hydrocarbon chains (solid line) were sited between polar-groups (dashed line) along direction.
In the case of simulations with SPAN80 molecules [figure 2 (b)], the water density profile also showed that some of those molecules went deep into the substrate. Besides, unlike SDS system, here strong peaks were observed for the water profiles. The SPAN80 profiles are also shown, the first peak ( Å from the surface) corresponded to the hydrocarbon chains and it was very close to the polar group, nevertheless the hydrocarbon chains were surrounded by the polar groups. These profiles suggested the formation of a micelle on the surface.
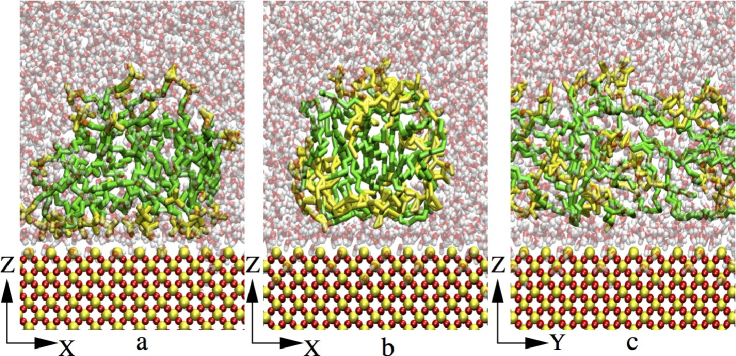
In figure 3, snapshots of the final SDS [figure 3 (a)] and SPAN80 [figures 3 (b) and 3 (c)] are shown. In those figures it was possible to observe the micellar structure mentioned above. In the case of the SDS, the micelle structure had a spherical-like shape (snapshot in and looked alike) whereas for SPAN80 the micelle had a cylindrical-like structure [see figures 3 (b) and 3 (c)].
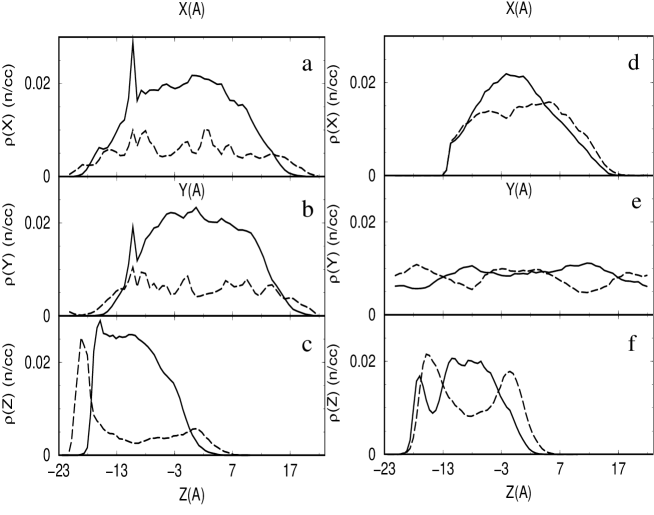
In order to verify the structure of the micelles on the surfaces, particle density profiles in the other two directions, and , were calculated. In figures 4 (a) and 4 (b), head groups density profiles (dashed line) and tail groups (solid line) of SDS molecules are shown. There were observed similarities between the two particle profiles, and , where it was noted that polar groups surrounded the tail groups. In both tail group profiles, a small sharp peak can be seen. In this case, SDS molecules are well adsorbed on the SiO2 substrate with some surfactants attached on the surface by the head group [see figure 3 (a)]. Then, there is a possibility that a SDS molecule could remain anchored with its tail moving in one region only. This could explain the small sharp peak observed in both profiles, i.e., there are a bit more tail groups in that region. On the other hand, from the -particle density profile in figure 4 (c), a big head group peak could be seen close to the solid surface (see also figure 2), i.e., there was an excess of head groups attached to the surface. Moreover, the indicated that the size of the micelle in the -direction was smaller than in the directions. Therefore, the structure can be described as a sphere deformed along the perpendicular direction of the solid surface.
This calculation was also carried out for the SPAN80 molecules [figures 4 (d)–4 (f)]. In figure 4 (d), the density profile along -axis is shown where a molecular aggregation is observed. In figure 4 (e), the profiles indicated a uniform distribution of the molecules along the -axis whereas in figure 4 (f) it was again possible to observe aggregation of the molecules next to the surface. Here, it can be seen that headgroups partially surrounded the tail groups. Then, these profiles revealed that the molecules structured themselves as a cylindrical micelle along the direction. These results suggested that the effect of the solid surface in the micelle formation was minimum.
3.2 Water orientation at the SiO2 surface
As it was observed above, water density profiles showed strong peaks close to the SiO2 surface suggesting that those molecules might have some structure close to the solid. Therefore, studies of how water molecules were oriented in the solid were carried out. The analyses were conducted over the molecules in the adsorbed layers only (defined by the peaks of figure 2).
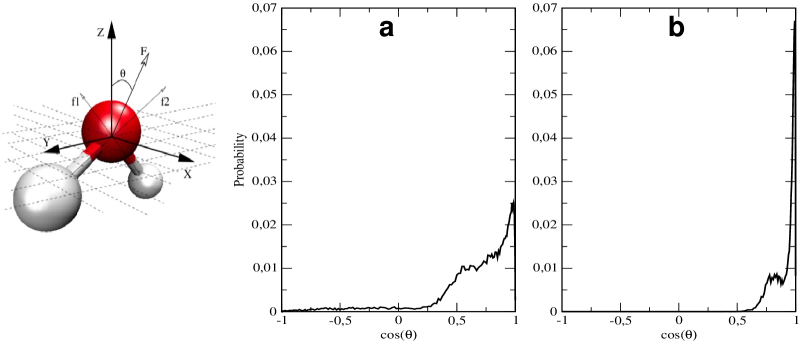
In figure 5, angular distributions of water molecules are shown for the SDS and SPAN80 systems. The orientation of the water molecules was measured as the angle between the bisector vector of the OH bonds and the vector normal to the interface (see figure 5). In both systems, SDS and SPAN80, there was observed a privileged orientation of the water molecules, i.e., they were nearly perpendicular to the surface. In fact, there was noted a larger number of water molecules pointing perpendicular to the surface for the SPAN80 system [high peak in figure 5 (b)] than for the SDS system (small peak). Moreover, the water angle distribution presented a small peak when water interacted with SPAN80 [figure 5 (b)] and a wider distribution when water interacted with SDS.

In figure 6, the distribution (in the first adsorbed water layer) of water molecules in the and directions, i.e., in the plane, is plotted. Figures 6 (a) and 6 (b) show the water oxygens positions in the solid surface for the SDS system. In the same figure 6, the positions of the silicon atoms of the SiO2 surface are also shown in the same directions. In all cases it was observed that water molecules (solid lines) were located only in specific sites. In fact, they were placed on the silicon atoms of the solid surface (indicated by the dashed lines in figure 6). Figures 6 (c) and 6 (d) are the same plots for the SPAN80 system. From the above results we noted that water oxygens were adsorbed above silicon sites.
3.3 Mobility of surfactant molecules
In order to describe the attachment of the surfactant molecules to the solid surface, the diffusion coefficient of the molecular aggregates was also calculated. The diffusion coefficients were calculated in each direction by measuring the square mean displacements of the surfactant atoms and using the Einstein relation. For the SPAN80 surfactant, the diffusions were m2/s, m2/s and m2/s in the , and directions, respectively. For the SDS surfactant, the diffusions were m2/s, m2/s and m2/s in the , and directions, respectively. In both systems, the diffusions in the perpendicular direction (-axis) was lower than in the plane. However, the values for the SPAN80 were higher than for the SDS surfactant, suggesting that the second surfactant had a higher mobility than the first one. It is worthy to mention that these diffusions were much lower than the diffusions found for the same molecules on a Titanium dioxide surface [22, 23].
4 Conclusions and discussion
A series of Molecular Dynamics simulations were carried out in order to describe the behaviour of two different surfactant molecules interacting with a silicon dioxide solid surface. In the case of the anionic surfactant (SDS), there was observed a spherical micelle formation on a layer of water molecules previously adsorbed on the solid. The micelle was described by density profiles and they showed a deformation of the micelle next to the adsorbed layer of water molecules. This deformation can be explained in terms of the SDS charged headgroups interactions with water molecules on the solid surface. On the other hand, the nonionic surfactant (SPAN80) did not show much influence by the solid surface. It formed a cilyndrical micelle next to the adsorbed water layer. In this case, there was observed a thicker water layer between the surfactant and the solid surface. The influence of the surfactant on the surface was characterized by water molecules in the surface. Dipole water orientation, in the solid surface, was more tilted for the SDS molecules than for the SPAN80 suggesting a stronger SDS-surface interaction and consequently more intensive adsorption of those molecules on the surface. Based on the previous results (diffusion coefficients), it was noted that both surfactants showed less affinity with the SiO2 surface than with other surfaces such as graphite and titanium dioxide.
Acknowledgements
HD acknowledges support from DGAPA-UNAM-Mexico and Conacyt-Mexico for sabbatical scholarships. The authors acknowledge support from DGTIC-UNAM for the supercomputer facilities.
References
- [1] Ahmaruzzaman M., Sharma D.K., J. Colloid Interface Sci., 2005, 287, 14; doi:10.1016/j.jcis.2005.01.075.
- [2] Bhatnagar A., Jain A.K., J. Colloid Interface Sci., 2005, 281, 49; doi:10.1016/j.jcis.2004.08.076.
- [3] Polymers in Drug Delivery, Uchegbu I.F., Schtzlein A.G. (Eds.), CRC Press, Boca Raton, 2006.
- [4] Gaudin A.M., Fuerstenau D.W., Trans. Am. Inst. Min. Metall. Pet. Eng., 1955, 202, 66.
- [5] Bhömer M.R., Koopal L.K., Langmuir, 1992, 8, 2649; doi:10.1021/la00047a014.
- [6] Sammalkorpi M., Panagiotopoulos A.Z., Haataja M., J. Phys. Chem. B, 2008, 112, 2915; doi:10.1021/jp077636y.
- [7] Mu G., Li X., J. Colloid Interface Sci., 2005, 289, 184; doi:10.1016/j.jcis.2005.03.061.
- [8] Fuerstenau D.W., J. Phys. Chem., 1956, 60, 981; doi:10.1021/j150541a039.
- [9] Király Z., Findenegg G.H., J. Phys. Chem. B, 1998, 102, 1203; doi:10.1021/jp972218m.
- [10] Penfold J., Staples E.J., Tucker I., Thompson L.J., Langmuir, 1997, 13, 6638; doi:10.1021/la970468o.
- [11] Tiberg F., Joensson B., Lindman B., Langmuir, 1994, 10, 3714; doi:10.1021/la00022a053.
- [12] Chandar P., Somasundaran P., Turro N.J., J. Colloid Interface Sci., 1987, 117, 31; doi:10.1016/0021-9797(87)90165-2.
- [13] Ducker W.A., Wanless E.J., Langmuir, 1996, 12, 5915; doi:10.1021/la9605448.
- [14] Manne S., Cleveland J.P., Gaub H.E., Stucky G.D., Hansma P.K., Langmuir, 1994, 10, 4409; doi:10.1021/la00024a003.
- [15] Schniepp H., Shum H., Saville D., Aksay I., J. Phys. Chem. B, 2007, 111, 8708; doi:10.1021/jp073450n.
- [16] Patrick H.N., Warr G.G., Manne S., Aksay I., Langmuir, 1997, 13, 4349; doi:10.1021/la9702547.
- [17] Jaschke M., Butt H.J., Gaub H.E., Manne S., Langmuir, 1997, 13, 1381; doi:10.1021/la9607767.
- [18] Ducker W.A., Wanless E.J., J. Phys. Chem. B, 1996, 100, 3207; doi:10.1021/jp952439x.
- [19] Zheng F., Zhang X., Wang W., Dong W., Langmuir, 2006, 22, 11214; doi:10.1021/la0622424.
- [20] Shah K., Chiu P., Jain M., Fortes J., Moudgil B., Sinnott S., Langmuir, 2005, 21, 5337; doi:10.1021/la047145u.
- [21] Dominguez H., J. Phys. Chem. B, 2007, 111, 4054; doi:10.1021/jp067768b.
- [22] Núñez-Rojas E., Dominguez H., J. Colloid Interface Sci., 2011, 364, 417; doi:10.1016/j.jcis.2011.08.069.
- [23] Núñez-Rojas E., Dominguez H., Rev. Mex. Fis., 2013, 59, 530.
-
[24]
Aranda-Bravo C.G., Mendez-Bermudez J.G.,
Dominguez H., J. Mol. Liq., 2014, 200, 465;
doi:10.1016/j.molliq.2014.11.023. -
[25]
Dominguez H., Gama Goicoechea A.,
Mendoza N., Alejandre J.,
J. Colloid Interface Sci., 2006, 297, 370;
doi:10.1016/j.jcis.2005.10.020. - [26] Berendsen H.J.C., Grigera J.R., Straatsma T.P., J. Phys. Chem. B, 1987, 91, 6269; doi:10.1021/j100308a038.
- [27] Forester T.R., Smith W., DL-POLY Package of Molecular Simulation, CCLRC, Daresbury Laboratory, Daresbury, Warrington, 1996.
- [28] Hoover W.G., Phys. Rev. A, 1985, 31, 1695; doi:10.1103/PhysRevA.31.1695.
- [29] Elimbi A., Dika J.M., Djangang C.N., J. Mineral. Mat. Charac. Eng., 2014, 2, 484; doi:10.4236/jmmce.2014.25049.
- [30] Keller W.D., Pickett E.E., Am. J. Sci., 1950, 248, 2640273.
Ukrainian \adddialect\l@ukrainian0 \l@ukrainian
Чисельнi дослiдження поведiнки анiонних та неiонних сурфактантiв на границi роздiлу мiж двоокисом кремнiю (SiO2) i водою
E. Нуньєс-Рохас, Г. Домiнгес
Хiмiчний факультет, Автономний унiверситет Метрополiтана-Iцтапалапа, Мехiко, Мексика
Iнститут матерiалознавства, Нацiональний автономний унiверситет Мексики, Мехiко, Мексика