Monsters in the Dark: Predictions for Luminous Galaxies in the Early Universe from the BlueTides Simulation
Abstract
Using deep Hubble and Spitzer observations Oesch et al. (2016) have identified a bright () star forming galaxy candidate at . The presence of GN- implies a number density , roughly an order of magnitude higher than the expected value based on extrapolations from lower redshift. Using the unprecedented volume and high resolution of the BlueTides cosmological hydrodynamical simulation, we study the population of luminous rare objects at . The luminosity function in BlueTides implies an enhanced number of massive galaxies, consistent with the observation of GN-. We find about 30 galaxies at at in the BlueTides volume, including a few objects about 1.5 magnitudes brighter. The probability of observing GN- in the volume probed by Oesch et al. (2016) is per cent. The predicted properties of the rare bright galaxies at in BlueTides closely match those inferred from the observations of GN-. BlueTides predicts a negligible contribution from faint AGN in the observed SED. The enormous increase in volume surveyed by WFIRST will provide observations of galaxies with beyond out to .
1 Introduction
Galaxies at high-redshift can be identified by taking advantage of the strong spectral break caused by neutral hydrogen in the intergalactic medium. By combining observations from Hubble and Spitzer it is possible to extend this technique to and beyond, with the first, albeit small, samples now identified (e.g. Oesch et al. 2012, 2013, 2014, 2015, 2016; Zheng et al. 2012; Ellis et al. 2013; Bouwens et al. 2015, 2016; Zitrin et al. 2014; Ishigaki et al. 2015).
Most recently, Oesch et al. (2016, hereafter O16) identified a single bright () source (GN-) located at based on both a photometric and spectroscopic continuum break. Potential low-redshift contaminants (e.g. passively evolving galaxies or extreme emission line sources) are ruled out at high significance. The presence of such a bright object in the early Universe identified within a relatively small volume is surprising with an inferred density around an order of magnitude larger than extrapolations from lower-redshift.
Theoretical predictions for these early times are lacking, particularly those with the dynamic range to cover both the formation of individual objects and make large scale statistical studies of them. A trend in galaxy formation studies has been to carry out “zoomed” simulations (e.g., Governato et al. 2007; Agertz & Kravtsov 2015, Hopkins et al. 2016), where the full physics algorithms are only brought to bear in very small subvolumes of larger simulations. This approach is well suited to modeling observations in small fields of view, but not when quantitative information on luminosity functions, clustering statistics or abundance of rare objects or phenomena is required. Even the high resolution volumes of the recent cosmological hydrodynamical simulation Illustris (Vogelsberg et al. 2014), EAGLE (Schaye et al. 2015) or MassiveBlackII (Khandai et al. 2015) are not sufficient to probe the high mass/bright end of mass/luminosity function at high redshift.
In this analysis we investigate whether objects like GN- are consistent with those found in BlueTides (Feng et al. 2015, 2016), the only cosmological hydrodynamic simulation so far with sufficient volume, mass and spatial resolution. Our analysis is organized as follows: in Section 2 we briefly introduce the BlueTides simulation. In Section 3 we investigate the predicted volume density of bright sources at very high redshift and ascertain whether the existence of GN- is in tension with the model. In Section 4 we investigate the properties of bright galaxies at very-high redshift. Finally, in Section 6 we present our conclusions.
2 The BlueTides Simulation
The BlueTides simulation (see Feng et al. 2015, 2016 for a full description) was carried out using the Smoothed Particle Hydrodynamics code MP-Gadget with particles using the Blue Waters system at the National Center for Supercomputing Applications. The simulation evolved a cube to by which time it contained approximately 200 million objects (of which 160,000 have stellar masses greater than ). At the number of objects identified falls to around 20 million, and only around 700 have stellar masses greater than . The galaxy stellar mass and rest-frame UV luminosity functions predicted by the simulation (see Feng et al. 2016; Wilkins et al. 2016) match observational constraints available at (e.g. Bouwens, Oesch, Labbe 2015a; Song, Finkelstein, Ashby 2015).
Galaxy spectral energy distributions (SED) were calculated by coupling the simulation with the Pegase (Fioc & Rocca-Volmerange 1997) stellar population synthesis (SPS) model assuming a Chabrier (2003) initial mass function (IMF) combined with reprocessing by both gas and dust (see Wilkins et al., 2016 for details).
3 Luminosity Function and Volume Density
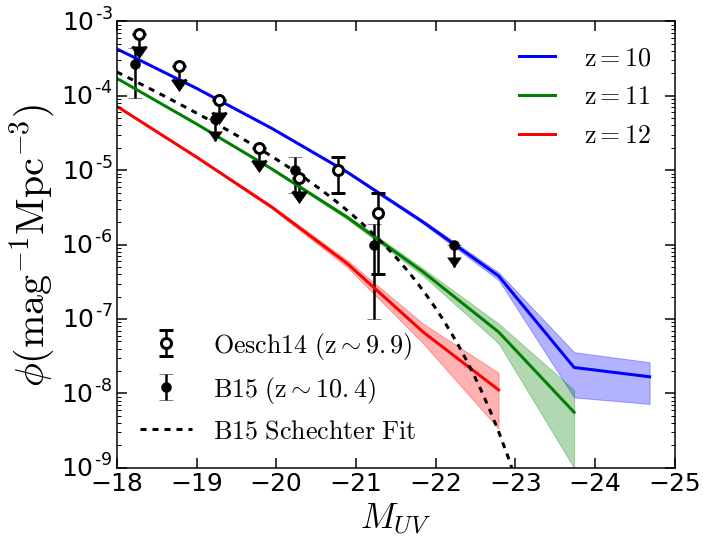
We begin by investigating the predicted luminosity function of galaxies at . In Figure 1 we present the intrinsic rest-frame UV LF of galaxies at . The intrinsic rest-frame UV luminosities, and thus the model expectations, are sensitive to various assumptions including the choice of IMF, SPS model, and Lyman continuum escape fraction. The impact of these assumptions on the SED of galaxies at high-redshift are explored in detail in Wilkins et al. (2016). Figure 1 shows that observational constraints at from Bouwens et al. (2015a) and Oesch et al. (2015) are consistent with these predictions, largely lying between the and lines.
We also show (as a dashed line) the Bouwens et al. (2015a) Schechter fit to the observed LF at . For galaxies brighter than , the fit is currently unconstrained by observational data. BlueTides predicts a significantly larger number of objects than the extrapolation of the B15 fit into the bright end. By interpolating between the and curves we find that at This enhancement is a factor of 5 for and for .
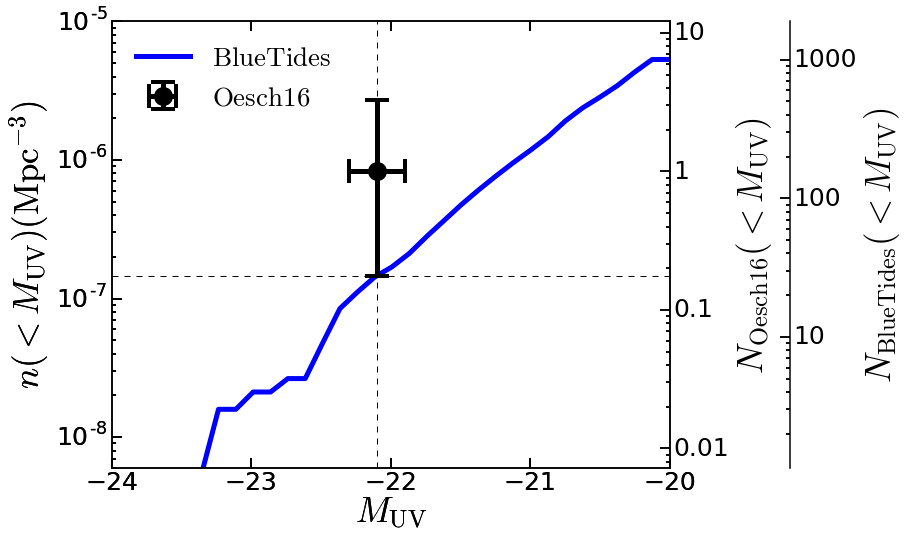
To compare directly with the observational results by O16, Figure 2 shows the cumulative volume density of sources at . The vertical error bars on the O16 measurement are the 68 per cent exact Poisson confidence intervals. Note that the uncertainties on the number density are simple Poisson errors and do not include additional sources of uncertainties, such as cosmic variance, so that they are likely to be under estimated. Within the volume probed by O16 () BlueTides predicts approximately objects with intrinsic UV luminosities greater than .
The probability of observing one or more object given this expectation is 16 per cent assuming a Poisson distribution. Since we have the full simulation data, we can find this probability without assuming Poisson statistics. The O16 volume fits into the BlueTides volume 156 times, so we subdivide the volume into boxes where one side has a length equal to the comoving distance between . We find in these subvolumes, 17 contain one galaxy with . Three of the subvolumes contain two galaxies and one contains four galaxies. This translates to a 13 per cent chance of observing one or more galaxies in the O16 observation volume. These very bright objects are very highly biased, with a linear bias of (Waters et al. 2016).
These predictions are based on the intrinsic luminosities and do not include dust attenuation. Significant dust attenuation in very bright galaxies at would reduce the number density of (UV bright) sources reducing the otherwise good agreement with the O16 result.
4 Properties: Comparison with observations
4.1 UV Continuum Slope
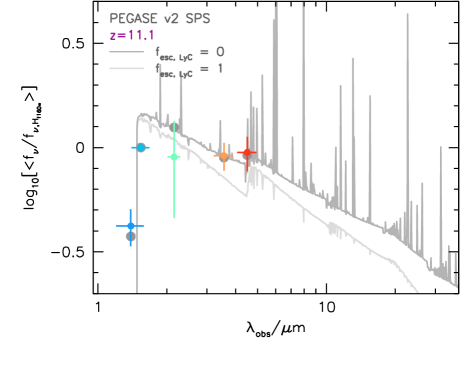
The current lack of deep mid-IR imaging limits observations of GN- to the measurement of the rest-frame UV continuum leaving only the UV continuum slope as a spectral diagnostic. The slope inferred from the O16 observations is , which is broadly consistent with the intrinsic UV continuum slope predicted by BlueTides for bright galaxies at (), suggesting that GN- has little or no dust attenuation. This can be seen in Figure 3 where we show the average intrinsic SED of bright () galaxies at . We note, however, that the predicted intrinsic UV continuum slope is also sensitive to the choice of SPS model, IMF, and assumed Lyman continuum escape fraction. Alternative choices can result in bluer intrinsic UV continuum slopes leaving open the possibility of some dust attenuation (see Wilkins et al. 2016).
4.2 Stellar mass, SFR and stellar ages
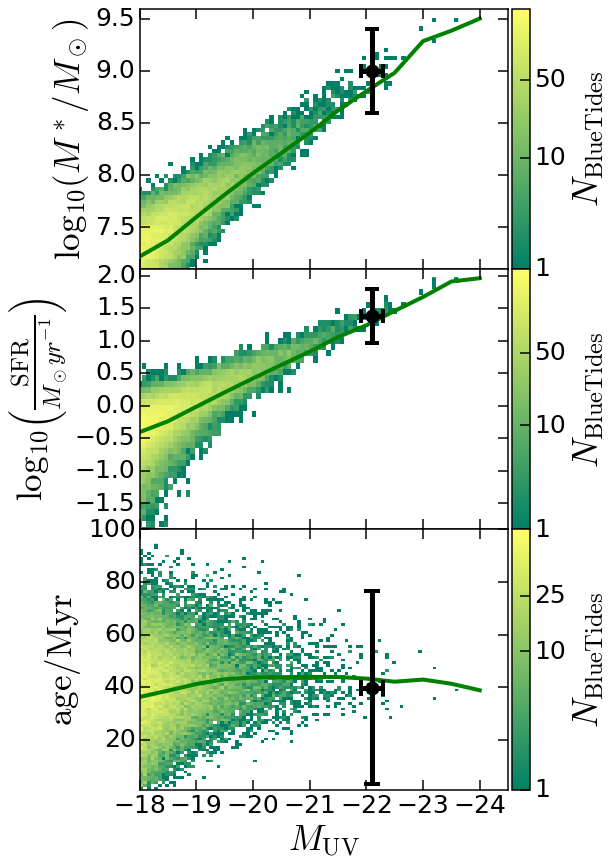
BlueTides makes predictions for a number of properties of GN- which have been inferred by O16. In Figure 4 we show the stellar masses, star formation rates and stellar ages as a function of UV luminosity for the galaxies in BlueTides. The black data points show the corresponding values inferred for GN- by O16. We can see that in the relevant magnitude range, BlueTides predicts stellar masses , SFR of a few tens yr-1 and stellar ages of about Myr for galaxies with . These values are fully consistent with the observational constraints by O16.
5 Properties: Predictions
As galaxies with the presently observed characteristics of GN- exist in BlueTides it is useful to investigate their other properties. BlueTides has high enough spatial resolution (180 pc at ) to allow determination of galaxy morphologies (see Feng et al. 2015). The simulation also tracks gas and stellar metallicities and includes modeling of black holes. Here we make predictions for these aspects.
5.1 Morphologies
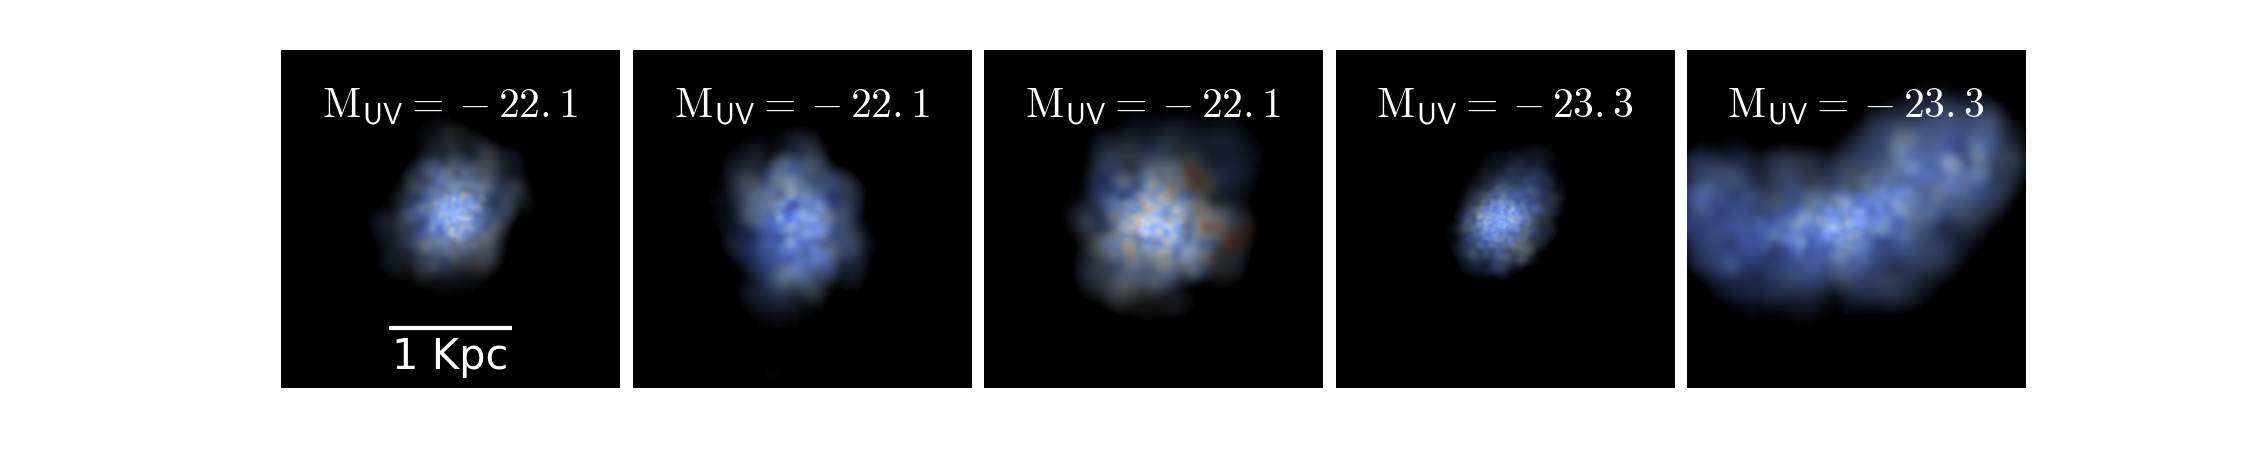
In Figure 5 we show the stellar surface density (for a random orientation) for a sample of five galaxies with in the snapshot of the BlueTides simulation. Three of the galaxies closely match the brightness of GN- (on the left) and two are examples of brighter galaxies. Even though massive and bright, the galaxies show irregular, disturbed morphologies and have typical sizes of 1 kpc. Note that in Feng et al. 2015 we found from a visual and kinematic analysis that the most massive galaxies at are nearly all classified as disks. We can see here that this does not appear to be the case as early as .
5.2 Metallicity
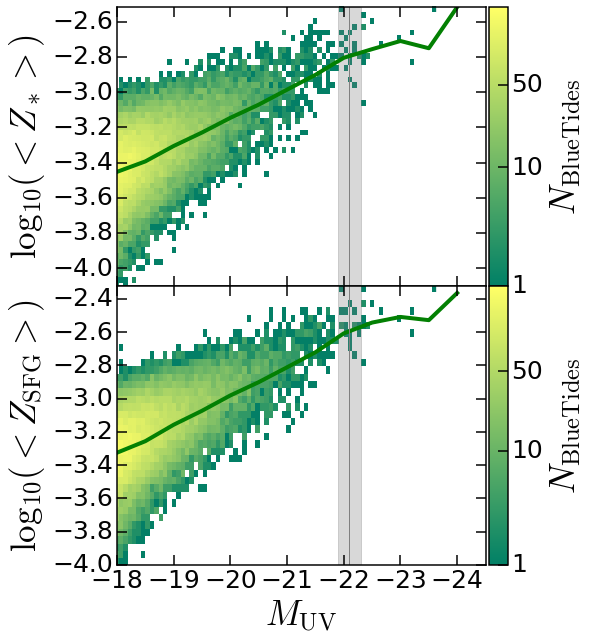
In Figure 6 we show predictions for both the star forming gas and stellar metallicity of galaxies at in BlueTides. Galaxies in the simulation follow a strong luminosity - metallicity relationship. For bright galaxies such as GB we predict mean stellar metallicities of with the metallicity of star forming gas being about a factor of 2 higher.
5.3 AGN contribution and black hole masses
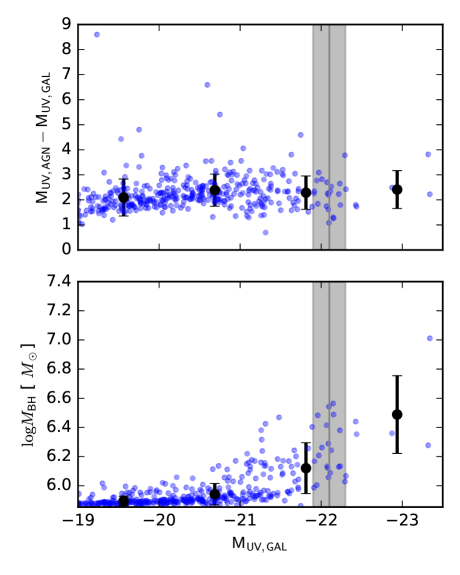
In the top panel of Figure 7 we show the prediction for the magnitude difference between the active galactic nuclei (AGN) and their host galaxies in BlueTides at (see Feng et al. 2016 for details on AGN LFs; see also, Di Matteo et al. 2012; Di Matteo et al. 2016, in prep). Overall the AGN are faint (1-2 magnitudes fainter than their hosts) at this redshift and do not contribute significantly to the observed UV luminosity. We do not predict that an AGN should be responsible for an enhancement in the observed GN-z11 UV flux.
The corresponding black hole mass as a function of galaxy UV magnitude is shown in the bottom panel of Figure 7. For host galaxies with , BlueTides predicts a population of massive black holes in the range of .
6 Conclusions
Using the large BlueTides cosmological hydrodynamical simulation we have studied the properties of the population of rare, bright galaxies at . As demonstrated by O16 this population is accessible using observations from Hubble and Spitzer. Our conclusions are summarized as follows:
-
•
Within the BlueTides volume we find galaxies with at , implying a space density of . Within the volume probed by O16 we expect approximately objects. The probability of observing one or more objects is then approximately per cent according to BlueTides and thus consistent with the discovery of GN-.
-
•
Galaxies in the simulation with luminosities similar to GN- have stellar masses, star formation rates, and stellar ages similar to those inferred for GN-.
-
•
The observed SED of GN- closely matches the intrinsic SED predicted by BlueTides suggesting that GN- has little or no dust attenuation. However, the predicted SED is sensitive to the choice of SPS model, IMF,and Lyman continuum escape leaving open the possibility of a bluer intrinsic slope and thus some moderate dust attenuation.
-
•
Bright galaxies at are predicted to harbor faint AGN accounting for per cent of the total UV luminosity with with masses
We find that the CDM predictions that BlueTides represent are consistent with this highest redshift spectroscopically confirmed galaxy. This is significant success of the model, given that simple extrapolations from lower redshift observations would otherwise make GN- an extreme outlier. BlueTides also predicts that brighter galaxies exist at this redshift and also that galaxies of similar luminosities exist at higher redshift. These are much rarer (for example, only 5 galaxies with are present in the simulation volume at ). The enormous increase in volume surveyed by the WFIRST mission (Spergel, Gehrels, Breckinridge 2013) will however make even these galaxies accessible. If our model is correct, the WFIRST High-Latitude Survey, with its sky area of 2200 deg2 should detect about galaxies (brighter than ) from out to (Waters et al. 2016). Such objects are likely to be seen during the early stages of reionization, and will truly be monsters in the dark.
Acknowledgements
We thank Pascal Oesch for a discussion on the recent observational result. We acknowledge funding from NSF ACI-1036211, NSF AST-1517593, NSF AST-1009781, and the BlueWaters PAID program. The BlueTides simulation was run on facilities on BlueWaters at the National Center for Supercomputing Applications. SMW acknowledge support from the UK Science and Technology Facilities Council. DN acknowledges support from NSF grant AST-1412768 and the Research Corporation.
References
- Agertz & Kravtsov (2015) Agertz O., Kravtsov A. V., 2015, ApJ, 804, 18
- Bouwens et al. (2015a) Bouwens, R. J., Oesch, P. A., Labbe, I., et al. 2015a, arXiv:1506.01035
- Bouwens et al. (2015) Bouwens, R. J., Illingworth, G. D., Oesch, P. A., et al. 2015b, ApJ, 803, 34
- Chabrier (2003) Chabrier, G. 2003, PASP, 115, 763
- Di Matteo et al. (2012) Di Matteo T., Khandai N., DeGraf C., Feng Y., Croft R. A. C., Lopez J., Springel V., 2012, ApJ, 745, L29
- Ellis et al. (2013) Ellis, R. S., McLure, R. J., Dunlop, J. S., et al. 2013, ApJ, 763, L7
- Feng et al. (2016) Feng, Y., Di-Matteo, T., Croft, R. A., et al. 2016, MNRAS, 455, 2778
- Feng et al. (2015) Feng, Y., Di Matteo, T., Croft, R., et al. 2015, ApJ, 808, L17
- Fioc & Rocca-Volmerange (1997) Fioc, M., and Rocca-Volmerange, B. 1997, AAP, 326, 950
- Ishigaki et al. (2015) Ishigaki, M., Kawamata, R., Ouchi, M., et al. 2015, ApJ, 799, 12
- Oesch et al. (2016) Oesch, P. A., Brammer, G., van Dokkum, P. G., et al. 2016, ApJ, 819, 129
- Oesch et al. (2015) Oesch, P. A., Bouwens, R. J., Illingworth, G. D., et al. 2015b, ApJ, 808, 104
- Oesch et al. (2014) Oesch, P. A., Bouwens, R. J., Illingworth, G. D., et al. 2014, ApJ, 786, 108
- Oesch et al. (2013) Oesch, P. A., Bouwens, R. J., Illingworth, G. D., et al. 2013, ApJ, 773, 75
- Oesch et al. (2012) Oesch, P. A., Bouwens, R. J., Illingworth, G. D., et al. 2012, ApJ, 759, 135
- Schaye et al. (2015) Schaye J., et al., 2015, MNRAS, 446, 521
- Song et al. (2015) Song, M., Finkelstein, S. L., Ashby, M. L. N., et al. 2015, arXiv:1507.05636
- Waters et al. (2016) Waters, D., Di Matteo T., Feng, Y., Wilkins S., Croft R., 2016, MNRAS, submitted
- Wilkins et al. (2016) Wilkins, S., et al. 2016, MNRAS, submitted
- Spergel et al. (2013) Spergel, D., Gehrels, N., Breckinridge, J., et al. 2013, arXiv:1305.5422
- Zheng et al. (2012) Zheng, W., Postman, M., Zitrin, A., et al. 2012, Nature, 489, 406
- Zitrin et al. (2014) Zitrin, A., Zheng, W., Broadhurst, T., et al. 2014, ApJ, 793, L12