Detection of extragalactic CF+ toward PKS 1830211
We report the first extragalactic detection of CF+, the fluoromethylidynium ion, in the z=0.89 absorber toward PKS 1830211. We estimate an abundance of 310-10 relative to H2 and that 1% of fluorine is captured in CF+. The absorption line profile of CF+ is found to be markedly different from that of other species observed within the same tuning, and is notably anti-correlated with CH3OH. On the other hand, the CF+ profile resembles that of [C I]. Our results are consistent with expected fluorine chemistry and point to chemical differentiation in the column of absorbing gas.
Key Words.:
quasars: absorption lines – quasars: individual: PKS 1830211 – galaxies: ISM – galaxies: abundances – ISM: molecules – radio lines: galaxies1 Introduction
The CF+ molecule was discovered in space by Neufeld et al. (2006) toward the Orion Bar region. It has been recently identified in Galactic diffuse clouds in absorption toward the background continuum sources 3C111, BL Lac, and W49 (Liszt et al. 2014, 2015). It is also detected toward a high-mass protostar (Fechtenbaum et al. 2015) and is therefore an ubiquitous species in the interstellar medium (ISM).
The chemistry of CF+ and other fluorine-bearing species has been investigated by Neufeld et al. (2005) and Neufeld & Wolfire (2009). With an ionization potential higher than that of hydrogen, fluorine is mostly neutral in the diffuse ISM. Besides, it is a special element in having an exothermic reaction with H2. With increasing H2 fractional abundance, HF thus becomes the main interstellar reservoir of fluorine (F+H2 HF+H). HF is destroyed by reactions with He+, H and C+. The latter reaction forms CF+ (HF+C+ CF++H), which is destroyed by dissociative recombination. Eventually, CF+ is expected to account for a small fraction (1%, Neufeld & Wolfire 2009) of the gas-phase fluorine.
Recently, H2Cl+ was detected in the z=0.89 molecular absorber toward the lensed blazar PKS 1830211 (Muller et al. 2014b), making it a good case to search for other halogen-bearing species. The absorber toward PKS 1830211 consists in two lines of sight, intercepting the disk of a z=0.89 face-on spiral galaxy (Wiklind & Combes 1996; Winn et al. 2002). Molecular absorption is seen in both lines of sight, with H2 column density of 21022 cm-2 toward the South-West image of the blazar, and 11021 cm-2 toward the North-East image. More than 40 molecules have been detected in the SW line of sight (e.g., Muller et al. 2011, 2014a). The fractional abundances in the absorber are typical of those in-between diffuse and translucent Galactic clouds. Because the density is moderate, n(H2) 103 cm-3 toward SW and likely even lower toward NE, the excitation of polar molecules is subthermal and radiatively coupled to the cosmic microwave background (CMB). Hence their rotation temperature is equal to 5.14 K, the CMB temperature at z=0.89 (Muller et al. 2013). As a result the absorption spectrum toward PKS 1830211 is not too crowded (only low-energy levels are populated), and line identification is easy.
Here, we report the ALMA detection of CF+ at z=0.89 toward PKS 1830211, which is the first extragalactic detection of this species.
2 Observations
The observations of the CF+ J=2-1 line, redshifted to 108.8 GHz at zabs=0.88582 (heliocentric frame), were taken during the ALMA Early Science Cycle 2 phase on 2014 August 27th. Two execution blocks of 6 minutes on source were observed. The correlator was configured with four different spectral windows of 1.875 GHz, each counting 3840 channels separated by 0.488 MHz, providing a velocity resolution of 2.6 km s-1 after Hanning smoothing.
The data calibration was done within the CASA111http://casa.nrao.edu/ package, following a standard procedure. The bandpass response of the antennas was calibrated from observations of the bright quasar J 1924292. The quasar J 18322039 was used for primary gain calibration. We further improved the data quality using self-calibration on the bright continuum of PKS 1830211. The spectra were extracted toward both lensed images of PKS 1830211, using the CASA-python task UVMULTIFIT (Martí-Vidal et al. 2014) to fit a model of two point sources to the visibilities. We note that the two lensed images of PKS 1830211, 1′′ apart, were clearly spatially resolved, with a synthesized beam of 0.75′′0.55′′ (Briggs weighting with robust parameter set to 0.5) in the CLEAN-deconvolved maps.
3 Results and discussion
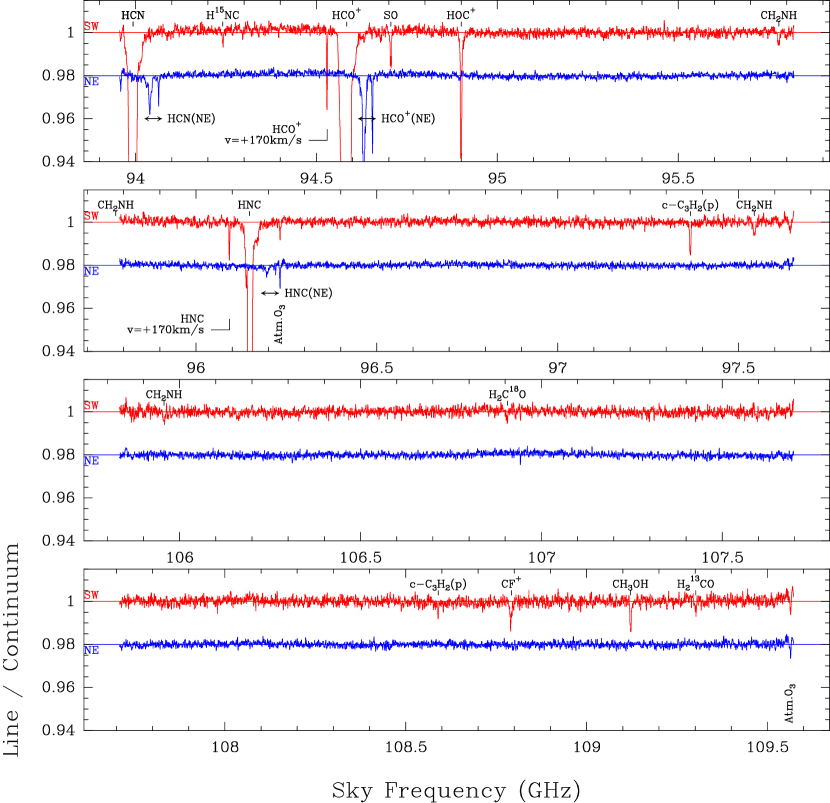
The spectrum of CF+ J=2-1 toward the SW image of PKS 1830211 is shown in Fig. 1, together with some other lines observed within the same tuning, namely from HCO+, HCN, HNC, HOC+, c-C3H2, SO, and CH3OH. All these lines arise in low energy levels (see Table 1). CF+ is not detected toward the NE image (down to a rms of 0.001 of the continuum level per 2.6 km s-1 channel), where the absorbing gas is found to be more atomic and diffuse than along the SW line of sight. This confirms that CF+ is tracing gas with already substantial molecular fraction. We will restrict the discussion to the SW line of sight.
Despite having only one transition of CF+, its identification is robust. As already said, the line crowding toward PKS 1830211 is low and we could not find any other possible alternative identification, except 13CN N=1-0 at z=0, but we would expect 1) the line to be very narrow (a few km s-1, see the Galactic absorption of c-C3H2 toward PKS 1830211 by Schulz et al. 2015) and decomposed into its characteristic spin-rotation and hyperfine pattern, and 2) very weak, as even the HCO+/HCN/C2H J=1-0 Galactic absorptions toward PKS 1830211 are no more than a few percent deep (Muller et al. in prep).
| Rest | Sky freq. | (a) | (b) | Dipole | (c) | (d) | (e) | |
| Line | freq. | =0.88582 | (K) | moment | ( cm-2 km-1 s) | (km s-1) | ( cm-2) | |
| (GHz) | (GHz) | (Debye) | ||||||
| HCN (2-1) | 177.26111 | 93.997 | 4.3 | 2.0 | 2.99 | 3.5 | – | – |
| HCO+ (2-1) | 178.37506 | 94.588 | 4.3 | 2.0 | 3.90 | 2.1 | – | – |
| SO (54-43) | 178.60540 | 94.710 | 15.9 | 4.9 | 1.54 | 141.8 | 0.24 | 34.0 |
| HOC+ (2-1) | 178.97205 | 94.904 | 4.3 | 2.0 | 2.77 | 4.1 | 1.04 | 4.3 |
| HNC (2-1) | 181.32476 | 96.152 | 4.4 | 2.0 | 3.05 | 3.4 | 41.9 | 142.5 |
| c-C3H2() (41,3-32,2) | 183.62362 | 97.371 | 16.1 | 2.4 | 3.43 | 59.7 | 0.23 | 13.7 |
| CF+ (2-1) | 205.17052 | 108.796 | 4.9 | 2.0 | 1.13 | 26.2 | 0.21 | 5.5 |
| CH3OH (11 A+-20 A+) | 205.79127 | 109.126 | 7.0 | 0.5 | 1.44 | 255.1 | 0.18 | 45.9 |
is the lower-level energy of the transition. is the line strength. is defined as the conversion factor between integrated opacity and total column density: =, calculated under the assumption that the rotational excitation is coupled with the cosmic microwave background temperature, 5.14 K at z=0.89 (see, e.g., Muller et al. 2013). Integrated opacity, over the velocity interval [20;+20] km s-1. The associated uncertainty is of 0.003 at 1. Total column density in the same velocity interval.
The hyperfine structure in the rotational spectrum of CF+ has been explored by Guzmán et al. (2012). For the J=2-1 transition, the maximum spread between hyperfine components is less than 1 km s-1 in the rest frame (this spread is to be divided by 1.89 due the redshift of the absorption), i.e., much narrower than the absorption line width (15 km s-1, FWHM). We therefore neglect the hyperfine structure splitting in the following.
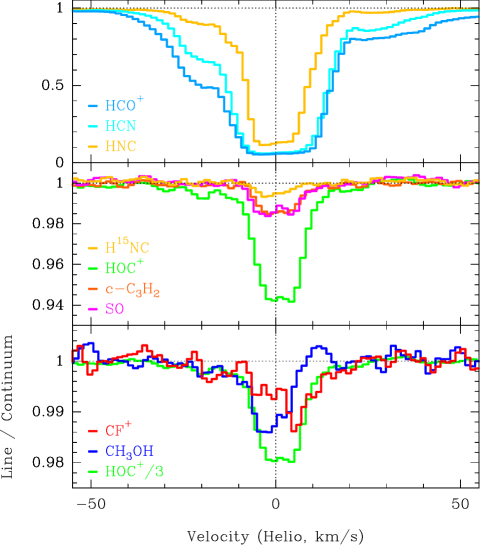
The continuum source covering factor can be inferred from the saturation level of the HCO+ and HCN J=2-1 lines, yielding 94% 333We note that this value is slightly higher than that observed in 2012 (91%) by Muller et al. (2014a), see Fig. 2.. This is a strong indication that weak absorption of a few percent of the continuum level corresponds to optically thin lines. The CF+ absorption, at most 1.5% of the continuum level, is thus likely to be optically thin. However, it does not resemble that of any other species observed within the same tuning (Fig. 1). In fact, we can classify the species in four categories depending on their line profiles: 1) HCO+, HCN, and HNC, with their optically thick absorption (HCO+ and HCN reach saturation); 2) HOC+, c-C3H2, and SO, which are optically thin and trace the bulk of the main absorption between about 20 km s-1 444Throughout the paper,we refer the velocity to the heliocentric frame, taking zabs=0.88582. to 20 km s-1; 3) CF+, which peaks on the red wing at about 5 km s-1, although its absorption is also seen over the main 20 km s-1 to 20 km s-1 velocity range; and 4) CH3OH which peaks on the blue wing at about 3 km s-1.
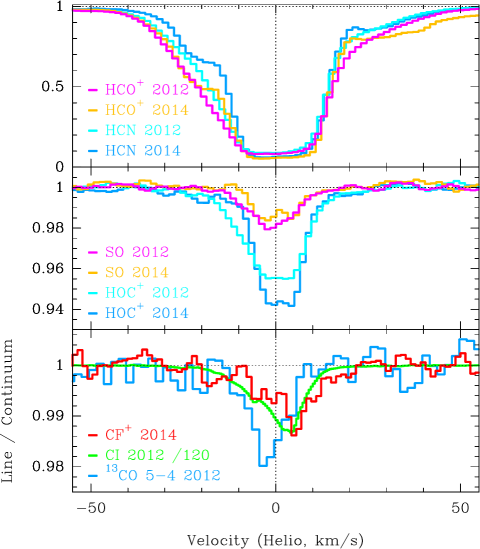
It is interesting to note that in previous observations toward PKS 1830211, only few species show slight but significant deviations in their velocity centroids compared to the majority of detected species. In the 7 mm spectral scan obtained with the Australia Telescope Compact Array (ATCA), Muller et al. (2011) found that HCO and SO+ had a redshifted centroid (+4 km s-1) 555Note the limited velocity resolution of the ATCA 7 mm survey, of 10–6 km s-1 across the 30–50 GHz frequency interval., similar to CF+ here. On the other hand, CH3OH, HNCO, HC3N, and CH3NH2 were found with blueshifted centroids (5 km s-1), like CH3OH here. A similar centroid was found by Kanekar et al. (2015) on the line profile of several CH3OH lines observed at good signal-to-noise ratio with the Jansky Very Large Array. The time variations of the absorption (Muller & Guélin 2008; Muller et al. 2014a) hamper the comparison of line profiles across time, but at a given epoch, the relative offsets of the line velocity centroids between different species are meaningful. Since all those lines have similar excitation, the offsets ought to originate from differences in the chemical or physical properties of the absorbing medium. In Fig. 2, we compare the new spectra obtained in 2014 with those of the same lines observed in 2012 (Muller et al. 2014a, ALMA Cycle 0 data). For HOC+, the 2014 spectrum is about 30% deeper around =0 km s-1 and the blue wing has become slightly less prominent (same as for the HCO+ and HCN profiles), but overall the line shape hasn’t changed drastically. Most interestingly, of all species observed in 2012 by ALMA, it is [C I] which has the closest line profile to CF+. Neutral carbon is naturally expected to be present in regions better shielded and slightly denser than for ionized carbon. Since CF+ is produced from C+, we expect an even better correlation between CF+ and [C II] lines.
By integrating over the line between 20 kms to +20 km s-1 and assuming thermal equilibrium with CMB photons, we find a total CF+ column density of 5.51012 cm-2. With a H2 column density of 21022 cm-2 (Muller et al. 2014a), this corresponds to an averaged fractional abundance [CF+]/[H2] of 310-10. The cosmic abundance of fluorine is a few times 10-8 that of hydrogen (Snow et al. 2007; Asplund et al. 2009). Assuming that the fluorine abundance is similar in the absorbing clouds of the z=0.89 galaxy, we conclude that only 1% of the interstellar fluorine is captured in CF+, in agreement with predictions from Neufeld & Wolfire (2009). The CF+ production and destruction may be expressed as follows, in diffuse clouds,
| (1) |
with a formation rate =7.210-9(T/300)-0.15 cm3 s-1, T being the temperature, and
| (2) |
with a dissociative recombination rate =5.210-8(T/300)-0.8 cm3 s-1. There, other destruction reactions with negative ions are neglected. By assuming steady state for the CF+ abundance, the following relation is obtained:
| (3) |
where the electron density [e] is assumed to be roughly equal to the C+ abundance in diffuse cloud. The recombination rate constant has been measured by using a laboratory storage ring experiment (Novotny et al. 2005). On the other hand the value has not yet been measured. Neufeld et al. (2005) estimated the value by use of a statistical adiabatic capture model. Therefore, the coefficient 0.138 may have an uncertainty of a factor of 2–3. When we assume a kinetic temperature T=100 K, Eq. 3 gives the ratio [CF+]/[HF]7%, where it is noted that the T value corresponds to roughly AV=2 from Fig. 10 of the paper of Nagy et al. (2013). In more sophisticated calculations, the ratio changes depending on the AV value, taking the maximum ratio of 10% at AV=1, as shown in Fig. 3 of Neufeld & Wolfire (2009). From the observational point of view, the CF+ abundance is thought to be about 1% of the gas-phase fluorine abundance in the Galactic diffuse clouds (e.g., Nagy et al. 2013).
CF+ and HF have both been detected toward the Galactic source W49 (Liszt et al. 2015), and the abundance ratio [CF+]/[HF] is in the range 0.010–0.025 for various velocity components. The values are consistent if we consider the uncertainty of the calculated (see also the discussion by Liszt et al. 2015) and variations of C+ abundance in diffuse clouds.
For the absorber toward PKS 1830211, the HF J=1-0 line, redshifted into the ALMA band 9, has recently been detected (Kawaguchi et al. 2016) and shows a heavily saturated absorption toward the SW image, with a HF column density 3.41014 cm-2. The fluoronium ion, H2F+, on the other hand, was not detected down to an abundance ratio [H2F+]/[HF]1/386 (3). This confirms that HF is the main molecular reservoir of fluorine.
4 Summary and conclusions
We report the detection of CF+ in the z=0.89 absorber toward PKS 1830211. This is the first extragalactic detection of this ion which, by now, has been observed in various Galactic sources. We find that the absorption line profile of CF+ is significantly different from those of other species observed in the same tuning, and especially anti-correlated with CH3OH. We estimate a CF+ fractional abundance of 310-10, implying that only 1% of the interstellar fluorine is captured in this ion, and that HF is by far the main reservoir of interstellar fluorine in the molecular phase.
Acknowledgements.
This paper makes use of the following ALMA data: ADS/JAO.ALMA#2013.1.01099.S and ADS/JAO.ALMA#2011.0.00405.S. ALMA is a partnership of ESO (representing its member states), NSF (USA) and NINS (Japan), together with NRC (Canada) and NSC and ASIAA (Taiwan) and KASI (Republic of Korea), in cooperation with the Republic of Chile. The Joint ALMA Observatory is operated by ESO, AUI/NRAO and NAOJ.References
- Asplund et al. (2009) Asplund, M., Grevesse, N., Sauval, A. J., & Scott, P., 2009, ARA&A, 47, 481
- Cernicharo, J. & Guélin (1987) Cernicharo, J. & Guélin, M., 1987, A&A, 183, 10
- Guzmán et al. (2012) Guzmán, V., Roueff, E., Gauss, J., et al., 2012, A&A, 548, 94
- Fechtenbaum et al. (2015) Fechtenbaum, S., Bontemps, S., Schneider, N., et al., 2015, A&A, 574, 4
- Kanekar et al. (2015) Kanekar, N., Ubachs, W., Menten, K. M., et al., 2015, MNRAS, 448, 104
- Kawaguchi et al. (2016) Kawaguchi, K., Muller, S., Black, J. H., et al., 2016, ApJ, in press
- Liszt et al. (2014) Liszt, H. S., Pety, J., Gerin, M., & Lucas, R., 2014, A&A, 564, 64
- Liszt et al. (2015) Liszt, H. S., Guzmán, V., Pety, J., Gerin, M., Neufeld, D. A., & Gratier, P., 2015, 579, 12
- Martí-Vidal et al. (2014) Martí-Vidal, I., Vlemmings, W., Muller, S., & Casey S., 2014, A&A, 563, 136
- Muller & Guélin (2008) Muller, S. & Guélin, M., 2008, A&A, 491, 739
- Muller et al. (2011) Muller, S., Beelen, A., Guélin, M., et al., 2011, A&A, 535, 103
- Muller et al. (2013) Muller, S., Beelen, A., Black, J. H., et al., 2013, A&A, 551, 109
- Muller et al. (2014a) Muller, S., Combes, F., Guélin, M., et al., 2014a, A&A, 566, 112
- Muller et al. (2014b) Muller, S., Black, J. H., Guélin, M., et al., 2014b, A&A, 566, 6
- Müller et al. (2001) Müller, H. S. P., Thorwirth, S., Roth, D. A. & and Winnewisser, G., 2001, A&A, 370, L49
- Nagy et al. (2013) Nagy, Z., Van der Tak, F. F. S., Ossenkopf, V., et al., 2013, A&A, 550, 96
- Neufeld et al. (1997) Neufeld, D. A., Zmuidzinas, J., Schilke, P., & Phillips, T. G., 1997, ApJ, 488, 141
- Neufeld et al. (2005) Neufeld, D. A., Wolfire, M. G., & Schilke, P., 2005, ApJ, 628, 260
- Neufeld et al. (2006) Neufeld, D. A., Schilke, P., Menten, K. M., et al., 2006, A&A, 454, 37
- Neufeld & Wolfire (2009) Neufeld, D. A. & Wolfire, M. G., 2009, ApJ, 706, 1594
- Neufeld et al. (2010) Neufeld, D. A., Sonnentrucker, P., Phillips, T. G., et al., 2010, A&A, 518, 108
- Novotny et al. (2005) Novotny, O., Mitchell, J. B. A., LeGarrec, J. L., et al., 2005, J. Phys. B: At. Mol. Opt. Phys., 38, 1471
- Schulz et al. (2015) Schulz, A., Henkel, C., Menten, K. M., et al., 2015, A&A, 574, 108
- Snow et al. (2007) Snow, T. P., Destree, J. D.. Jensen, A. G., 2007, ApJ, 655, 285
- Wiklind & Combes (1996) Wiklind T. & Combes F. 1996, Nature, 379, 139
- Winn et al. (2002) Winn, J. N., Kochanek, C. S., McLeod, B. A., et al., 2002, ApJ, 575, 103
Appendix A Data