Evidence for two Lognormal States in Multi-wavelength Flux Variation of FSRQ PKS 1510-089
Abstract
We present a systematic characterization of multi-wavelength emission from blazar PKS 1510-089 using well-sampled data at infrared(IR)-optical, X-ray and -ray energies. The resulting flux distributions, except at X-rays, show two distinct lognormal profiles corresponding to a high and a low flux level. The dispersions exhibit energy dependent behavior except for the LAT -ray and optical B-band. During the low level flux states, it is higher towards the peak of the spectral energy distribution, with -ray being intrinsically more variable followed by IR and then optical, consistent with mainly being a result of varying bulk Lorentz factor. On the other hand, the dispersions during the high state are similar in all bands expect optical B-band, where thermal emission still dominates. The centers of distributions are a factor of apart, consistent with anticipation from studies of extragalactic -ray background with the high state showing a relatively harder mean spectral index compared to the low state.
1 INTRODUCTION
Flux variability across the electromagnetic spectrum over a wide range of timescales ranging from fractions of second to years is an important characteristic of astrophysical objects powered by active black holes. The temporal variability has been found to be stochastic and widely believed to be a result of a complex and dynamic interplay between the magnetic field, black hole spin, and accreting plasma as well as relativistic jet (if present). In fact, well sampled time series analysis of these sources show similar features albeit at different timescales, lending support to understanding that similar processes are powering the emission at the base level (eg. Negoro & Mineshige, 2002; Aoki et al., 2003). Thus, based on these and other similarities, active galactic nuclei (AGN), hosting supermassive black holes (SMBHs, McHardy et al., 2004) have been claimed to be a scaled-up versions of Galactic X-ray binaries hosting stellar mass black holes (McHardy et al., 2006).
Blazars, consisting of BL Lacertae objects (BLL) and flat spectrum radio quasars (FSRQs) are subclass of radio-loud AGN with emission dominated by relativistic jet beamed towards us. They are characterized by a high flux variability across the entire accessible electromagnetic spectrum on timescales ranging from minutes to years with a high degree of polarization at radio and optical energies which often changes with changes in the source flux states. Additionally, high-resolution imaging in radio wavebands show superluminal features across the jet (Lister et al., 2013). Despite a wide range in temporal variability timescales, their spectral energy distributions (SEDs) show a characteristic broad double-hump profile with a low energy peak between infrared (IR) to ultraviolet (UV)/X-rays while the other at -ray energies. Emission from other components e.g. disk, corona, torus, line emitting regions etc. have also been observed in few sources but almost always sub-dominant compared to the jet emission. The low energy hump of the SED is well understood to be synchrotron radiation from relativistic non-thermal distribution of electrons (or pairs), while two schools of thought: leptonic and hadronic, exist for emission at the high energy hump. The former attributes the high energy emission to inverse Compton processes (Ghisellini et al., 2014; Potter & Cotter, 2015) while the latter attributes it to hadron-photon initiated cascades and/or proton synchrotron (Mannheim, 1998; Mücke et al., 2003). Irrespective of the origin, emission from blazars have been found to be stochastic, similar to other AGN and Galactic X-ray binaries (McHardy, 2008; Abdo et al., 2010; Chatterjee et al., 2012; Nakagawa & Mori, 2013; Sobolewska et al., 2014) with reports of quasi-periodicity as well (Gierliński et al., 2008). Study of long-term behavior of variability in blazars, however, is highly dependent on the simultaneous coverage of source over a broad spectrum. But, for -ray bright blazars, the continuous scanning of entire sky every 3 hours between 0.1 - 300 GeV by the Fermi-LAT and coordinated multi-wavelength follow-ups by observatories supporting Fermi provides an unprecedented amount of data for such studies.
Flares are loosely defined as the brightening of source emission regardless of the nature of physical processes causing the brightening, and was first introduced in the context of emission from the Sun (e.g., Benz, 2008). It has a different meaning in context of different class of sources and spans a wide range in spectral/flux and temporal domains. In the spectral/flux domain, the distribution of various flares characteristics varies dramatically across different sources e.g. Solar flare peak X-ray fluxes show a power-law distribution (Aschwanden & Freeland (2012), see also Aoki et al. (2003)) while Galactic X-ray binaries exhibit a lognormal distribution on sub second timescales (e.g. Uttley et al., 2005). In blazars, flares are generally defined using the flux doubling and halving timescales (Nalewajko, 2013), and encode the characteristics of processes happening in the jet. As a result, flux distribution of blazars in different activity states has been investigated in many studies to understand the nature of emission processes (Giebels & Degrange, 2009; H.E.S.S. Collaboration et al., 2010; Chevalier et al., 2015) and jet connection with central engine. However, a systematic study of flux distribution has been lacking in blazars, mainly due to inhomogeneous sampling and their stochastic variability nature. Additionally, such studies demand a well sampled source variability states including both flaring and quiescent states to perform a meaningful statistical analysis (eg. H.E.S.S. Collaboration et al., 2010).
Here, we report a systematic study of the long-term multi-wavelength flux distribution of FSRQ PKS 1510-089, located at the redshift of . The study is made feasible due to near-continuous detection of PKS 1510-089 in the LAT band over a 3-days time-bin. Further, it shows many flaring states compared to other sources with similar continuous detections in LAT (in preparation). This, in turn, also allowed us to access the sampling effects in different energy bands and thus, validate the robustness of our results.
2 Observations and Data Reduction
PKS 1510-089 is one of the most extensively monitored blazars at all wavelengths accessible from the ground and space under the Fermi AGN Science: Multiwavelength Observing - Support Programs111http://fermi.gsfc.nasa.gov/ssc/observations/multi/programs.html to understand the enigmatic AGN. The continuous scanning of the sky by Fermi and the corresponding multi-wavelength near-continuous follow-ups from the ground have generated vast amount of well sampled data. Since blazar variability is stochastic (McHardy, 2008; Chatterjee et al., 2012; Nakagawa & Mori, 2013; Sobolewska et al., 2014), we have mainly used simultaneous/contemporaneous multi-wavelength data from -ray to optical-IR except at X-rays where we have used RXTE due to lack of well sampled data by the Swift observatory. The details of data archives and resources used are summarized in Table 1.
| Facility | Energy Range | Data time period | No. of data points | Data* |
|---|---|---|---|---|
| Fermi | 0.1 - 300 GeV | 2008-08-05 to 2015-09-10 | 840 (3-days bin) | 840 (97.2%) |
| RXTE | 3.0 - 20.0 keV | 1996-12-13 to 2011-12-30 | 1316 | 1137 (62.1%) |
| XRT (Swift) | 0.3-10.0 keV | 2006-08-05 to 2013-09-24 | 238 | - |
| SMARTS | B | 2008-05-17 to 2015-07-01 | 592 | 385 (44.4 %) |
| V | 2008-07-15 to 2015-07-01 | 587 | 381 (44.9 %) | |
| R | 2008-02-05 to 2015-07-01 | 592 | 386 (42.8 %) | |
| J | 2008-02-05 to 2015-07-01 | 576 | 376 (41.7 %) | |
| K | 2009-04-05 to 2015-07-01 | 517 | 341 (44.9 %) |
∗ Number of data points after binning uniformly over 3-days for the mentioned duration and its percentage in bracket.
2.1 LAT -ray data
The PASS8 Fermi LAT -ray data for the duration of MJD 54683 - 57275 (Table 1) is analyzed using Fermi-LAT Science tool version v10r0p5 following the recommended analysis procedures222http://fermi. gsfc.nasa.gov/ssc/data/analysis/scitools/python_tutorial.html. Events, more likely to be photons, classified as “evclass=128, evtype=3”, energy 100 MeV and zenith angles 90∘ were selected from a region of interest (ROI) of centered at the source. The corresponding good time intervals were calculated using the recommended selection “(DATA_QUAL0)&&(LAT_CONFIG==1)”. Effects of selections on data and sources outside the ROI were accounted by generating exposure map on ROI, and an additional annulus of around ROI. These events were then analyzed using unbinned maximum likelihood method (PYTHON implementation of gtlike) with PASS8 instrument response function (P8R2_SOURCE_V6) and input source model from the 3rd LAT catalog (3FGL – gll_psc_v16.fit; Acero et al., 2015). Contributions of Galactic and isotropic emission were accounted by using the latest Galactic diffuse emission (gll_iem_v06.fits) and isotropic background (iso_P8R2_SOURCE_V6_v06.txt) templates provided by the LAT science team.
The three day averaged light curve in 0.1–300 GeV is generated following the above procedures assuming a log-parabola model [] with normalization () and spectral indices () free to vary. The likelihood fit was performed iteratively by removing point sources with Test Statistic (TS) 0 until it converged as done in Kushwaha et al. (2014). However, for the scientific analysis, only fluxes corresponding to TS 9 ( 3 ) have been used, resulting in a near-continuous detection of the source except for 3% of the total duration.
2.2 RXTE quick look data
The 1316 spectra derived from quick look RXTE data are individually modeled in XSPEC using statistics with a minimum of 20 counts per bin. The wabs*power-law model with a fixed (7.4 1020 cm-2; Kalberla & Haud, 2015) was used to fit and estimate the 3.0-20.0 keV unabsorbed fluxes.
2.3 SMARTS long-term IR-optical monitoring data
PKS 1510-089 is among the blazars that are regularly monitored at almost on daily cadence by the group at Yale University under the banner of SMARTS consortium. The reduced SMARTS data for all five optical/NIR bands (BVRJK) are publicly available and the details of reduction methodology are discussed in Bonning et al. (2012). Here, we have used data from all the bands after correcting for Galactic reddening (Schlafly & Finkbeiner, 2011) with an E(B-V) of 0.085 0.004.
3 ANALYSIS AND RESULTS
Multi-wavelength flux distribution of sources with broadband stochastic variability is a unique tool to understand and probe the nature of physical processes eg. a normal flux distribution suggests additive processes while a lognormal refers to cascade/multiplicative processes. Additionally, it offers valuable insights in unifying the processes if activities in different bands are correlated, but requires a well sampled multi-wavelength data. In PKS 1510-089, the -ray activity is well sampled and almost every -ray activity333Visual inspection of multi-wavelength light curves only. is reflected in the IR-optical bands444Few non-associated events will have no bearing on general trends.. Further, despite gaps in the observations, the IR-Optical data are well sampled in terms of flux states of the source. X-ray/UV data by Swift, on the other hand, are relatively few and belong mostly to the elevated activity state. Hence, we have used the non-contemporaneous but well sampled RXTE data at X-rays.
The multi-wavelength flux characterization is performed by constructing histograms (normalized) of logarithm555unless stated otherwise, logarithm in the present work refers to logarithm of physical quantity to the base 10. of flux in different energy bands from IR to -rays. An equi-spaced flux histogram of 20 bins has been found to be satisfactory for all the bands666Also consistent with the available statistical methods for generating histograms in literature, like Knuth, Bayesian etc.. Additionally, since multi-wavelength fluxes appear correlated, we have also constructed the intrinsic variability and SED associated with the resulting flux distribution to better understand the underlying processes.
3.1 Flux Distribution: Log-normality
3.1.1 Gamma-ray Flux Histogram: LAT
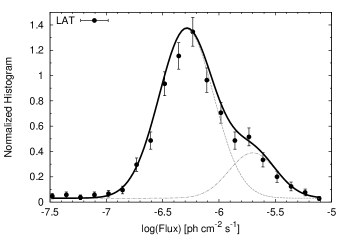
The histogram (normalized) of the logarithmic photon flux from LAT is shown in the top-left panel of Figure 1. The profile of the resulting histogram is consistent with two Normal distributions of general form (e.g. H.E.S.S. Collaboration et al., 2010)
| (1) |
where is the normalization, and are the centers of the distribution with widths and , respectively. is a constant offset to account for the base flux and/or long tail, if any, and has been fixed to zero in case of best fit value being negative or consistent with zero. The best fit values of parameters along with 1 uncertainties are given in Table 2.

3.1.2 X-ray Flux Histogram: RXTE
3.1.3 IR-Optical Flux Histogram: SMARTS
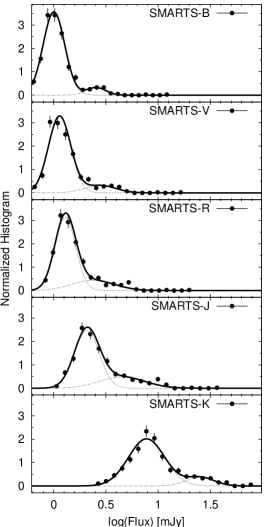
The flux distributions from all the SMARTS bands are shown in the right panel of Figure 1. As is the case with LAT -ray flux distribution, the SMARTS histograms are also consistent with a bi-lognormal distribution. The corresponding best fit parameters value are reported in the Table 2. The relatively high reduced- for V-band appears to be a result of competitive contributions from the jet and accretion disk, where the latter hardly varies in comparison to the former, but contributes significantly except in the very high flux states (tail of the distribution).
| Energy Band | a | dof | |||||
| LAT | 0.81 0.06 | -6.28 0.03 | 0.24 0.02 | -5.70 0.08 | 0.21 0.04 | 14 | 1.17 |
| RXTE | 1.0 —- | -10.785 0.003 | 0.128 0.003 | —- —- | —- —- | 17 | 1.10 |
| SMARTS-B | 0.92 0.01 | 0.003 0.004 | 0.103 0.004 | 0.40 0.02 | 0.09 0.02 | 15 | 0.76 |
| SMARTS-V | 0.88 0.04 | 0.057 0.009 | 0.107 0.007 | 0.44 0.07 | 0.14 0.04 | 15 | 1.88 |
| SMARTS-R | 0.78 0.14 | 0.112 0.008 | 0.10 0.01 | 0.38 0.16 | 0.20 0.07 | 15 | 1.27 |
| SMARTS-J | 0.73 0.12 | 0.32 0.02 | 0.12 0.01 | 0.66 0.12 | 0.22 0.06 | 15 | 1.40 |
| SMARTS-K | 0.88 0.03 | 0.89 0.01 | 0.17 0.01 | 1.40 0.04 | 0.13 0.03 | 15 | 1.04 |
| ∗ LAT: ph cm-2 s-1; RXTE: erg cm-2 s-1; SMARTS: mJy | |||||||
3.1.4 Inhomogeneous Sampling and Bias on Histograms
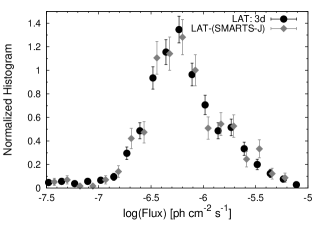
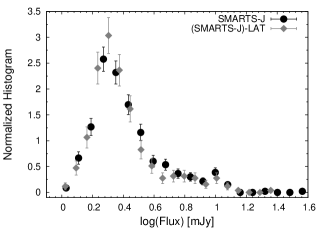
The incoherent and in-homogeneous sampling in different energy bands can introduce bias in the flux distributions, especially at IR-Optical energies where blazars also show strong intra-night variability (e.g. Chandra et al., 2011; Cellone et al., 2007). However, for correlated variations, a good estimate of bias introduced by the sampling can be accessed by using sampling criteria similar to the best (LAT) and least (SMARTS-J) monitored light curves. For the effect of inhomogeneous sampling, we have constructed a LAT flux histogram by considering only those fluxes which have at least one observation in the SMARTS-J band. Other way round, we have binned SMARTS-J data using LAT timebins and constructed its histogram. The rebinned histograms along with the original ones are shown in the top panel of Figure 2. Similarly, we have checked the other SMARTS bands and the RXTE data by considering only the time bins having LAT observations. The best fit parameters to the rebinned histograms are compatible with the value given in the Table 2 except for V-band which is due to contribution by jet and disk (individually jet/disk dominated emission show bimodality). Thus, our results are independent of sampling effects and hence, are robust.
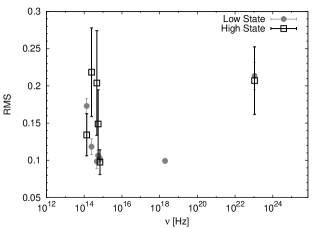
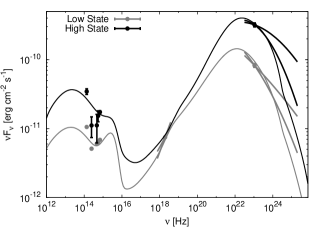
3.2 RMS Variability and SED
To better understand the flux states, we have also constructed the intrinsic variability (excess rms) spectra and SEDs corresponding to the two flux states labeled as Low State and High State using intersection of the two lognormals as the dividing point. The respective plots are shown in the bottom panels of Figure 2. The RMS variability spectrum of respective State is calculated by subtracting the effects of flux errors from the respective best fit ( and ; Vaughan et al., 2003), while the SEDs are constructed using the best fit central flux values, and and associated 1 uncertainties. A one zone leptonic model of same emission region size, incorporating synchrotron and IC scattering of synchrotron, BLR and torus (Kataoka et al., 2008) photon fields (Kushwaha et al., 2013; Sahayanathan & Godambe, 2012) successfully reproduces the SEDs with parameters values reported in Table 3. In both RMS spectra and SEDs, the X-ray (777= 1.370.13) and -ray ( High State: = -2.290.01, = 0.0860.004; Low State: = -2.400.01, = 0.300.02) points are shown at the index-weighted888 mean energy, where the indices are the mean of respective flux states.
| Parameters | Numerical values (CGS units) | |
| Low State | High State | |
| Particle index before break (p) | 2.0 | 1.8 |
| Particle index after break (q) | 4.1 | 4.0 |
| Magnetic field (, G) | 0.77 | 0.88 |
| Equipartition factor () | 3.4 | 1.9 |
| Doppler factor () | 19.5 | 30.1 |
| Particle break energy∗ () | ||
| Jet power () | ||
| Emission region size (): cm | ||
| Angle to the line of sight (): 3∘ | ||
| IR Torus temperature (): 820 K | ||
| Minimum particle energy∗ (): 10 | ||
| Maximum particle energy∗ (): | ||
| ∗in electron rest-mass units | ||
4 DISCUSSION
Our systematic analysis of multi-wavelength flux distribution of FSRQ PKS 1510-089, having well sampled flux states (Figure 2 top panel) reveals that -rays to IR-optical emission follow a bi-lognormal distribution except X-ray999A hint of bi-lognormality is present in Swift-XRT data but the data are biased., which conforms to a single lognormal distribution. Such bimodality at -ray energies has been expected from extragalactic -ray background (EGB) study (Stecker & Salamon, 1996, see also Stecker & Venters (2011)). Interestingly, the amplitude ratio is , close to the one anticipated () by Stecker & Salamon (1996). Further, the mean spectral index during the High State (2.290.01, 0.0860.004) is relatively harder than the Low State (2.400.01, 0.300.02), but both ( only) are consistent with the observed distribution of indices inferred from the statistical studies of LAT blazars (Singal et al., 2012; Singal, 2015). In terms of contribution to EGB, blazars account for almost all above 100 GeV and 50% (FSRQ: 35%, BL-Lac: 17%) below it with the rest accounted by other LAT detected sources (Ajello et al., 2015; Singal, 2015).
Similar studies, performed so far on BL Lac class of sources have shown both single as well as bi-lognormal distributions. The X-ray profile found here is also seen in BL Lacertae (Giebels & Degrange, 2009). Similarly, a single lognormal profile in multi-wavelength have been found for PKS 2155-304 (Chevalier et al., 2015) except for the single flaring instance of 2006 at GeV, inclusion of which results in a bi-lognormal profile at -rays (H.E.S.S. Collaboration et al., 2010). Here, however, we have found flux distribution with a bi-lognormal distribution at IR-optical as well as -rays (0.1-300 GeV) with light curves showing many flaring instances of varied flux levels in different energy bands. This bi-modality seems to be similar to the two basic spectral states, (low/hard and high/soft) that are observed in X-ray binaries (e.g. Uttley et al., 2005). However, these spectral transitions in X-ray binaries occur on timescales of days/months. Scaling this time-scale for a SMBH would lead to years (Körding et al., 2006), significantly longer than the days-to-weeks transitions reported here.
The intrinsic rms variability during the two states exhibits a complex energy dependent behavior (Figure 2, bottom-left) with remarkably different multi-wavelength flux dispersions. The -ray Low and High State flux dispersions are consistent with each other (Table 2). The same is true for the B-band dispersions. However, the -ray dispersion is comparatively wider than the IR-optical and X-ray during the Low State, but similar to IR-optical dispersions during the High State except for the B-band. Further, the dispersion increases towards IR bands during the Low State suggesting more variability at IR bands than optical. Additionally, the IR-optical distributions exhibit significant high flux tails (Fig. 2, top-right panel), even after averaging over LAT binning durations, contrary to the X-ray and -ray distributions.
The SED modeling requires both BLR and IR-torus ( 820 K, Kataoka et al., 2008) to reproduce the 0.1-10 GeV emission in leptonic scenario with bulk Lorentz factor being mainly responsible for variation. This is also consistent with -ray dispersion being wider (BLR-IR boosted by square of bulk Lorentz factor) than IR-optical which is synchrotron radiation. On the other hand, similar High State dispersions at all energies except B-band suggest both underlying particle spectrum and magnetic field playing a dynamic role. The high flux tails of IR-optical distributions, however, favor magnetic field, indicating a shock origin for the high flux states. Similar High and Low State dispersions in B-band, on the other hand, is result of disk emission being dominant during both as suggested by the High State SED and RMS spectrum (Fig. 2). The single lognormal distribution for X-ray from RXTE is consistent with 3-20 keV flux not as strongly variable as the IR-optical and -ray emission and is mainly a result of emission from low energy part of the particle spectrum. We disfavor a substantial coronal contribution at X-ray for single lognormal distribution as even in that case a bimodal distribution is expected as seen in the optical B-band (corona connected with the disk).
A lognormal distribution of flux implies emission being powered by cascade/multiplicative processes rather than additive. In black hole powered sources like Seyfert galaxies and X-ray binaries, lognormality is widely believed to be a result of fluctuations in the accretion disk (Uttley et al., 2005; McHardy, 2008). Thus, a lognormal flux distribution in blazars may be an imprint of modulation in the disk, connecting jet to disk activity (Giebels & Degrange, 2009; McHardy, 2008). Additionally, a lognormal distribution is also expected for plasma ejection triggered by local magnetic reconnections (see eg. Aoki et al., 2003), but contribute negligibly to blazars emission (Kadowaki et al., 2015). Most of emission is from the jet (Kadowaki et al., 2015), mainly from the blazar zone where the plasma collimates, probably by the action of large-scale guiding magnetic fields and/or external medium, as inferred from the M87 jet (Hada et al., 2013). The cascades of magnetic energy to particles proceed probably via reconnection first, leading to further development via turbulence and shocks. A reconnection mediated channeling of energy to particles, however, results at most to an equipartition of energy between the two, in contradiction with the SED modeling of blazars emission which almost always suggests particle dominated jets (Ghisellini et al., 2014). It is, though, consistent with relativistic fluid approach of Potter & Cotter (2015) (see also Dermer et al. (2014)).
A lognormal distribution also suggests an existence of some characteristic energy scale that manifests into radiative form. This may be related to the power being injected into the jet. The apparent large flux variations, on the other hand, may be related to the efficiency of underlying processes channeling energy among themselves and finally to non-thermal particles at the blazar zone and/or within the jet. Apart from active BHs, coronal mass ejection from the Sun, known to be a result of magnetic reconnection also follow a lognormal distribution (Aoki et al., 2003). The observed lognormality, thus, may well be an imprint of disk modulation as seen in X-ray binaries and Seyfert galaxies, and/or a convolution of plasma exhaust due to local magnetic reconnections.
The authors thank the referee for a thorough report. This research has made use of data obtained from High Energy Astrophysics Science Archive Research Center (HEASARC), maintained by NASA’s Goddard Space Flight Center and an up-to-date SMARTS optical/near-infrared light curves available at www.astro.yale.edu/smarts/glast/home.php.
References
- Abdo et al. (2010) Abdo, A. A., Ackermann, M., Ajello, M., et al. 2010, ApJ, 722, 520
- Acero et al. (2015) Acero, F., Ackermann, M., Ajello, M., et al. 2015, ApJS, 218, 23
- Ackermann et al. (2015) Ackermann, M., Ajello, M., Albert, A., et al. 2015, ApJ, 799, 86
- Ackermann et al. (2010) Ackermann, M., Ajello, M., Baldini, L., et al. 2010, ApJ, 721, 1383
- Ajello et al. (2015) Ajello, M., Gasparrini, D., Sánchez-Conde, M., et al. 2015, ApJ, 800, L27
- Aoki et al. (2003) Aoki, S., Yashiro, S., & Shibata, K. 2003, International Cosmic Ray Conference, 5, 2729
- Aschwanden & Freeland (2012) Aschwanden, M. J., & Freeland, S. L. 2012, ApJ, 754, 112
- Benz (2008) Benz, A. O. 2008, Living Reviews in Solar Physics, 5, 1
- Bonning et al. (2012) Bonning, E., Urry, C. M., Bailyn, C., et al. 2012, ApJ, 756, 13
- Cardelli et al. (1989) Cardelli, J. A., Clayton, G. C., & Mathis, J. S. 1989, ApJ, 345, 245
- Cellone et al. (2007) Cellone, S. A., Romero, G. E., & Araudo, A. T. 2007, MNRAS, 374, 357
- Chandra et al. (2011) Chandra, S., Baliyan, K. S., Ganesh, S., & Joshi, U. C. 2011, ApJ, 731, 118
- Chatterjee et al. (2012) Chatterjee, R., Bailyn, C. D., Bonning, E. W., et al. 2012, ApJ, 749, 191
- Chevalier et al. (2015) Chevalier, J., Kastendieck, M. A., Rieger, F., et al. 2015, arXiv:1509.03104
- Dermer et al. (2014) Dermer, C. D., Cerruti, M., Lott, B., Boisson, C., & Zech, A. 2014, ApJ, 782, 82 +
- Gaskell (2004) Gaskell, C. M. 2004, ApJ, 612, L21
- Ghisellini et al. (2014) Ghisellini, G., Tavecchio, F., Maraschi, L., Celotti, A., & Sbarrato, T. 2014, Nature, 515, 376
- Giebels & Degrange (2009) Giebels, B., & Degrange, B. 2009, A&A, 503, 797
- Gierliński et al. (2008) Gierliński, M., Middleton, M., Ward, M., & Done, C. 2008, Nature, 455, 369
- Hada et al. (2013) Hada, K., Kino, M., Doi, A., et al. 2013, ApJ, 775, 70
- H.E.S.S. Collaboration et al. (2010) H.E.S.S. Collaboration, Abramowski, A., Acero, F., et al. 2010, A&A, 520, A83
- Kadowaki et al. (2015) Kadowaki, L. H. S., de Gouveia Dal Pino, E. M., & Singh, C. B. 2015, ApJ, 802, 113
- Kalberla & Haud (2015) Kalberla, P. M. W., & Haud, U. 2015, A&A, 578, A78
- Kataoka et al. (2008) Kataoka, J., Madejski, G., Sikora, M., et al. 2008, ApJ, 672, 787
- Körding et al. (2006) Körding, E. G., Jester, S., & Fender, R. 2006, MNRAS, 372, 1366
- Kushwaha et al. (2014) Kushwaha, P., Singh, K. P., & Sahayanathan, S. 2014, ApJ, 796, 61
- Kushwaha et al. (2013) Kushwaha, P., Sahayanathan, S., & Singh, K. P. 2013, MNRAS, 433, 2380
- Lister et al. (2013) Lister, M. L., Aller, M. F., Aller, H. D., et al. 2013, AJ, 146, 120
- Mannheim (1998) Mannheim, K. 1998, Science, 279, 684
- McHardy (2008) McHardy, I. 2008, Blazar Variability across the Electromagnetic Spectrum, 14
- McHardy et al. (2006) McHardy, I. M., Koerding, E., Knigge, C., Uttley, P., & Fender, R. P. 2006, Nature, 444, 730
- McHardy et al. (2004) McHardy, I. M., Papadakis, I. E., Uttley, P., Page, M. J., & Mason, K. O. 2004, MNRAS, 348, 783
- Mücke et al. (2003) Mücke, A., Protheroe, R. J., Engel, R., Rachen, J. P., & Stanev, T. 2003, Astroparticle Physics, 18, 593
- Nakagawa & Mori (2013) Nakagawa, K., & Mori, M. 2013, ApJ, 773, 177
- Nalewajko (2013) Nalewajko, K. 2013, MNRAS, 430, 1324
- Negoro & Mineshige (2002) Negoro, H., & Mineshige, S. 2002, PASJ, 54, L69
- Potter & Cotter (2015) Potter, W. J.,& Cotter, G. 2015, MNRAS, 453, 4070
- Remillard & McClintock (2006) Remillard, R. A., & McClintock, J. E. 2006, ARA&A, 44, 49
- Sahayanathan & Godambe (2012) Sahayanathan, S., & Godambe, S. 2012, MNRAS, 419, 1660
- Schlafly & Finkbeiner (2011) Schlafly, E. F., & Finkbeiner, D. P. 2011, ApJ, 737, 103
- Singal (2015) Singal, J. 2015, MNRAS, 454, 115
- Singal et al. (2012) Singal, J., Petrosian, V., & Ajello, M. 2012, ApJ, 753, 45
- Sobolewska et al. (2014) Sobolewska, M. A., Siemiginowska, A., Kelly, B. C., & Nalewajko, K. 2014, ApJ, 786, 143
- Stecker & Salamon (1996) Stecker, F. W., & Salamon, M. H. 1996, ApJ, 464, 600
- Stecker & Venters (2011) Stecker, F. W., & Venters, T. M. 2011, ApJ, 736, 40
- Uttley et al. (2005) Uttley, P., McHardy, I. M., & Vaughan, S. 2005, MNRAS, 359, 345
- Vaughan et al. (2003) Vaughan, S., Edelson, R., Warwick, R. S., & Uttley, P. 2003, MNRAS, 345, 1271
- Zhang (2007) Zhang, S. N. 2007, Highlights of Astronomy, 14, 41