In-gas-cell laser spectroscopy for magnetic dipole moment of 199Pt toward 126
Abstract
Magnetic dipole moment and mean-square charge radius of 199Pt ( 5/2-) have been evaluated for the first time from the investigation of the hyperfine splitting of the 248.792 nm transition by in-gas-cell laser ionization spectroscopy. Neutron-rich nucleus 199Pt was produced by multi-nucleon transfer reaction at the KISS where the nuclear spectroscopy in the vicinity of 126 is planed from the aspect of an astrophysical interest as well as the nuclear structure. Measured magnetic dipole moment 0.63(13) is consistent with the systematics of those of nuclei with 5/2-. The deformation parameter evaluated from the isotope shift indicates the gradual shape change to spherical shape of platinum isotopes with increasing neutron number toward 126.
pacs:
21.10.Ky \sep21.10.Ft \sep27.80.+w \sep42.62.FiI INTRODUCTION
Allowed Gamow-Teller (GT) and first-forbidden (FF) beta-decay transitions compete in the nuclei around = 126, depending on the shell evolution at increasing the number of neutrons. The proton orbit of the neutron-rich nuclei around 126 would be , therefore, the GT transition from to , and the FF transition from to would be competitive. This makes it difficult to predict nuclear properties such as the half-life and nuclear mass in the neutron-rich nuclei around 126 by theoretical nuclear models Borzov (2003); Mller et al. (2003); Koura et al. (2005). Therefore, the half-lives are largely deviated by one order of magnitude Mller et al. (1997); Engel et al. (1999); Martinez-Pinedo (2001); Langanke and Martinez-Pinedo (2003); KUTY . The half-lives play an important role to investigate an astrophysical environment for the formation of the third peak in an observed solar r-process abundance pattern Burbidge et al. (1957); Mumpower et al. (2016). Because the abundance peak height around 195 is proportional to the half-lives, and the peak position and width drastically change according to the half-lives. The experimental nuclear spectroscopy are desirable for eliminating the uncertainty and improving the predictions by nuclear models taking into account the FF transition.
The study of nuclear structure toward 126 through electromagnetic moments has been intensively performed by various techniques suitable for the nuclear properties such as half-life, level energy and decay modes Stone (2011). The nuclear wave-function and shape can be evaluated from the measured magnetic dipole moment () and quadrupole moment (), respectively. Especially, the understanding of the wave function on the ground state in this region is essential to provide the accurate prediction of GT and FF transition strength, namely, -decaying half-lives. However, the difficulty of the production of the nuclei in the vicinity of 126 causes the lack of the electromagnetic moments. In order to break through the situation, we have started KISS project Jeong et al. (2010). In the project, the nuclei around 126 are produced by multi-nucleon transfer (MNT) reaction Dasso et al. (1994) of 136Xe beam and 198Pt target system Watanabe et al. (2015), and are selected by an argon gas-cell based laser ion source combined with on-line isotope separator (KISS) Hirayama et al. (2015, 2016). The electromagnetic moments can be measured by in-gas-cell and -gas-jet laser ionization spectroscopy (IGLIS) Cocolios et al. (2010); Ferrer et al. (2014); Kudryavtsev et al. (2013).
By taking the advantage of the MNT reaction combined with the KISS, we have started to produce the neutron-rich isotopes of the refractory elements such as Pt, Ir, Os, Re, W and Ta, and perform the nuclear spectroscopy systematically. The search for the laser resonance ionization scheme of the refractory elements has been in progress Hirayama et al. (2014); Mukai et al. (2015, 2016). As a first step, the measurement of the magnetic dipole moment of 199Pt ( 78, 121, 5/2-, and 30.8(2) min.) Firestone (1996) was performed by in-gas-cell laser ionization spectroscopy. Nuclear structure of platinum isotopes with 178 198 have been well studied through the measured and , isotope shift (IS) and charge radius by the laser spectroscopy Lee et al. (1988); Duong et al. (1989); Hilberath et al. (1992); Kilcher et al. (1992); Blanc et al. (1999). In the lighter, neutron-deficient, region of 178183, shape coexistence was found and discussed from the IS Blanc et al. (1999). On the other hand, in the heavier region of 183198, the prolate (183188), triaxial shape (190194) and oblate (196 198) shapes were discussed and compared with theoretical models Lee et al. (1988); Duong et al. (1989); Hilberath et al. (1992); Kilcher et al. (1992). In the more neutron-rich region, spherical shape would become dominant toward the shell-closure of 126 in the same way as lead ( 82) and mercury ( 80) isotopes Witte1 et al. (2007) predicted by the droplet model Myers and Schmidt (1983) with 0. In this paper, we report the experimental details and the results for the in-gas-cell laser ionization spectroscopy to determine the magnetic dipole moment of neutron-rich 199Pt.
II EXPERIMENT
II.1 Principle of laser spectroscopy for deducing nuclear electromagnetic moments
Laser spectroscopy is powerful tool to determine nuclear electromagnetic moments through the investigation of hyperfine levels governed by quantum number . The possible values are in the range of where and are nuclear and atomic spins, respectively. According to values, if 1/2, the degenerated atomic energy levels are resolved and changed by which is denoted as following;
| (1) | |||||
Here, and are the magnetic-dipole and electric-quadrupole hyperfine coupling constants, respectively. These factors are represented to be
| (2) |
and
| (3) |
respectively. The and factors are related to the nuclear magnetic dipole moment and nuclear electric quadrupole moment , respectively. and are the magnetic field and the electric field gradient, respectively, induced by the atomic electrons at the position of the nucleus. and are specific to each atomic state, and are common for isotopes. Therefore, nuclear electromagnetic moments can be evaluated from the measured and factors by using the known and factors, , , and of specific isotope (generally stable isotope) as follows;
| (4) |
and
| (5) |
The atomic energy changes of and at the ground and excited states occur, respectively, as a result of hyperfine interaction between the nucleus and atomic electrons. The transition frequency between the hyperfine levels of the ground and excited states shifts to be
| (6) |
relative to the center of gravity of the fine-structure transition-frequency . From the laser spectroscopy for the measurement of the hyperfine splitting expressed by the values, the hyperfine coupling constants and , namely, electromagnetic moments and , can be evaluated.
II.2 Experimental details
II.2.1 KISS
The experiment was performed using KEK isotope separation system (KISS) Hirayama et al. (2015, 2016), argon gas-cell based laser ion source combined with on-line isotope separator, installed in RIKEN Nishina center. Primary beam 136Xe (10.75 MeV/, 20 particle-nA), accelerated by RIKEN Ring Cyclotron, impinged on an enriched 198Pt (purity 91.63%) target with a thickness of 11 mg/cm2. Unstable nucleus 199Pt was produced by multi-nucleon transfer reaction Watanabe et al. (2015), and stable nucleus 198Pt was also emitted from the target by an elastic reaction with 136Xe. At an off-line test to study the systematics of the laser ionization for platinum isotopes, the stable platinum isotopes of 192,194,195,196,198Pt were produced from the resistive heating of a natural platinum filament placed in the gas cell.
The platinum isotopes were accumulated, thermalized and neutralized in the argon gas cell with a pressure of 88 kPa, whose design was optimized for the high efficient gas-flow transport Hirayama et al. (2015). The isotopes were re-ionized in the gas cell by two-step resonant laser ionization technique, and the atomic number can be selected. The laser-produced singly-charged ( 1) platinum ions were extracted with an energy of 20 kV, and their mass-to-charge ratio () was selected by a dipole magnet. Finally, one kind of isotope was transported to the detector station placed at the neighboring experimental hall to the gas cell system.
The detector station includes a tape transport device for avoiding the radioactivities in the decay chain of separated nuclides under pulsed beam operation of the KISS. The radioactive isotope was implanted on an aluminized Mylar tape surrounded by three sets of two-layered plastic-scintillator telescopes with 50% detection efficiency Kimura et al. (2016). The tape was moved to remove unwanted -rays at the end of each measurement cycle. The ions of the stable isotopes were counted by using a Channeltron detector.
II.2.2 Laser ionization
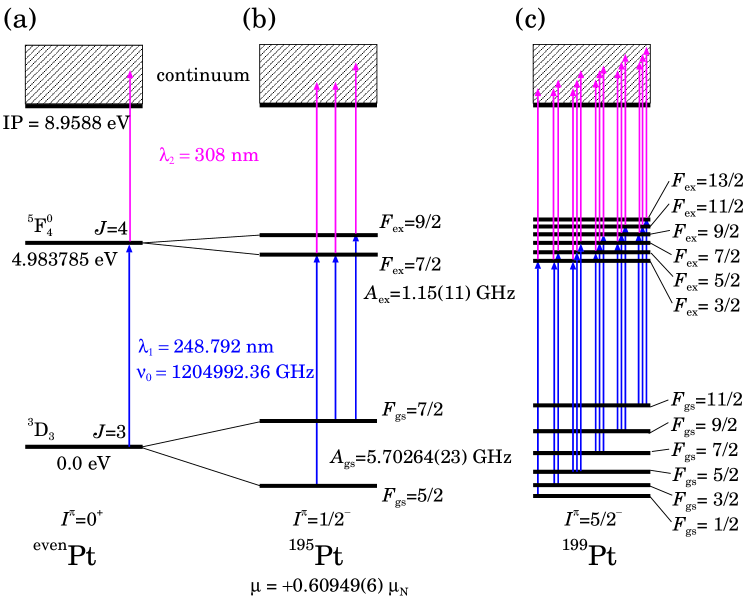
Figure 1 shows the ionization scheme and hyperfine structure of platinum isotopes. Tunable dye laser (Radiant Dye Laser; NarrowScan) pumped by XeCl:excimer laser ( 308 nm, Lambda Physik LPX240i) was utilized for the first step excitation ( 248.792 nm) with laser power 70 J/pulse. Another XeCl excimer laser of 308 nm with laser power 9 mJ/pulse was used as the ionization transition to continuum above the ionization potential (IP). In the present laser ionization spectroscopy, the transition between the ground state 5d96s3D3 and the excited state 5d86s6p5F was studied by scanning the wavelength . The systematic study concerning the gas-pressure effects was performed by using stable platinum isotopes with mass number 192, 194, 195, 196, and 198. Pressure broadening and shift in the range of 11–88 kPa were studied to be 39(3) MHz/kPa and 22(2) MHz/kPa, respectively. Isotope shifts for the stable platinum isotopes were also studied.
The excimer lasers were operated at a repetition rate of up to 200 Hz and were synchronized by master trigger signals from a function generator. To produce a UV laser beam as first step light, radiation delivered by the NarrowScan was frequency doubled using a barium borate (BBO) crystal placed in a second-harmonic generator. The typical linewidth and pulse width of the dye lasers were 3.4 GHz and 15 ns, and the wavelength was monitored by a wave-meter WS6 (HighFinesse). The 10% of UV laser power through a laser beam splitter was monitored during the experiment. The distance between the laser system and the gas cell is about 15 m. Both laser beams with the size of about 8–10 mm in diameter are transported to the gas cell with a small angle, and are overlapped in the gas cell for resonance ionization, spatially and temporally. The laser spots through the gas cell was checked by using a camera in order to keep the spatial overlap by adjusting the mirrors with actuators. The timing signals from photodetectors were measured by an oscilloscope in order to maintain temporal overlap of the two lasers by adjusting the master trigger signal in 1–ns steps. The spatial and temporal overlapping were always monitored and adjusted if necessary.
III EXPERIMENTAL RESULTS AND DISCUSSION
III.1 Identification of 199Pt nucleus
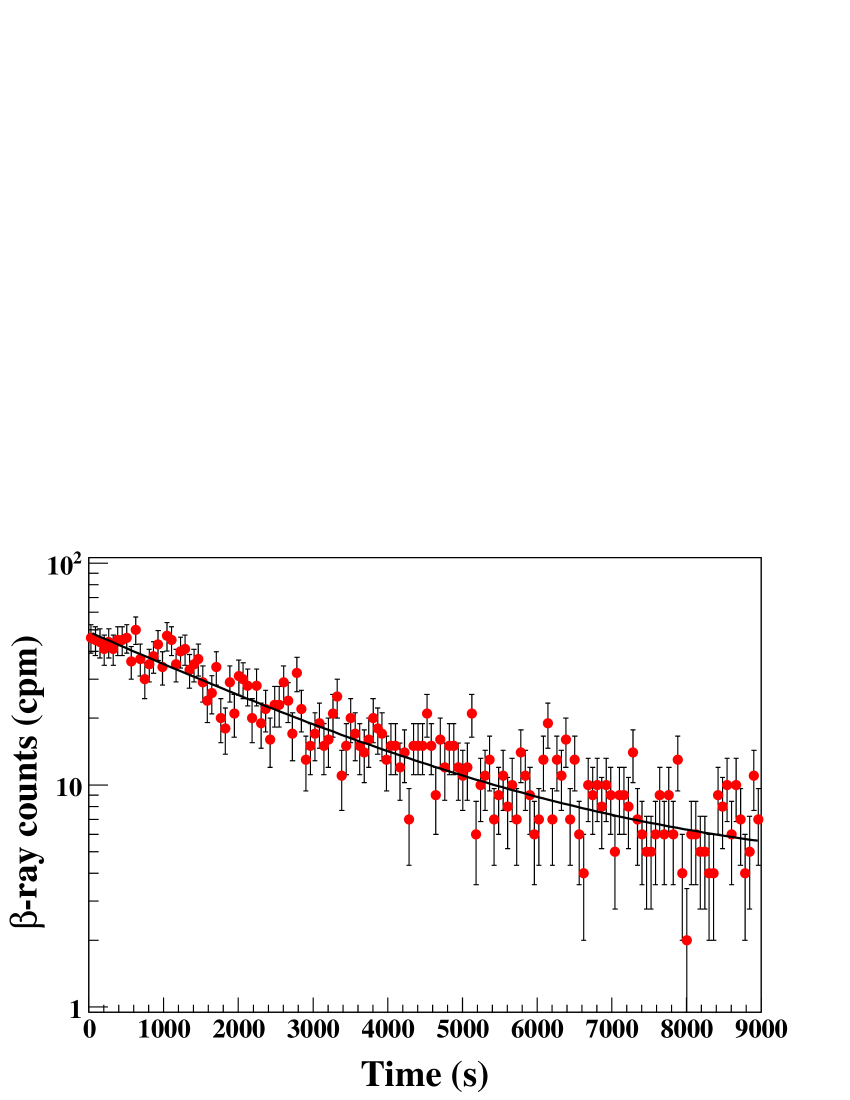
In the experiment, the laser-ionized 198Pt+ was used to adjust the beam line optics at first. Then, the extraction of laser-ionized radioactive isotope 199Pt+ was performed only by changing the magnetic field of the dipole magnet. Identification of 199Pt+ nucleus ( 30.8 0.2 min. Firestone (1996)) was done by measuring the -decay half-life as shown in Fig. 2. After 30 min. irradiation of 199Pt+ beam on the tape, the decay curve was measured during 2.5 hours ( 5 ). Solid line in Fig. 2 is the best fit result obtained by using the fitting routine of MINUIT code MIN , and the fitting function consists of single exponential function (free parameters of amplitude and ) and constant background. Measured half-life 31.3 1.5 min. was in good agreement with the literature value 30.8(2) min. This result indicates that measured -rays were emitted from only 199Pt+ extracted from the gas cell.
III.2 Extraction yield of 199Pt nucleus
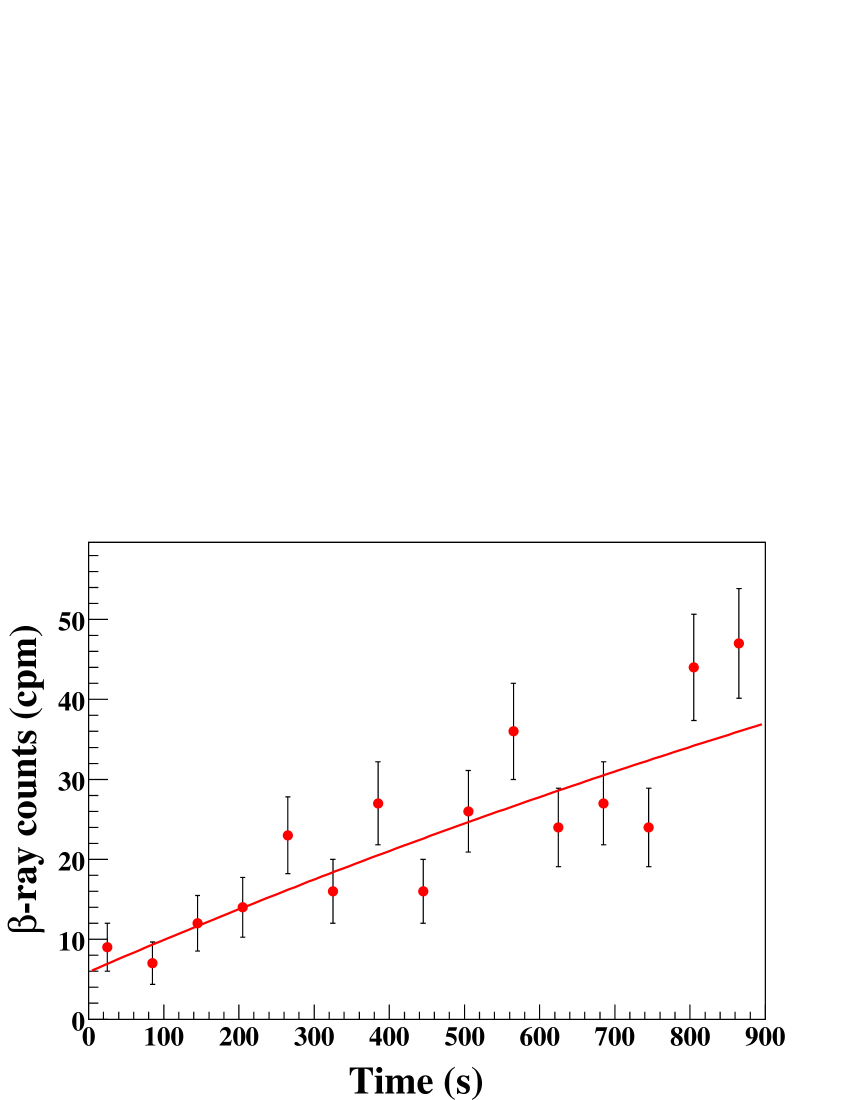
In the present experiment, the relative extracted yield of 199Pt nucleus was measured as a function of wavelength of , and the hyperfine splitting was studied to evaluate the magnetic dipole moment. Relative extraction yield was deduced from the growth curve during 15 min. irradiation as shown in Fig. 3. Solid line in Fig. 3 is the best fit result, and the fitting function consists of single exponential function (free parameter of amplitude ) and constant background. The fluctuations of the primary beam intensity, laser powers, wavelength within 0.2 pm, spacial and temporal overlapping influenced the number of measured -rays emitted from 199Pt nucleus. The growth curve in Fig. 3 reflected the fluctuations, and, therefore, the evaluated and its error take the fluctuations into account automatically. The and were normalized by the measured primary beam dose during each measurement.
III.3 Data analysis of hyperfine splitting
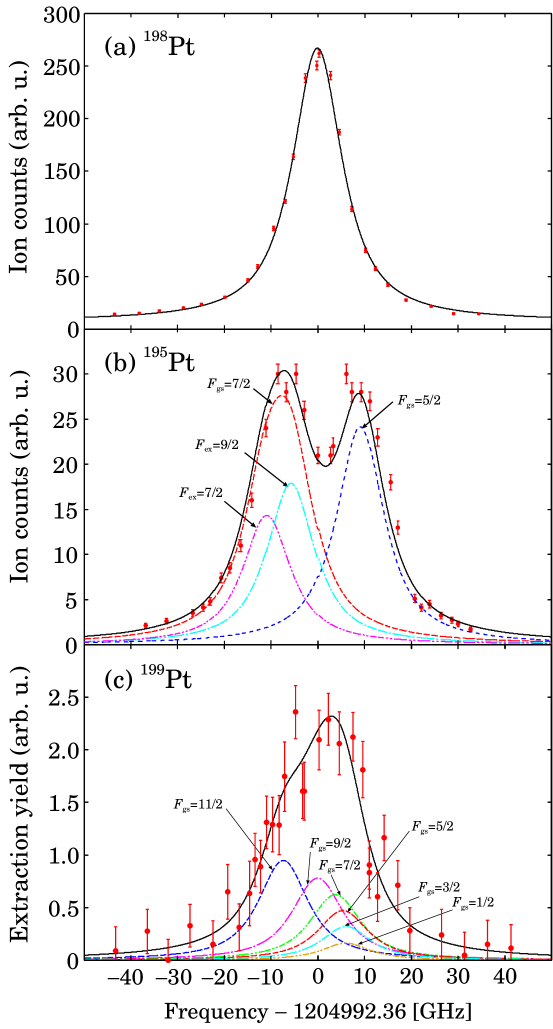
Figure 4 shows the measured hyperfine splittings of 198,195,199Pt nuclei extracted from the KISS. The line shape of a resonance peak was determined from the fit of the measured single peak of 198Pt (0+) as shown in Fig. 4–(a). The factor for the excited state 5d86s6p5F was deduced for the first time from the spectrum analysis of 195Pt (1/2- and 0.60949(6) Hilberath et al. (1992)) in Fig. 4–(b). In order to determine magnetic dipole moment and IS , the deduced line shape and factor were applied for the spectrum analysis of 199Pt (5/2-) in Fig. 4–(c). The details of the analysis are discussed at the following subsections.
III.3.1 Line shape
There is no hyperfine splitting for 198Pt with 0+ as shown in Fig. 1–(a), and, therefore, a single resonance peak was observed as shown in Fig. 4–(a). The line shape is Voigt function which is composed of the convolution of Gaussian and Lorentzian components. The line shape, as shown in Fig. 4–(a), is governed mainly by Lorentzian components in the present experiment. The two Gaussian components are Doppler broadening governed by the argon gas temperature and laser linewidth, whose width in FWHM were evaluated to be 1.0 GHz at 300 K and 3.4 GHz, respectively. As a result, total Gaussian width of 3.5 GHz was obtained and used as a fixed parameter in all fits. Lorentzian components consist of gas-pressure broadening, laser-power broadening, and the natural width 63 MHz of the present transition. The width of Lorentzian components was free parameter in the fitting, and was deduced to be 11.8(4) GHz. As a result, total FWHM 12.8(4) GHz was obtained. The measured line shape of 198Pt at the on-line experiment was applied to other isotopes as the fixed parameter for the fitting of the spectra. All fits in the present analysis were performed by using the MINUIT code MIN .
III.3.2 Hyperfine coupling constant
The hyperfine splitting of 195Pt with 1/2- and 0.60949(6) Firestone (1996) is governed by and factors, and there are three transitions as shown in Fig. 1–(b). was precisely measured to be 5.70264(23) GHz Bttgenbach et al. (1984). However, of the excited level was unknown. The fit to the measured spectrum of 195Pt in Fig. 4–(b) is able to provide the factor. The line shape of the three transitions are unity, and each resonance peak position presented by Eq. (6) depends on the factor (here, 0), which was free as the fitting parameter.
Another important parameter is an amplitude of each resonance peak. In order to reduce the fitting parameters and constrain the amplitude, the relative intensity Kster et al. (2011) for each transition was applied in the present analysis. The relative intensities of the transitions from the 5/2 and 7/2 levels are in proportion to the statistical weights (2 1), and are assumed to be 6/14 and 8/14, respectively. In the present experiment, both 7/2 and 9/2 levels would be populated by two transitions from 7/2 simultaneously due to the broad line shape. The relative intensities for the transitions 7/2 7/2 and 9/2 are also in proportion to the statistical weights (2 1), and are estimated to be 8/18 and 10/18, respectively. Finally, the relative intensities for the three transitions of 5/2 7/2, 7/2 7/2, and 7/2 9/2 are constrained to be 6/14, 8/148/18, and 8/1410/18, respectively, and one fitting parameter for the amplitude was used.
The solid black line indicates the best fit to the spectrum in Fig. 4, taking into account the isotope shift as the fixed parameter. The IS value was evaluated from the measured ones by using 192,194,196,198Pt isotopes, considering the linear relation of the isotope shift Duong et al. (1989); Hilberath et al. (1992). The 1.15 0.11 GHz was obtained as a best fit result. Even though the experimental conditions such as gas pressure and laser power of were different, the deduced factor was consistent with each other. The factor was used for the spectrum analysis of 199Pt isotope.
III.3.3 Magnetic dipole moment of 199Pt
Fig. 4–(c) shows the measured hyperfine structure of 199Pt. Relative extraction yields as mentioned in Sec. III.2 were measured as a function of . In order to confirm the consistency of the yield during the long-run measurement, the three-times frequency-scanning in the range 40 GHz were performed. Finally, the consistency of the measured yield was confirmed.
The hyperfine splitting of 1/2–11/2 and 3/2–13/2 for 199Pt with 5/2 is governed by and factors of the ground and excited states, and there are 15 transitions as shown in Fig. 1. Each resonance peak position presented by Eq. (6) depends on unknown , , factor, and (shift from the center of the gravity 1204992.36 GHz) , which were free as the fitting parameters. Here, the factor of the ground state is related to the by GHz from Ref. Hilberath et al. (1992), and this equation was used in the fitting. The line shape for each transition was fixed to that evaluated from 198Pt, and the relative intensities of the 15 transitions were constrained by using the statistical weights of (2 1) and (2 1) in the same manner as the fitting procedure of 195Pt.
The solid black line indicates the best fit to the spectrum in Fig. 4. Measured , and were 0.63 0.13(stat.) 0.03(syst.) , 2.7 3.0 b, 1.8 9.4 GHz, respectively. Here, the fitting errors were corrected by the square root of reduced 1.14 of the fitting. The systematic error stems from the ambiguity of the width of the line shape and . The width of the spectrum is mainly governed by the magnetic dipole moment of 199Pt nucleus. Therefore, it was possible to deduce the value. The and were insensitive to the spectrum fitting. Even though the and were artificially assumed to be 0, this affects the deviation 0.015 which is negligible in considering the present error.
Table. 1 shows the systematics of magnetic dipole moments of nuclei with 5/2-. 5/2- is determined by one valence neutron in 2 orbit, whose Schmidt value is evaluated to 1.366 . Although the present 0.63(13) is smaller than the systematics of about 0.85 for the nuclei, it is consistent with the systematics by taking the error into account. The values in Table. 1 is about 60% of Schmidt value. This indicates that large configuration mixing exists in the wave-function of these states.
| Nuclide | (keV) | () | (b) | Method | Ref. | ||
|---|---|---|---|---|---|---|---|
| Pt | 5/2- | 30.8(2) min. | 0 | 0.630.13(stat.)0.03(syst.) | -2.73.0 | IGLIS | Present work |
| Pt | 5/2- | 0.67(3) ns | 130 | 0.875(100) | - | Mssbauer | Wolbeck and Zioutas (1972) |
| Pt | 5/2- | 16.58(17) ns | 53.088 | 0.85(3) | - | TDPAC | Saxena and Soares (1981) |
| Hg | 5/2- | 8.066(8) ns | 134 | 0.855(15) | 0.081(6) | TDPAC | Krien et al. (1977) |
| Hg | 5/2- | 2.45(5) ns | 158 | 0.880(33) | 0.95(7) | TDPAC | Krien et al. (1977) |
III.3.4 Isotope shift and deformation parameter of 199Pt
Measured isotope shift (IS) between 198Pt and 199Pt was 0.98 0.48 GHz. Table 2 shows the summary of the measured isotope shifts of the wavelength 248.792 nm, isotopic variation of the mean-square charge radius from Ref. Hilberath et al. (1992), and quadrupole deformation parameters calculated by using the droplet model Myers and Schmidt (1983). The IS between two isotopes with mass number and is expressed as
| (7) | |||||
Here, and are factors for normal (NMS) and specific (SMS) mass shift components, respectively. The term is the field shift (FS) component expressed by using the electronic factor for the transition 248.792 nm and the isotopic variation of the mean-square charge radius .
In order to deduce from measured , the Eq. (7) can be practically modified as follows;
| (8) | |||||
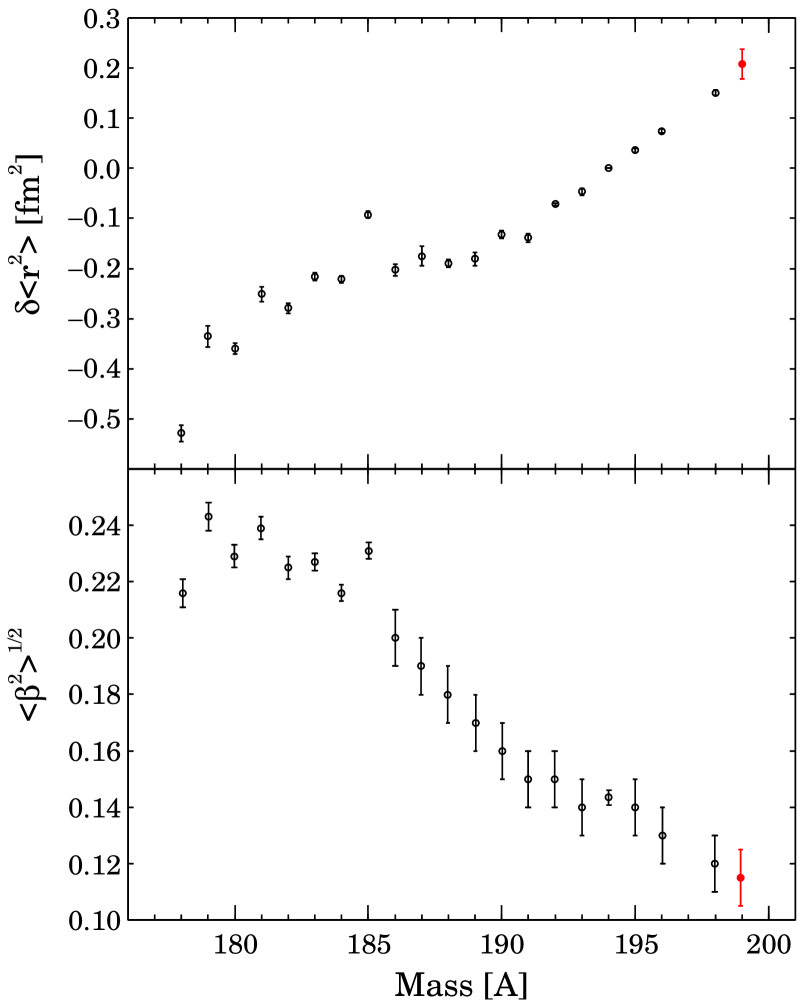
Here, . If both and for stable isotopes were known, and can be evaluated for deducing the from measured . Generally, the term of the mass shift ( a few 10 MHz) is about two order of magnitude smaller than the term of the field shift ( a few GHz) in the present high 78 region Blaum et al. (2013), and the mass shift term can be negligible in the present case. The factor was evaluated to 17.0 1.8 GHz/fm2 from the fit using Eq. (8) between the measured and the reported Hilberath et al. (1992) for evenPt in Table 2. Finally, the 0.057(29) fm2 ( 0.208(30)) was obtained from the 0.98(48) GHz. Figure 5 shows the mean square charge radius variation of the platinum isotopes Hilberath et al. (1992); Blanc et al. (1999). The evaluated shows the linear relation of platinum isotopes with 193 198.
Model-dependent quadrupole deformation parameter can be extracted from the measured and . The details of the extraction procedure and the utilization for the platinum isotopes were reported in Ref. Ahmad et al. (1985) and Ref. Hilberath et al. (1992), respectively. The evaluated parameters and were listed in Table 2. The absolute deformation parameter for 199Pt was evaluated from the relation of . Here, the parameter was deduced by using the precisely measured (2,2 0+) value of 194Pt Raman et al. (1989), and the evaluated parameters were in good agreement with the known (2) values Raman et al. (1989) for evenPt. The evaluated also shows the linear relation of platinum isotopes with 193 198. The for 199Pt becomes smaller with increasing neutron number toward 126 as shown in Fig. 5, indicating the spherical shape for platinum isotope with 126.
| [GHz] | [fm2] | |||
|---|---|---|---|---|
| 199 | 0.98(48)a | 0.208(30)b | 0.067(10)b | 0.115(10)b |
| 198 | 2.43(23)b | 0.151(6) | 0.0050(7) | 0.12(1) |
| 196 | 1.39(27)b | 0.074(4) | 0.0027(3) | 0.13(1) |
| 194 | 0.000 | 0.000 | 0.000 | 0.1434(26) |
| 192 | 1.43(27)b | 0.072(3) | 0.0033(9) | 0.15(1) |
a Present work : measured isotope shift .
b Present work
IV SUMMARY
Neutron-rich nucleus 199Pt ( 5/2-) was produced by multi-nucleon transfer reaction at the KISS, where the nuclear spectroscopy around 126 have been performed from the aspect of an astrophysical interest as well as the nuclear structure. Magnetic dipole moments provide the crucial information about the nuclear wave-function, which is essential for the understanding of the competition between allowed Gamow-Teller (GT) and first-forbidden (FF) beta-decay transitions in the nuclei around = 126.
By in-gas-cell laser ionization spectroscopy performed at the KISS, magnetic dipole moment and mean-square charge radius variation of 199Pt have been determined for the first time to be 0.63(13) and 0.208(30) fm2. Measured magnetic dipole moment is consistent with the systematics of those of nuclei with 5/2-. The evaluated parameters and were consistent with the linear relation of platinum isotopes with 193 198. The behavior with increasing neutron number toward 126 would indicate the shape change to spherical shape of platinum isotopes.
By taking the advantage of the MNT reaction combined with the KISS, systematical nuclear spectroscopy is planed for the neutron-rich isotopes of the refractory elements such as Pt, Ir, Os, Re, W and Ta.
Acknowledgements.
This experiment was performed at RI Beam Factory operated by RIKEN Nishina Center and CNS, the University of Tokyo. The authors acknowledge the staff of the accelerator for their support. This work has been supported by Grant-in-Aids for Scientific Research (A) (grant no. 23244060, 26247044 and 15H02096) and for young scientists (B) (grant no. 24740180) from the Japan Society for the Promotion of Science (JSPS).References
- Borzov (2003) I. N. Borzov, Phys. Rev. C 67, 025802 (2003).
- Mller et al. (2003) P. Mller, B. Pfeiffer, and K.-L. Kratz, Phys. Rev. C 67, 055802 (2003).
- Koura et al. (2005) H. Koura, T. Tachibana, M. Uno, and M. Yamada, Prog. Theor. Phys. 113, 305 (2005).
- Mller et al. (1997) P. Mller, J. R. Nix, and K.-L. Kratz, At. Data Nucl. Data Tables 66, 131 (1997).
- Engel et al. (1999) J. Engel, M. Bender, J. Dobaczewski, W. Nazarewicz, and R. Surman, Phys. Rev. C 60, 014302 (1999).
- Martinez-Pinedo (2001) G. Martinez-Pinedo, Nucl. Phys. A 688, 357c (2001).
- Langanke and Martinez-Pinedo (2003) K. Langanke and G. Martinez-Pinedo, Rev. Mod. Phys. 75, 819 (2003).
- (8) KUTY, http://wwwndc.jaea.go.jp/nucldata/beta-decay-properties.pdf .
- Burbidge et al. (1957) E. M. Burbidge, G. R. Burbidge, W. A. Fowler, and F. Hoyle, Rev. Mod. Phys. 29, 547 (1957).
- Mumpower et al. (2016) M. R. Mumpower, R. Surman, G. C. McLaughlin, and A. Aprahamian, Prog. Part. Nucl. Phys. 86, 86 (2016).
- Stone (2011) N. J. Stone, Table of Nuclear Magnetic Dipole and Electric Quadrupole Moments (2011).
- Jeong et al. (2010) S. C. Jeong, N. Imai, H. Ishiyama, Y. Hirayama, H. Miyatake, and Y. X. Watanabe, KEK Report 2010-2 (2010).
- Dasso et al. (1994) C. H. Dasso, G. Pollarolo, and A. Winther, Phys. Rev. Lett. 73, 1907 (1994).
- Watanabe et al. (2015) Y. X. Watanabe, Y. H. Kim, S. C. Jeong, Y. Hirayama, N. Imai, H. Ishiyama, H. S. Jung, H. Miyatake, S. Choi, J. S. Song, E. Clement, G. de France, A. Navin, M. Rejmund, C. Schmitt, G. Pollarolo, L. Corradi, E. Fioretto, D. Montanari, M. Niikura, D. Suzuki, H. Nishibata, and J. Takatsu, Phys. Rev. Lett. 115, 172503 (2015).
- Hirayama et al. (2015) Y. Hirayama, Y. X. Watanabe, N. Imai, H. Ishiyama, S. C. Jeong, H. Miyatake, M. Oyaizu, S. Kimura, M. Mukai, Y. H. Kim, T. Sonoda, M. Wada, M. Huyse, Y. Kudryavtsev, and P. V. Duppen, Nucl. Instrum. Methods Phys. Res. B 353, 4 (2015).
- Hirayama et al. (2016) Y. Hirayama, Y. X. Watanabe, N. Imai, H. Ishiyama, S. C. Jeong, H. S. Jung, H. Miyatake, M. Oyaizu, S. Kimura, M. Mukai, Y. H. Kim, T. Sonoda, M. Wada, M. Huyse, Y. Kudryavtsev, and P. V. Duppen, Nucl. Instrum. Methods Phys. Res. B 376, 52 (2016).
- Cocolios et al. (2010) T. E. Cocolios, A. N. Andreyev, B. Bastin, N. Bree, J. Bscher, J. Elseviers, J. Gentens, M. Huyse, Y. Kudryavtsev, D. Pauwels, T. Sonoda, P. V. den Bergh, and P. V. Duppen, Phys. Rev. C 81, 014314 (2010).
- Ferrer et al. (2014) R. Ferrer, N. Bree, T. E. Cocolios, I. G. Darby, H. D. Witte, W. Dexters, J. Diriken, J. Elseviers, S. Franchoo, M. Huyse, N. Kesteloot, Y. Kudryavtsev, D. Pauwels, D. Radulov, T. Roger, H. Savajols, P. V. Duppen, and M. Venhart, Phys. Lett. B 728, 191 (2014).
- Kudryavtsev et al. (2013) Y. Kudryavtsev, R. Ferrer, M. Huyse, P. V. den Bergh, and P. V. Duppen, Nucl. Instrum. Methods Phys. Res. B 297, 7 (2013).
- Hirayama et al. (2014) Y. Hirayama, M. Mukai, Y. X. Watanabe, N. Imai, H. Ishiyama, S. C. Jeong, H. Miyatake, M. Oyaizu, Y. Matsuo, T. Sonoda, and M. Wada, J. Phys. B 47, 075201 (2014).
- Mukai et al. (2015) M. Mukai, Y. Hirayama, N. Imai, H. Ishiyama, S. C. Jeong, H. Miyatake, M. Oyaizu, Y. X. Watanabe, Y. H. Kim, and S. Kimura, JPS. Conf. Proc. 6, 030127 (2015).
- Mukai et al. (2016) M. Mukai, Y. Hirayama, H. Ishiyama, H. S. Jung, H. Miyatake, M. Oyaizu, Y. X. Watanabe, S. Kimura, A. Ozawa, S. C. Jeong, and T. Sonoda, Nucl. Instrum. Methods Phys. Res. B 376, 73 (2016).
- Firestone (1996) R. B. Firestone, Table of Isotopes (John Wiley & Sons, Inc., 1996).
- Lee et al. (1988) J. K. P. Lee, G. Savard, J. E. Crawford, G. Thekkadath, H. T. Duong, J. Pinard, S. Liberman, F. L. Blanc, P. Kilcher, J. Obert, J. Oms, J. C. Putaux, B. Roussire, and J. Sauvage, Phys. Rev. C 38, 2985 (1988).
- Duong et al. (1989) H. T. Duong, J. Pinard, S. Liberman, G. Savard, J. K. P. Lee, J. E. Crawford, G. Thekkadath, F. L. Blanc, P. Kilcher, J. Obert, J. Oms, J. C. Putaux, B. Roussire, J. Sauvage, and the ISOCELE Collaboration, Phys. Lett. B 217, 401 (1989).
- Hilberath et al. (1992) T. Hilberath, S. Becker, G. Bollen, H.-J. Kluge, U. Krnert, G. Passler, J. Rikovska, R. Wyss, and the ISOLDE Collaboration, Z. Phys. A – Hadrons and Nuclei 342, 1 (1992).
- Kilcher et al. (1992) P. Kilcher, J. C. Putaux, J. E. Crawford, H. Dautet, H. T. Duong, F. L. Blanc, J. K. P. Lee, J. Obert, J. Oms, J. Pinard, B. Roussire, J. Sauvage, G. Savard, and G. Thekkadath, Nucl. Instrum. Methods Phys. Res. B 70, 537 (1992).
- Blanc et al. (1999) F. L. Blanc, D. Lunney, J. Obert, J. Oms, J. C. Putaux, B. Roussire, J. Sauvage, S. Zemlyanoi, J. Pinard, L. Cabaret, H. T. Duong, G. Huber, M. Krieg, V. Sebastian, M. G. adn S. Pru, and J. Genevey, Phys. Rev. C 60, 054310 (1999).
- Witte1 et al. (2007) H. D. Witte1, A. N. Andreyev, N. Barr, M. Bender, T. E. Cocolios, S. Dean, D. Fedorov, V. N. Fedoseyev, L. M. Fraile, S. Franchoo, V. Hellemans, P. H. Heenen, K. Heyde, G. Huber, M. Huyse, H. Jeppessen, U. Kster, P. Kunz, S. R. Lesher, B. A. Marsh, I. Mukha, B. Roussire, J. Sauvage, M. Seliverstov, I. Stefanescu, E. Tengborn, K. V. de Vel1, J. V. de Walle, P. V. Duppen, and Y. Volkov, Phys. Rev. Lett. 98, 112502 (2007).
- Myers and Schmidt (1983) W. D. Myers and K.-H. Schmidt, Nucl. Phys. A 410, 61 (1983).
- Kimura et al. (2016) S. Kimura, H. Ishiyama, H. Miyatake, Y. Hirayama, Y. X. Watanabe, H. S. Jung, M. Oyaizu, M. Mukai, S. C. Jeong, and A. Ozawa, Nucl. Instrum. Methods Phys. Res. B 376, 338 (2016).
- (32) CERN Program Library entry D506.
- Bttgenbach et al. (1984) S. Bttgenbach, N. Glaeser, B. Roski, and R. Trber, Z. Phys. A – Atoms and Nuclei 317, 237 (1984).
- Kster et al. (2011) U. Kster, N. J. Stone, K. T. Flanagan, J. R. Stone, V. N. Fedosseev, K. L. Kratz, B. A. Marsh, T. Materna, L. Mathieu, P. L. Mokkanov, M. D. Seliverstov, O. Serot, A. M. Sjdin, and Y. M. Volkov, Phys. Rev. C 84, 034320 (2011).
- Wolbeck and Zioutas (1972) B. Wolbeck and K. Zioutas, Nucl. Phys. A 181, 289 (1972).
- Saxena and Soares (1981) R. N. Saxena and J. C. Soares, Hyperfine Interact. 9, 93 (1981).
- Krien et al. (1977) K. Krien, K. Kroth, H. Saitovitch, and W. Thomas, Z. Phys. A 283, 337 (1977).
- Blaum et al. (2013) K. Blaum, J. Dilling, and W. Nrtershuser, Phys. Scr. T 152, 014017 (2013).
- Ahmad et al. (1985) S. Ahmad, W. Klempt, C. Ekstrm, R. Neugart, K. Wendt, and the ISOLDE collaboration, Z. Phys. A – Atoms and Nuclei 321, 35 (1985).
- Raman et al. (1989) S. Raman, J. Nestor, S. Kahane, and K. Bhatt, At. Data Nucl. Data Tables 42, 1 (1989).