∎
and Habib University
22email: qasim.pasta@sse.habib.edu.pk 33institutetext: F. Zaidi 44institutetext: Karachi Institute of Economics and Technology
44email: faraz.a.zaidi@ieee.org
Leveraging Evolution Dynamics to Generate Benchmark Complex Networks with Community Structures
Abstract
The past decade has seen tremendous growth in the field of Complex Social Networks. Several network generation models have been extensively studied to develop an understanding of how real world networks evolve over time. Two important applications of these models are to study the evolution dynamics and processes that shape a network, and to generate benchmark networks with known community structures. Research has been conducted in both these directions, relatively independent of the other. This creates a disjunct between real world networks and the networks generated as benchmarks to study community detection algorithms.
In this paper, we propose to study both these application areas together. We introduce a network generation model which is based on evolution dynamics of real world networks and, it can generate networks with community structures that can be used as benchmark graphs. We study the behaviour of different community detection algorithms based on the proposed model and compare it with other models to generate benchmark graphs. Results suggest that the proposed model can generate networks which are not only structurally similar to real world networks but can be used to generate networks with varying community sizes and topologies.
Keywords:
Network Generation Models Benchmark Graphs Community Detection Small World Networks Scale Free Networks1 Introduction
The field of complex networks became popular from the late 1990’s after the ground breaking discoveries of structural characteristics of small worldwatts98 and scale free networksbarabasi99 . Since then, researchers have actively pursued the development of network generation models to mimic the creation and evolution of complex networks emerging from a variety of real world interconnected systems. These models also provide an understanding of other structural characteristics such as assortative mixingnewman02 , presence of hierarchical structuresgilbert11 , presence of communitiesferrara12 and likelihood of connection between similar objects. There is substantial interest in using these synthetic networks to examine the impact of different dynamic processes on these networks like epidemic spreadingpastor01 ; liang13 and influence miningkempe03 ; banos13 .
Two important application areas of these models are 1) Study of evolution dynamics and 2) Generating benchmark networks to study community detection algorithms. Evolution dynamics are important because they help us understand how real world networks attain certain structural properties. For example, triadic closures explain the presence of high clustering coefficients, and preferential attachment explains why degree distributions follow power-law. The second application area is in the study of community detection algorithms where these models can help us determine the quality of a community detection algorithm.
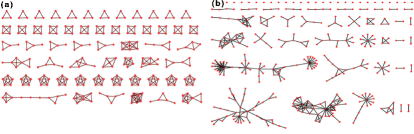
Real-world networks emerging from different domains have different topological and structural features. For example, a co-authorship network of collaboration inducts cliques representing a set of authors strongly connected to each other whereas an online social network introduces nodes gradually as new members sign up. This suggests that the underlying mechanism through which these networks evolve,(or simply the evolution dynamics) shape the structural and topological properties of a network. Figure 1 shows the results of studying the building blocks of two networks from different domains. The authors zaidi10a diagrammatically show the differences in topological features between a co-authorship network newman01 and an air transport network rozenblat08 .
Thus we argue that models to generate benchmark graphs should consider well known evolution dynamics as part of their generation process. Since the performance of community detection algorithms vary with networks of different topological features, having a tunable model will also help us generate networks with desired structural features and thus can be used to evaluate the performance of a community detection algorithm on a wide variety of structurally different networks.
One of the earlier works to generate synthetic networks with ground truth communities is commonly known as GN benchmark girvan02 . Lancichinetti and Fortunato lancichinetti09 identified a number of drawbacks in GN benchmark and presented a model to generate synthetic networks of different sizes with desired degree distributions and clustering. The model also provides a mechanism to generate networks with sparse or dense communities. However, it does not consider any dynamics or microscopic rules such as preferential attachment, triadic closure which are shown to be the corner stone of real world evolving networks. A number of models are available in the literature to generate synthetic networks with community structures but these models do not provide the mechanism to generate ground truth communities and ultimately cannot be used to produce benchmark graphs.
This paper is organized as follows: In Section 2, literature for generating benchmark graphs along with models to generate networks with communities are discussed. Section 3 describes the proposed model whereas section 4 explains the experimental setup. Section 5 presents the results and we conclude in section 6.
2 Related Work
2.1 Benchmark Graphs
There are two approaches to evaluate the performance of community detection algorithms. First is to test against real-world networks with prior information about communities and the second approach is to test against synthetically generated networks with ground truth communities newman12 . Community detection algorithms using the first approach have to rely on small networks such as Zachary’s karate club zachary77 due to unavailability of ground truth for large networks. Yang and Leskovec yang15 studied a few large networks and identified their ground truth communities based on their nodal attributes. Real-world networks not only behave inconsistently for different definitions of communities, but this is also true when nodal attributes are used to cluster nodes as compared to structural characteristics. Hric et al. hric14 found significant differences between ground truth communities and the communities identified by community detection algorithms in real-world networks.
The second approach to evaluate algorithms is to test against synthetic networks generated by models. Ideally such models must be tunable and capable of generating ground truth communities alongside the network itself, in order to compare the results produced by community detection algorithms. Although, there are a number of models available in the literature to produce synthetic networks with community structures their generation processes and mechanisms make it difficult to generate and/or extract ground truth communities.
One of the earliest work in this direction was introduced by Girvan and Newman which is known as the GN benchmark or ’four-groups’ networks girvan02 . The model generates a network with 128 nodes divided into four groups i.e. 32 nodes in each group where the average degree of each node is 16. This is close to a random graph of a similar configuration. In contrast to random graphs, the inter-cluster and intra-cluster connectivity of each node can be controlled by a parameter. Danon et al. proposed a variant of GN network to introduce communities of different sizes but failed to mimic real-world networks with communities due to their small size and absence of fat tails in their degree distributions. Lancichinetti proposed another model to generate benchmark networks, known as the LFR benchmark, that can generate networks with heterogeneous degree distributions following power law. This model is capable of generating large size networks with different size communities. It is also capable of generating networks with different topological properties such as degree distributions and average degrees lancichinetti08 . The model focusses on generating networks with desired properties but does not use any known evolution dynamics or microscopic rules for the generation process. Furthermore the model uses a minimum and maximum number between which it determines the number of communities. This indeterminism leads to a different number of communities every time the algorithm executes. These reasons motivated us to propose a new model which incorporates well studied microscopic rules for complex networks and essentially use them to generate synthetic networks with communities.
2.2 Network Models with Community Structure
Since the discovery of the ground breaking models to generate small-world watts98 and scale-free barabasi99 networks, a number of network models have been proposed which are either variants or extensions of these two models, or use a completely different approach to generate networks. Early models generated networks exhibiting properties of small-world and/or scale-free networks with low average path lengths, high clustering coefficients and degree distributions following power law. With advancements over time, other network structural properties have also gained importance resulting in newer models being proposed. Below we discuss several models to generate networks with community structures.
Xu et al. xu09 extended the scale-free model (BA) barabasi99 by introducing global random attachment for community selection whereas preferential attachment is used for the selection of nodes similarly as in the BA model. The basic idea is to first select a community randomly from the existing communities in the network followed by the selection of a node on the basis of preferential attachment. The model also creates inter-community and intra-community edges with some probabilities. The authors are able to generate networks with general power law distribution of nodes’ degree with the presence of community structures in the network.
Xie et al. xie07 proposed an evolving model based on preferential mechanism for the selection of communities and nodes to generate networks with community structures. Communities of larger sizes are preferred at the time of selection of a community, and a high degree node is preferred to select neighbours to create inter-cluster edges. A similar model was proposed by Zhou et al. zhou08 for weighted evolving networks with additional triad formation step to achieve high clustering in generated networks. Both models allow the introduction of a fully connected community or a single node into the network with some probability.
The model by kumpula09 is based on microscopic rules from sociology to generate networks with moderate size communities. They used cyclic closure and focal closure which are proven mechanisms in sociology to acquire new acquaintances in social networks. Random walk is used to achieve cyclic closures in order to find strong ties in the neighbourhood of a node whereas focal closure is achieved by formation of links with random nodes in the network.
Zaidi zaidi13a discussed the role of randomness in the generation of community structures in a network. They introduced different sizes of closely connected communities by replacing nodes in a network generated by the ER model erdos60 . The authors found that by introducing a small order in random networks, we can generate clustered networks. However, networks generated by this approach do not have the scale-free property which is observed in many real world networks.
The model proposed by Sallaberry et al. is similar to configuration models such as Generalized Random Graph Models as it generates a network for the given degree distribution. However, the model generates cliques for the given degree distribution and creates connections among these cliques on the basis of distances among them zaidi13b . The model is static in the sense that the number of nodes remain constant once degree distribution is assigned to initial nodes.
Recently an extension of holme02 was proposed by Pasta et al. pasta13a which is based on global random selection of a community and local preferential attachment for the selection of a node. The model produced networks with three important structural properties that are high clustering coefficient, presence of hierarchical community structure, and each community following power law distribution for nodes’ degree.
These models use different microscopic rules to generate networks with different topological structures but do not preserve information about the community memberships, hence cannot be used as benchmarks.
3 Proposed Model
The proposed model uses two microscopic rules, global community selection and local preferential attachment to generate a network with community structures. The model comprises of similar steps as the original model proposed by pasta13a with additional heuristics to decide over the community of each node. A mixing parameter () which ranges between 0 and 1 is introduced. This parameter determines the quality of modular structures in the network. Lower values of result in well separated communities and vice versa. Each new node has fraction of edges with nodes belonging to the same community whereas edges with nodes belonging to other communities. Other controlling parameters include: number of nodes in network (), number of communities in network (), probability of triad formation(), number of edges for each new node(). The model has two major phases:
Setup: Initially we introduce as many triads as the required number of communities (). Each triad represents a community and each node of the respective triad is labelled with a number representing its community.
Growth: The following steps are repeated until number of nodes reaches
-
1.
At each timestamp a new node is introduced to the community and connected to an existing node selected on the basis of preferential attachment. At this stage the community of node is assigned to node as well. Thus, both nodes now belong to the same community and have similar labels.
-
2.
With probability , node creates edges with neighbours of whereas fraction edges are connected to neighbours which are not part of the same community and a fraction of edges are created with the neighbours of the same community.
-
3.
Node then creates edges preferentially with probability whereas fraction edges connect to nodes from the same community while a fraction edges are connected to nodes of other communities.
4 Experimental Setup
The proposed model was tested for different configurations of four controlling parameters as described below. The parameter to control number of edges for each new node () is fixed to 2 for all configurations. We produced 240 graphs and the results were averaged over 5 instances for each of the configuration to reduce biasness caused by randomness.
-
•
Networks Size (Networks of 1000, 2000 and 4000 nodes)
-
•
Number of communities (10, 20, 30, and 40 communities)
-
•
Probability of Triad Formation (0.1, 0.3, 0.5, 0.7 and 0.9)
-
•
Mixing Parameter (0.2, 0.4, 0.6, and 0.8)
4.1 Goodness of Community
Despite the fact that community detection is one of the most widely studied problems in network science, there exists varying quantifiable definitions for a community. Thus, testing a benchmark against a specific definition may lead to a situation in which a benchmark does not provide consistent results for all community detection algorithms. Thus the proposed model was tested against different definitions such as separability, density, clustering coefficient and loyalty.
Separability: defines how well a community is separated from the rest of the network i.e. a good community must have a low number of edges pointing to nodes outside it’s communityshi00 . This can be quantified as the ratio between number of edges inside and outside the community. Let be the community in consideration, V as the set of nodes and E is the set of all edges, we define separability as:
| (1) |
Density: quantifies the fraction of edges which are part of the same community from all possible edges fortunato10 . The more edges within a community, the better the community - regardless of the number of edges pointing to nodes of other communities. Here is the number of nodes in community C.
| (2) |
Clustering Coefficient: Another definition of community is based on close binding of neighbours in the same community. This can be quantified as clustering coefficient watts98 . A community of nodes with high clustering coefficient is better than a community with low clustering coefficient.
Loyalty: of a node is the fraction of edges of a node connected to nodes of the same community. A community with disloyal nodes suggests that the these nodes have more edges to other communities rather than to nodes of their own community. The loyalty of a community is the average loyalty of all the nodes in it’s community.
| (3) |
The Separability and Loyalty both capture the same intuition that a community must be separated from the rest of the network but Loyalty quantifies this in a range of 0 and 1. This makes it easier to compare the results of two distinct sets of communities generated as a result of different community detection algorithms.
4.2 Community Detection Algorithms
The presence of community structures is one of the most important characteristics of real world networks. Finding communities in a network is a difficult but crucial task to understand the internal structures of a network. This has been a widely studied area by scholars of different domains and a number of algorithms have been proposed to detect communities in networks.
In order to cover a wide spectrum of community detection algorithms, eight community detection algorithms were selected for the experiment carried out in this paper and each algorithm represents a distinct class of community detection algorithms. The selected algorithms are: Fast greedy clustering is a modularity optimization algorithmclauset04 , Multilevel clustering which is an extension of modularity optimization with additional steps to merge found communities into a single node to repeat the same process blondel08 , Walktrap algorithm is based on random walks to calculate distances between nodes in order to group them in one cluster pons05 , Markov Clustering (MCL) uses markov matrices to simulate stochastic flow vandongen00 , Infomap clustering which solves the community detection problem using Information Theory rosvall08 , Label Propagation which only uses network structure without any prior information about communities or any objective function raghavan07 , VOS which uses the network layout approach to determine communities waltman10 , and Spinglass based on the statistical mechanics’ spin models reichardt06 . The detailed review of community detection algorithms is out of scope for this article and readers can refer respective citations for further details or leskovec10 ; orman11 for comparative analysis.
The performance of these eight algorithms on networks generated by LFR benchmark and the proposed model were evaluated. There are a number of criterion available to compare ground truth communities with results generated by community detection algorithm. This paper used the most commonly used measure Normalized Mutual Information (NMI), in which the value is equal to 1 when two partitions are identical to each other, whereas it has an expected value of zero when partitions are dissimilar to each other danon05 .
5 Results and Discussion
5.1 Evaluation of Structural Properties
First we evaluate the structural properties of the networks generated using the proposed model. The three main properties studied here are the Degree Distribution, the Average Path Length and the Clustering Coefficient.
One of the fundamental features of complex networks is that their degree distribution follows power law. Figure 2 shows that for different values of the mixing parameter , the generated graphs indeed have a fat tail distribution with power law coefficient ranging between .
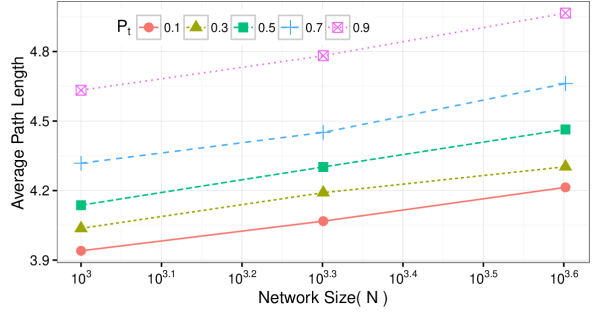
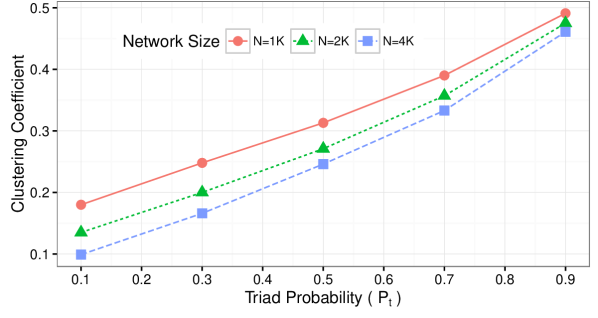
Figure 3 shows the behavior of Average Path Length (APL) and Clustering coefficient (CC) with respect to Network Size () and Probability of Triage Formation (). Figure 3(a) shows that APL increases with increasing network size as well as increasing probability of Triad formation (). As more nodes are introduced in the network, the average geodesic distance among the nodes increases. Similarly, as more triads are formed, more short range edges are created, increasing the overall average distance among the nodes. Figure 3(b) shows that CC increases as increases irrespective of the the network size . This is obvious as a higher probability of triad formation introduces more triadic closures increasing the overall clustering coefficient of the network. Only a negligible variation in clustering coefficient is observed for different values of .
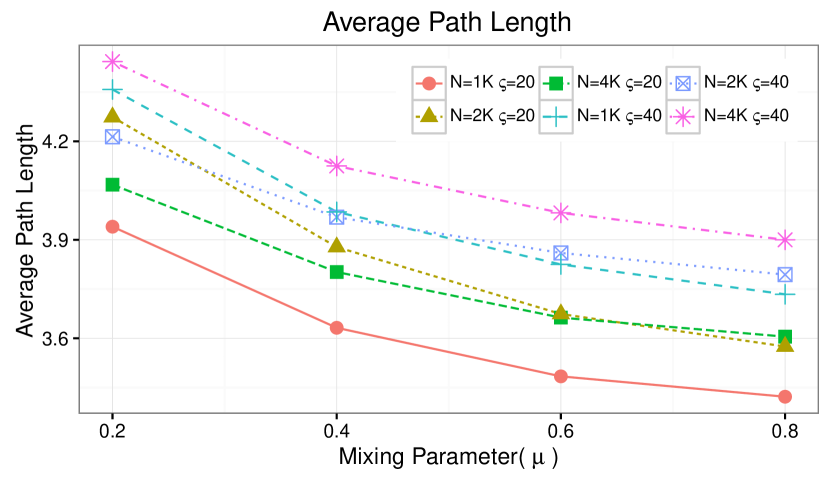
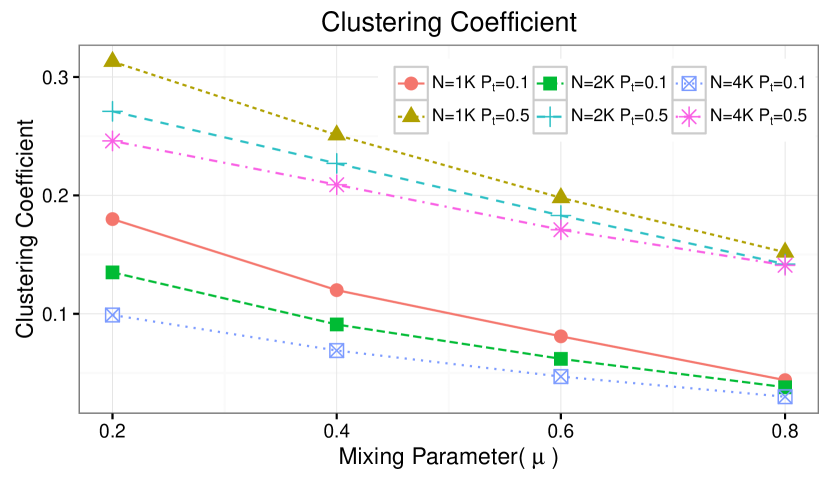
Figure 4 studies the behaviour of Mixing Parameter on Average Path Length (APL) and Clustering Coefficient (CC). Figure 4(a) shows that for lower values of , the communities are more separated, thus resulting in nodes of a community to be closer to each other but further apart from nodes from other communities. This results in lower overall APL for the network. As the number of communities is higher (), the APL is higher because the nodes are segregated across communities when compared to lower number of communities (). Impact of size of network can also be observed as more nodes again result in higher APL for the generated networks. Figure 4(b) shows that higher values of result in slightly lower values of clustering coefficient. This is simply because an increased number of nodes and edges across communities end up not being part of triads resulting in lower overall clustering coefficient. Irrespective of the size of networks, higher values result in higher clustering coefficients as expected.
5.2 Presence of Communities
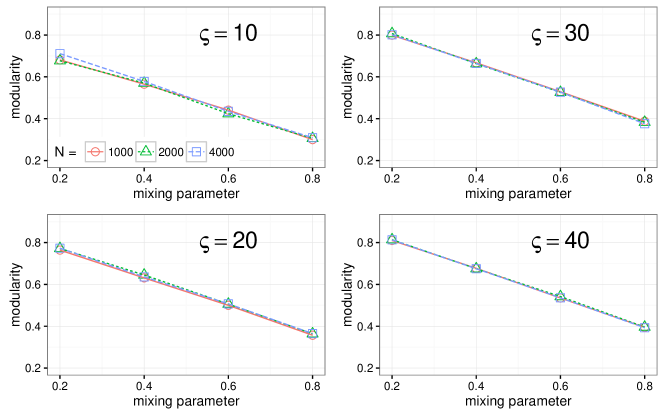
In this subsection, we study the behaviour of the communities generated by the proposed model. First, we use Modularity newman04 to quantify the presence and quality of ground truth community structures in the generated networks. The values of modularity for different graphs vary as a function of mixing parameter . Figure 5 shows that the quality of modular structures decreases for increasing values of mixing parameter and the behaviour is consistent for various number of communities generated in the networks.
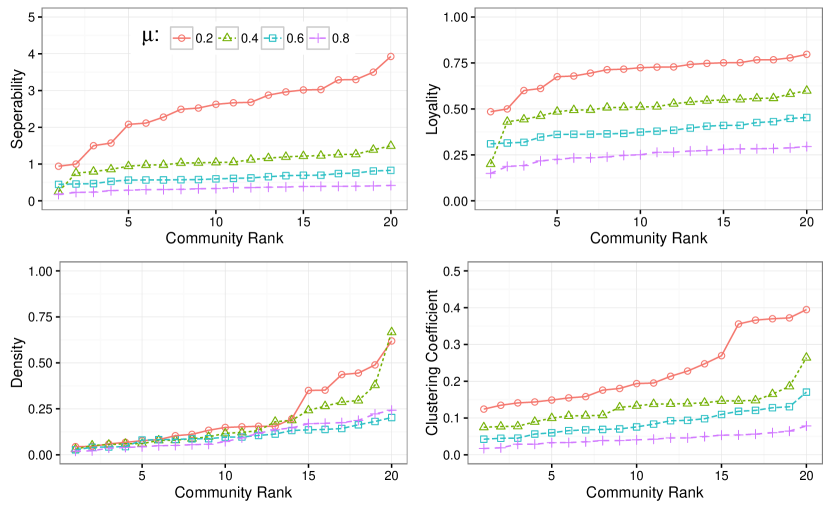
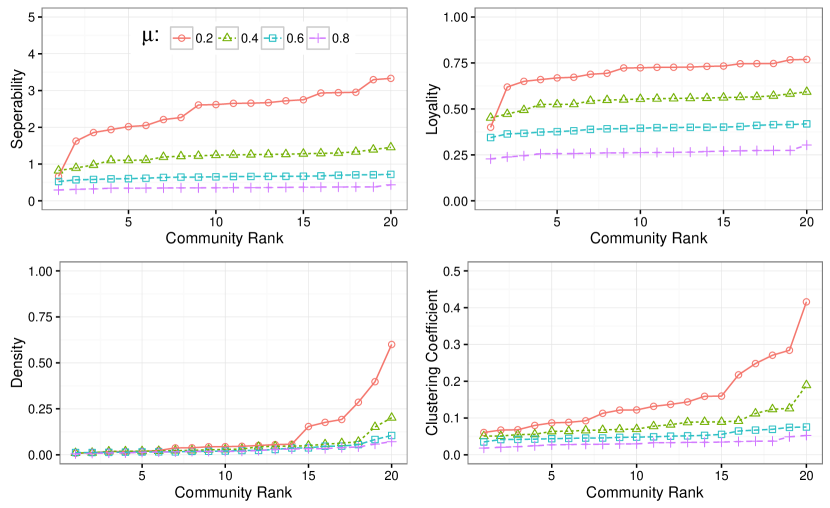
Figure 6 shows the values of four goodness of community metrics for different values of . Y-axis shows that some communities better fit to the respective definition of community as compared to others. However, it is visible that as the value of mixing parameter increases the more communities poorly fit with values approaching to . This represents that communities in the network generally do not fit well for the respective definition. Similar results were observed for different sizes of network which indicates that structurally different communities can be generated in a network by tuning the values of mixing parameter.
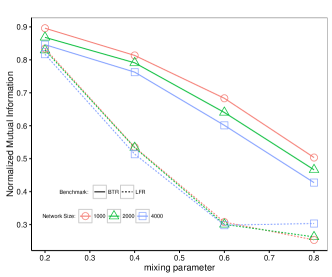
The performance of eight clustering algorithms were compared on networks generated using the proposed model and the LFR model. Normalized Mutual Information (NMI) was calculated to quantify the similarity between generated communities and the ground truth communities. Figure 7 shows the average for all instances of respective benchmarks for different sizes. Community detection algorithms performed poorly for higher values of as expected. However, it is clearly visible that graphs generated by LFR benchmarks are more sensitive than graphs generated by the proposed model for mixing parameter. It indicates that overall community detection algorithms do not behave similarly for these two models to generate benchmark networks.
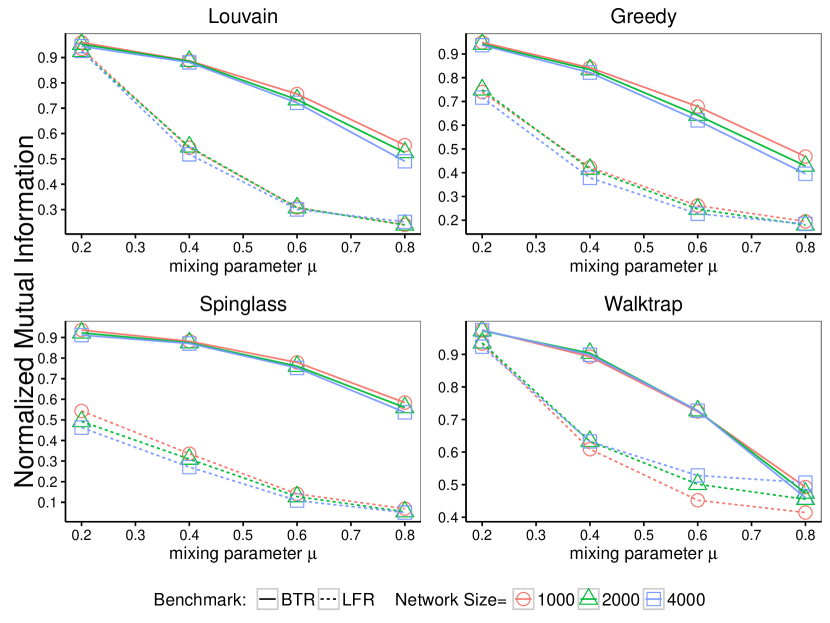
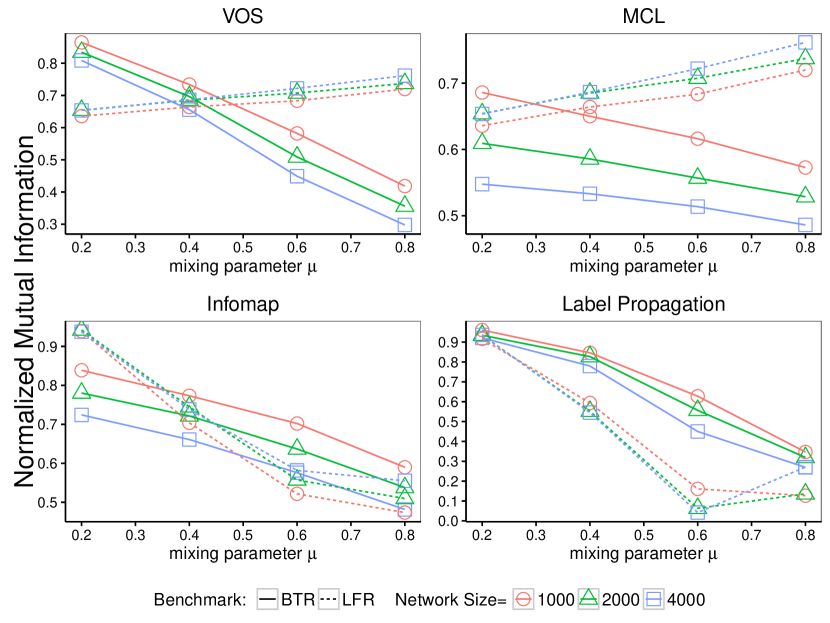
Figure 8 studies individual performances of the community detection algorithms. Each graph shows the result of one algorithm for LFR benchmark (dotted line) and the proposed model (solid line). The algorithms do not behave similarly for these two benchmarks. Generally a more consistent behaviour can be observed for the networks generated using the proposed model. All community detection algorithms have a similar trend with NMI values inversely proportional to mixing parameter . For the LFR Benchmark there are some inconsistencies in the generated networks as VOS and MCL clustering algorithms stand out as better performers in detecting the ground truth communities even with the increasing values. Apart from these two clustering algorithms, the networks generated through LFR show higher sensitivity to the mixing parameter as compared to the proposed model where higher values result in finding poor communities. These observations simply highlight the fact that irrespective of the similarity in structural properties such as clustering coefficient and average path length, the topology of the network changes with the methodology used to generate networks. This in effect, changes the structure of communities in turn resulting in topologically different networks. Note that we are not trying to prove that the proposed model is better than the LFR model, but simply to the fact that the networks and communities generated by these two models are topologically different and community detection algorithms should consider these differences when studying simulated benchmark networks.
5.3 Comparison with Real World Networks
Using the proposed model, we also generated networks similar to three topologically different real world networks. This is to show that the proposed model is quite flexible and can be used to produce networks equivalent to other networks with desired structural properties. The proposed model successfully generated networks which are structurally similar to real world networks when compared using average path length, clustering coefficient and exponent of the fitted power-law distribution. We also used Holme and Kim model holme02 to generate networks similar to real world networks.
| Parameters used to generate networks using Holme & Kim Model | ||
| Dataset | Pt | m |
| Air Transport Network | 0.9 | 12 |
| Network of Political Books | 0.9 | 5 |
| Co-author Geometry | 0.9 | 3 |
| Parameters used to generate networks using the proposed model | ||||
| Dataset | ||||
| Air Transport Network | 30 | 0.9 | 0.3 | 12 |
| Political Books Network | 3 | 0.9 | 0.2 | 5 |
| Co-author Geometry Network | 40 | 0.9 | 0.3 | 3 |
| Comparing Real World Networks and Networks Generated | ||||||
| using Holme & Kim, and the Proposed Model | ||||||
| Nodes | Edges | Node/Edge | APL | CC | ||
| Air Transport Network | 1540 | 16524 | 10.72 | 4.24 | 0.26 | 2.68 |
| Holme & Kim | 1540 | 18447 | 11.97 | 2.59 | 0.11 | 2.86 |
| Proposed Model | 1540 | 17226 | 11.18 | 3.98 | .021 | 2.86 |
| Political Books Network | 105 | 441 | 4.2 | 3.0 | 0.34 | 2.62 |
| Holme & Kim | 105 | 513 | 4.88 | 2.29 | 0.28 | 2.71 |
| Proposed Model | 105 | 486 | 4.62 | 2.77 | 0.35 | 2.62 |
| Co-Author Geometry Network | 3621 | 9461 | 2.6 | 5.31 | 0.22 | 2.45 |
| Holme & Kim | 3621 | 10857 | 2.9 | 4.51 | 0.14 | 2.72 |
| Proposed Model | 3621 | 10663 | 2.9 | 5.98 | 0.21 | 2.68 |
6 Conclusion
In this paper, we proposed a new model to generate benchmark graphs with communities. The model is based on evolution dynamics and microscopic rules such as preferential attachment and triadic closure. The proposed model can not only generate scale-free and small-world networks with communities, but is also flexible enough to generate networks similar to real world networks. The performance of eight different community detection algorithms was studied and compared with the state of the art LFR benchmark. The various community detection algorithms demonstrated inconsistent behaviour on the two benchmarks, the newly proposed model and the LFR highlighting the fact that different microscopic rules indeed affect the topology of generated networks. Thus proving our initial hypothesis that benchmark networks should incorporate well known evolution dynamics in order to study community detection algorithms.
As part of our future work, we intend to investigate reasons behind the behaviour of community detection algorithms on both benchmarks. There are numerous microscopic rules available in the literature. We also aim to study the behaviour of community detection algorithms against different microscopic rules available in literature. Another area that we want to explore is the study of the quality of communities generated by benchmark networks.
7 Declarations
7.1 List of abbreviations
This list shows the abbreviations in the alphabetical order:
-
•
CC: Clustering Coefficient
-
•
APL: Average Path Length
-
•
MCL: Markov Clustering
-
•
NMI: Normalized Mutual Information
7.2 Availability of data and materials
The datasets supporting the conclusions of this article are available online and can be accessible at https://dx.doi.org/10.6084/m9.figshare.4560427.
7.3 Competing Interest
The authors declare that they have no competing interests.
7.4 Authors’ contribution
Authors contributed to the manuscript with the order they appear. All authors discussed the experiments and the final results as well as read and approved the final manuscript.
References
- [1] Books about us politics. http://networkdata.ics.uci.edu/data.php?d=polbooks.
- [2] Raquel A. Baños, Javier Borge-Holthoefer, and Yamir Moreno. The role of hidden influentials in the diffusion of online information cascades. EPJ Data Science, 2(1):6, 2013.
- [3] A. L. Barabási and R. Albert. Emergence of scaling in random networks. Science, 286(5439):509–512, 1999.
- [4] Vladimir Batagelj and Andrej Mrvar. Pajek datasets., 2006.
- [5] Vincent D. Blondel, Jean-Loup Guillaume, Renaud Lambiotte, and Etienne Lefebvre. Fast unfolding of communities in large networks. Journal Statistical Mechanics, (10), October 2008.
- [6] Aaron Clauset, Mark EJ Newman, and Cristopher Moore. Finding community structure in very large networks. Physical review E, 70(6):066111, 2004.
- [7] Leon Danon, Albert Diaz-Guilera, Jordi Duch, and Alex Arenas. Comparing community structure identification. Journal of Statistical Mechanics: Theory and Experiment, 2005(09):P09008, 2005.
- [8] P. Erdos and A. Renyi. On the evolution of random graphs. Publ. Math. Inst. Hung. Acad. Sci, 5:17–61, 1960.
- [9] Emilio Ferrara. A large-scale community structure analysis in facebook. EPJ Data Science, 1(1):1, 2012.
- [10] Santo Fortunato. Community detection in graphs. Physics Reports, 486(3):75–174, 2010.
- [11] Frédéric Gilbert, Paolo Simonetto, Faraz Zaidi, Fabien Jourdan, and Romain Bourqui. Communities and hierarchical structures in dynamic social networks: analysis and visualization. Social Network Analysis and Mining, 1:83–95, 2011.
- [12] Michelle Girvan and M. E. J. Newman. Community structure in social and biological networks. Proc. Natl. Acad. Sci. USA, 99:8271–8276, 2002.
- [13] Petter Holme and Beom Jun Kim. Growing scale-free networks with tunable clustering. Physical Review E, 65:026107, 2002.
- [14] Darko Hric, Richard K Darst, and Santo Fortunato. Community detection in networks: Structural communities versus ground truth. Physical Review E, 90(6):062805, 2014.
- [15] David Kempe, Jon Kleinberg, and Éva Tardos. Maximizing the spread of influence through a social network. In Proceedings of the ninth ACM SIGKDD international conference on Knowledge discovery and data mining, pages 137–146. ACM, 2003.
- [16] JM Kumpula, J-P Onnela, Jari Saramäki, Janos Kertesz, and Kimmo Kaski. Model of community emergence in weighted social networks. Computer Physics Communications, 180(4):517–522, 2009.
- [17] Andrea Lancichinetti and Santo Fortunato. Benchmarks for testing community detection algorithms on directed and weighted graphs with overlapping communities. Physical Review E, 80(1):016118, 2009.
- [18] Andrea Lancichinetti, Santo Fortunato, and Filippo Radicchi. Benchmark graphs for testing community detection algorithms. Physical Review E, 78(4):046110, 2008.
- [19] Jure Leskovec, Kevin J Lang, and Michael Mahoney. Empirical comparison of algorithms for network community detection. In Proceedings of the 19th international conference on World wide web, pages 631–640. ACM, 2010.
- [20] Chen-Wei Liang, Chien-Kuo Ku, and Jeng-Jong Liang. A new scale-free network model for simulating and predicting epidemics. Journal of Theoretical Biology, 317(0):11 – 19, 2013.
- [21] M. E. Newman. Scientific collaboration networks. i. network construction and fundamental results. Phys Rev E Stat Nonlin Soft Matter Phys, 64(1 Pt 2), July 2001.
- [22] M. E. J. Newman. Assortative mixing in networks. Phys. Rev. Lett, 89-20, May 2002.
- [23] M. E. J. Newman and M. Girvan. Finding and evaluating community structure in networks. Phys Rev E Stat Nonlin Soft Matter Phys, 69(2 Pt 2):026113, February 2004.
- [24] Mark EJ Newman. Communities, modules and large-scale structure in networks. Nature Physics, 8(1):25–31, 2012.
- [25] Günce Keziban Orman, Vincent Labatut, and Hocine Cherifi. Qualitative comparison of community detection algorithms. In Digital Information and Communication Technology and Its Applications, pages 265–279. Springer, 2011.
- [26] Muhammad Qasim Pasta, Zohaib Jan, Arnaud Sallaberry, and Faraz Zaidi. Tunable and growing network generation model with community structures. In Social Computing and Applications, 2013 Third International Conference on, pages 233–240, 2013.
- [27] Romualdo Pastor-Satorras and Alessandro Vespignani. Epidemic spreading in scale-free networks. Physical review letters, 86(14):3200, 2001.
- [28] Pascal Pons and Matthieu Latapy. Computing communities in large networks using random walks. In Computer and Information Sciences-ISCIS 2005, pages 284–293. Springer, 2005.
- [29] Usha Nandini Raghavan, Réka Albert, and Soundar Kumara. Near linear time algorithm to detect community structures in large-scale networks. Physical Review E, 76(3):036106, 2007.
- [30] Jörg Reichardt and Stefan Bornholdt. Statistical mechanics of community detection. Physical Review E, 74(1):016110, 2006.
- [31] Martin Rosvall and Carl T. Bergstrom. Maps of random walks on complex networks reveal community structure. Proceedings of the National Academy of Sciences, 105(4):1118–1123, 2008.
- [32] Céline Rozenblat, Guy Melançon, and Pierre-Yves Koenig. Continental integration in multilevel approach of world air transportation (2000-2004). Networks and Spatial Economics, 2008.
- [33] Arnaud Sallaberry, Faraz Zaidi, and Guy Melançon. Model for generating artificial social networks having community structures with small-world and scale-free properties. Social Network Analysis and Mining, 3:597–609, 2013.
- [34] Jianbo Shi and Jitendra Malik. Normalized cuts and image segmentation. Pattern Analysis and Machine Intelligence, IEEE Transactions on, 22(8):888–905, 2000.
- [35] Stijn van Dongen. Graph Clustering by Flow Simulation. PhD thesis, University of Utrecht, 2000.
- [36] Ludo Waltman, Nees Jan van Eck, and Ed CM Noyons. A unified approach to mapping and clustering of bibliometric networks. Journal of Informetrics, 4(4):629–635, 2010.
- [37] D. J. Watts and S. H. Strogatz. Collective dynamics of ’small-world’ networks. Nature, 393:440–442, June 1998.
- [38] Zhou Xie, Xiang Li, and Xiaofan Wang. A new community-based evolving network model. Physica A: Statistical Mechanics and its Applications, 384(2):725–732, 2007.
- [39] Xin-Jian Xu, Xun Zhang, and JFF Mendes. Growing community networks with local events. Physica A: Statistical Mechanics and its Applications, 388(7):1273–1278, 2009.
- [40] Jaewon Yang and Jure Leskovec. Defining and evaluating network communities based on ground-truth. Knowledge and Information Systems, 42(1):181–213, 2015.
- [41] W. W. Zachary. An information flow model for conflict and fission in small groups. Journal of Anthropological Research., 33:452–473, 1977.
- [42] Faraz Zaidi. Small world networks and clustered small world networks with random connectivity. Social Network Analysis and Mining, Volume 3(1):51–63, 2013.
- [43] Faraz Zaidi and Guy Melançon. Identifying the Presence of Communities in Complex Networks Through Topological Decomposition and Component Densities. In EGC 2010, Extraction et Gestion de Connaissance, volume E-19, RNTI. 163-174, 2010.
- [44] Xie Zhou, Li Xiang, and Wang Xiao-Fan. Weighted evolving networks with self-organized communities. Communications in Theoretical Physics, 50(1):261, 2008.
8 Legends
Figure 1:
-
1.
Short Title: Building blocks of two networks from different domains
-
2.
Detail Legend: Building blocks of two different networks extracted at 5% of their maximum degree using [43]. a) Collaboration network of astrophysics archives [21] and b) Air transport network of Cities [32]. Clearly the building components of both networks are structurally different as one contains cliques and the other doesn’t.
Figure 2:
-
1.
Short Title: Degree Distribution
-
2.
Detail Legend: Degree distribution of generated networks with different values of mixing parameter ()
Figure 3:
-
1.
Short Title: Structural Properties
-
2.
Detailed Legend: Behaviour of Average Path Length and Clustering Coefficient with respect to Network Size and Probability of triad Formation.
Figure 4:
-
1.
Short Title: Impact of Mixing Parameter
-
2.
Detailed Legend: Impact of mixing parameter () on (a) average path length (b) overall clustering coefficient
Figure 5:
-
1.
Short Title: Test of Modularity
-
2.
Detailed Legend: Modularity is indirectly proportional to and the behaviour is consistent for different values of network size and size of communities ().
Figure 6:
-
1.
Short Title: Goodness of Community
-
2.
Detailed Legend: Goodness of community metrics with triad formation probability ()=0.1 and Number of communities(). Y-axis represents the value of specific goodness metric which represents how good the communities are in the network and x-axis shows the 20 communities labelled 1 to 20. Each line represents the behaviour of communities for a network generated with a specific value of a mixing parameter.
Figure 7:
-
1.
Short Title: Summary of Community Detection Algorithms
-
2.
Detailed Legend: Comparison of eight different community detection algorithms
Figure 8:
-
1.
Comparison of Community Detection Algorithms
-
2.
Performance of eight algorithms on the two benchmarks. Each plot represents one community detection algorithm for which results are averaged over all instances. Solid lines shows results on graphs generated by LFR benchmark whereas dotted line shows the results for graphs generated by the proposed benchmark.
Building blocks of two networks from different domains