Observation of Weak Collapse in a Bose-Einstein Condensate
Abstract
We study the collapse of an attractive atomic Bose-Einstein condensate prepared in the uniform potential of an optical-box trap. We characterise the critical point for collapse and the collapse dynamics, observing universal behaviour in agreement with theoretical expectations. Most importantly, we observe a clear experimental signature of the counterintuitive weak collapse, namely that making the system more unstable can result in a smaller particle loss. We experimentally determine the scaling laws that govern the weak-collapse atom loss, providing a benchmark for the general theories of nonlinear wave phenomena.
pacs:
03.75.Nt, 03.75.Kk, 67.85.-d, 67.85.HjI Introduction
Wave collapse occurs in a wide range of physical contexts, including optics, atomic and condensed-matter physics. Generally, collapse occurs if an attractive nonlinearity exceeds a critical value. If the collapse is triggered at time , the wave amplitude asymptotically diverges at some point in space as the collapse time is approached. In practice, the amplitude divergence results in dissipation of wave energy (or particle loss).
The unifying theoretical framework for understanding different collapse phenomena is provided by the nonlinear Schrödinger equation, which has been extensively studied for various forms of nonlinearity Sulem and Sulem (1999); Fibich (2015). This general formalism is applied to self-focusing of light Askar’yan (1962); Chiao et al. (1964); Kelley (1965); Pilipetskii and Rustamov (1965); Hercher (1964), collapse of Langmuir waves Zakharov (1972); Wong and Cheung (1984) and Bose-Einstein condensates (BECs) Ruprecht et al. (1995); Kagan et al. (1996, 1997, 1998); Eleftheriou and Huang (2000), and even surface water waves Davey and Stewartson (1974); Papanicolaou et al. (1994).
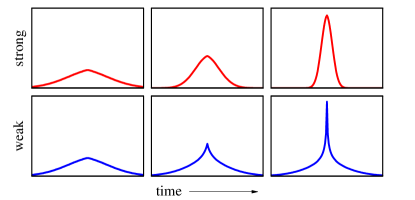
In this framework, wave collapse is classified as either strong or weak (see Fig. 1). In a strong collapse, a finite fraction of the wave collapses towards the singularity. On the other hand, in a weak collapse Zakharov and Synakh (1975); Zakharov et al. (1985); Zakharov and Kuznetsov (1986) the fraction of the wave that (in absence of dissipation) ultimately reaches the singularity vanishes. This has the counterintuitive practical implication that making the system more unstable, by quenching the nonlinearity further beyond the critical point, can result in less dissipation Zakharov and Kuznetsov (1986); Bergé and Juul Rasmussen (2002). Qualitatively, once the collapse is triggered, for stronger attractive interactions it happens faster and progresses further before dissipative processes halt it; consequently the wave amplitude is larger at the point in time when dissipation occurs, and for weak collapse this means that a smaller fraction of the wave is actually dissipated. To our knowledge, weak collapse has not been experimentally observed in any physical system.
An atomic BEC with -wave two-body interactions is modelled by the Gross-Pitaevskii (GP) equation, with a cubic nonlinearity proportional to the scattering length , which can be dynamically tuned via a Feshbach resonance Chin et al. (2008). The BEC is prone to collapse for any , but a kinetic-energy barrier makes it metastable up to a critical interaction strength Ruprecht et al. (1995); Kagan et al. (1996, 1997, 1998); Eleftheriou and Huang (2000). If the BEC becomes unstable and collapses, dissipation occurs through three-body recombination that results in particle loss. Importantly, the three-dimensional GP equation is expected to provide an example of weak collapse.
Previous collapse experiments with atomic BECs Gerton et al. (2000); Roberts et al. (2001); Donley et al. (2001); Cornish et al. (2006); Altin et al. (2011); Compton et al. (2012) (see also Col ) were performed in the traditional setting of a harmonic trap. The critical point Roberts et al. (2001) and collapse times Donley et al. (2001); Altin et al. (2011) were in general agreement with theoretical expectations Ruprecht et al. (1995); Santos and Shlyapnikov (2002); Saito and Ueda (2002); Adhikari (2002); Savage et al. (2003); Métens et al. (2003); Ueda and Saito (2003); Carr and Brand (2004); Wüster et al. (2005), but no evidence of weak collapse was observed; the atom loss was only seen to grow with Cornish et al. (2006).
In this article we study BEC collapse in a new experimental setting, using a 39K condensate Roati et al. (2007); Campbell et al. (2010) prepared in the uniform potential of an optical-box trap Gaunt et al. (2013); for details of our setup see Appendix A. The combination of large system size (up to m) and fine tuning of the scattering length (with a resolution of , where is the Bohr radius) gives us a very large dynamic range: we observe metastable attractive BECs with up to atoms, and collapse times that vary between and ms. We demonstrate the expected scaling of the critical scattering length with the BEC atom number and the system size , and show that the collapse time can be expressed as a universal function of the dimensionless interaction strength . Most importantly, we observe conclusive evidence for weak collapse, namely the counterintuitive decrease of the atom loss with increasing , and experimentally determine the scaling laws that govern the weak-collapse atom loss. The weak nature of the collapse is directly revealed only by resolving single collapse events, and is obscured in the multiple collapse regime, which has been seen in previous cold atom experiments.
II Critical Point
The starting point for our discussion is the GP equation for a homogeneous box potential, with a heuristically added three-body loss term Kagan et al. (1998):
| (1) |
where is the atom mass, is the three-body loss coefficient, is normalised to the atom number , and the boundary condition is at the trap walls.
We use a cylindrical box trap Gaunt et al. (2013) of variable length and radius , and always set , so is the only lengthscale characterising the system size. We may thus rewrite Eq. (1) in a dimensionless form, defining and , with characteristic time :
| (2) |
where
| (3) |
and is initially normalised to unity. For the range of scattering lengths that we study, we assume that is constant Shotan et al. (2014); Lepoutre et al. (2016), with the value m6s-1 Fattori et al. (2008a). The corresponding value of , for all our and values, is very small () and thus three-body loss is negligible in our (meta)stable condensates. However, if the BEC collapses, significant loss occurs, providing the primary experimental signature of the collapse.
Neglecting the atom loss in a metastable BEC, based on Eq. (2) the critical interaction strength, , can depend only on the boundary conditions, i.e. the box shape. For a family of self-similar boxes ( const.) it should be a universal constant, so .
To experimentally study the critical point for collapse, we prepare a stable BEC at , then over s ramp the scattering length to a variable , and wait for s before turning off the trap and imaging the atoms after ms of time-of-flight (ToF) expansion. We image the cloud along the axial direction of our cylindrical trap, and for ToF we jump the scattering length to .
In Fig. 2(a) we show how, for a given initial , the final atom number depends on the negative . A well defined is signaled by a sharp drop in the atom number. As shown in Fig. 2(b), the atom loss is accompanied by a qualitative change in the appearance of the cloud in ToF.
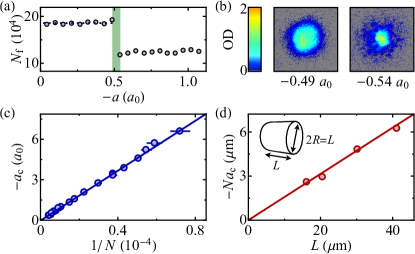
In Fig. 2(c) we plot for m and a wide range of values, from to . We clearly observe the expected scaling (see also Appendix B). In Fig. 2(d) we plot the measured versus box size and confirm the scaling . We find that the dimensionless critical interaction strength is , where the error includes the systematic uncertainties in box size and absolute atom number calibration. For comparison, numerical simulations of the GP equation for our box geometry give .
III Collapse Dynamics
To study the collapse dynamics, we perform interaction-quench experiments Donley et al. (2001). We prepare a BEC just above and then quench the scattering length to a variable to initiate the collapse (see Appendix B for more details). After a variable hold time we jump the scattering length to , switch off the trap, and observe the cloud in ToF.
As shown in the left panel of Fig. 3(a), for quenches close to the critical point (small ), at the atom number suddenly drops to a stable lower value. We understand this as a single collapse event. On the other hand, for large quenches [right panel of Fig. 3(a)], the atom number appears to gradually decay until it stabilises. Such behaviour, also seen in Donley et al. (2001); Altin et al. (2011), is understood as arising from a series of multiple (experimentally unresolved) collapses Malkin (1988); Vlasov et al. (1989); Zakharov et al. (1989); Kagan et al. (1998); Saito and Ueda (2001a, b, 2002); Santos and Shlyapnikov (2002); Bergé and Juul Rasmussen (2002), and we accordingly associate with the onset of the atom loss Definetc . (For further evidence for the occurrence of single and multiple discrete collapse events see Appendix C.)
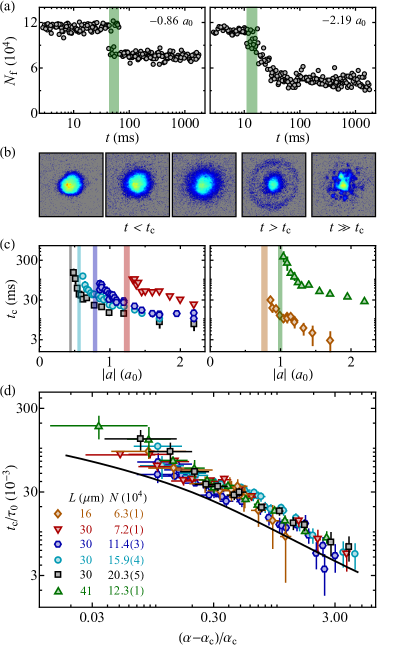
In Fig. 3(b) we show typical ToF images for different times after the quench. At , before any change in the atom number occurs, the swelling of the cloud in ToF reveals the shrinking of the wavefunction in-trap. Right after , within the first ms, we observe that the remnant cloud consists of a lower-energy central part and a higher-energy shell, reminiscent of the atom bursts generated during collapse in Donley et al. (2001). At longer times we observe more irregular patterns. We see a similar shell structure in images taken along a perpendicular direction, which implies that the outgoing atom shell is spherical. Based on its size in ToF, the shell expands at a rate of mm/s, which is consistent with it reflecting off the trap walls and interfering with the central part of the cloud after ms.
In Fig. 3(c) we plot versus for six data sets taken with different and values. We observe values that vary between 3 and ms. In Fig. 3(d) we show that all the data points fall onto a single universal curve if we plot the dimensionless collapse time, , versus the reduced distance from the critical point, . In general, could also depend on , but the universal behaviour seen in Fig. 3(d) shows that this effect is negligible for our range of , between and . The solid line in Fig. 3(d) shows results of lossless GP simulations, without any free parameters; we reproduce a very similar dependence of on , although the numerical values are systematically slightly below the experimental ones.
IV Weak Collapse
We now turn to the aftermath of the collapse. Since is initially normalised to unity, the fractional atom loss, , should be some universal function of and ; here is the difference between the initial (pre-collapse) and the final (time-dependent) atom number. The counterintuitive implication of the weak-collapse theory is that decreases if the BEC is made more unstable, by quenching to a more negative value.
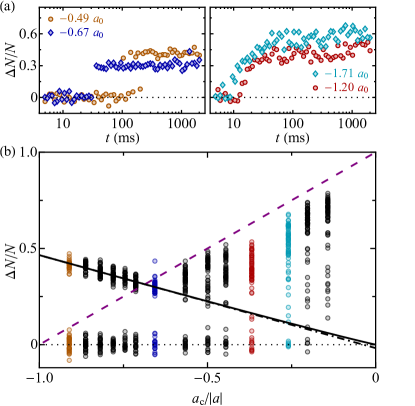
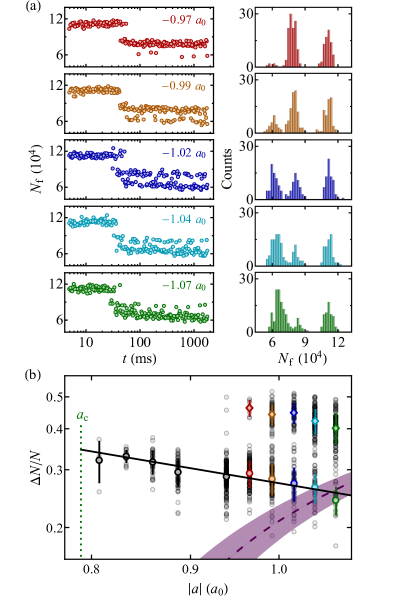
In Fig. 4 we focus on one data set, for fixed m and . As we illustrate in the left panel of Fig. 4(a), close to the critical point, where we observe only single-collapse events, the atom loss indeed decreases with increasing , indicating weak collapse. On the other hand, as shown in the right panel of Fig. 4(a), in the regime of large quenches and multiple collapse, the atom loss in the long-time limit shows the opposite trend; only this type of behaviour was seen in harmonic-trap experiments Donley et al. (2001); Cornish et al. (2006).
In Fig. 4(b) we present a consistent picture of the atom-loss trends for all , from to . Here we plot versus , and for each show values observed for all ; the points clustered around correspond to .
The single-collapse regime, , is clearly identified by the small spread of the non-zero values. The single-collapse atom loss clearly decreases with increasing , and extrapolates to zero for . This is the unambiguous signature of a weak collapse. The dot-dashed black line shows a linear extrapolation, which gives for , while the (almost indistinguishable) solid black line shows a power-law fit, .
For , multiple collapse occurs, because the diminishing single-collapse atom loss does not re-stabilise the system. However, we see that even in this regime the minimal loss we observe at each still follows the weak-collapse trend (solid black line). It is also instructive to plot the function (dashed purple line); this is atom loss such that, after a quench to a given , the atom number drops to the new critical value [see Eq. (3)]. This equilibrium stability criterion is not obviously applicable in the non-equilibrium situation after the first collapse Cornish et al. (2006). Still, it provides a good estimate of both the point, , beyond which the single-collapse loss is insufficient to re-stabilise the system (see also Appendix C), and the long-time loss at large .
We now extend the study of the weak-collapse atom loss to other and values (see Fig. 5). In this analysis we include all values for which only single collapse occurs, and also those where clearly resolved single and double collapses occur (see Appendix C).
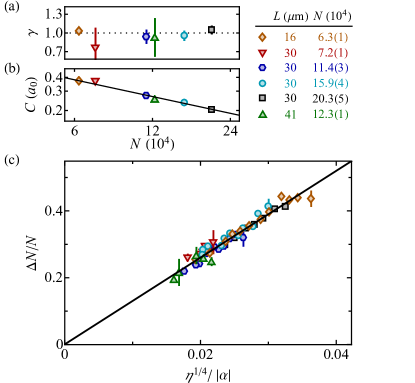
Writing for each data set with fixed and , as in Fig. 4(b), we always get consistent with unity [see Fig. 5(a)]; averaging over all data sets gives . We then assume the form and study the dependence of on and . As shown in Fig. 5(b), on a log-log plot, we find , with no clear dependence on ; the two points taken with m and m fall onto the same line as the four points taken with m.
We thus experimentally find that weak-collapse atom loss is described very well by . From Eq. (3), this corresponds to , which is indeed independent of , and vanishes in the limit of infinitely strong attraction, . We note that while the weak collapse atom loss does not depend on (the overall size of the box) it may depend on the box shape; this is an interesting question for future research.
In Fig. 5(c) we plot all our single-collapse data versus and confirm that it falls onto a single universal curve CollapseFootnote2 . These experimentally obtained scaling laws should provide useful input for further theoretical work.
V Conclusions and outlook
In conclusion, we have performed a comprehensive study of the collapse of an attractive BEC confined in the homogeneous potential of a 3D box trap. We have fully characterised the critical point for collapse, and the collapse dynamics of an interaction-quenched BEC, finding universal behaviour in agreement with the theoretical expectations. Most importantly, we have provided conclusive experimental evidence for the counterintuitive weak collapse, and have experimentally determined weak-collapse scaling laws that should provide a useful reference point for the general theories of nonlinear wave phenomena.
Our work also points to many avenues for further research. It would be very interesting to explore quenches from a large positive , where the BEC is initially deep in the Thomas-Fermi regime, and in the case of a box potential the density is uniform. In this case it is not obvious how the condensate would spontaneously ‘choose’ the position at which to collapse, or whether many local collapses would occur instead of a global one. Additionally, since the fractional atom loss cannot exceed 100%, the linear trend seen in Fig. 5(c) cannot extend to the regime of strong dissipation (large ). It would be interesting to explore that regime using a different geometry, a different Feshbach resonance, or a different atomic species. Finally, a major extension would be to perform similar experiments with 2D gases, for which a strong collapse and hence fundamentally different behaviour is expected.
Acknowledgements.
We thank Sarah Thomas, Yago del Valle-Inclán Redondo and Cornelius Roemer for experimental assistance, and Richard Fletcher, Raphael Lopes and Andreas Nunnenkamp for a critical reading of the manuscript. The GeForce GTX TITAN X used for the numerical simulations was donated by the NVIDIA Corporation. This work was supported by the Royal Society, EPSRC [Grant No. EP/N011759/1], ERC (QBox), AFOSR and ARO. A.L.G. and N.N. acknowledge support from Trinity College, Cambridge.Appendix A - Experimental Setup
Our setup is the first 3D BEC box experiment with tuneable interactions. The setup for producing harmonically trapped 39K condensates is similar to our previous apparatus Campbell et al. (2010). The main difference is that here we employ the gray molasses technique Boiron et al. (1996); Salomon et al. (2013); Nath et al. (2013) and directly cool 39K without the need for sympathetic cooling with rubidium atoms (see also Landini et al. (2012); Salomon et al. (2014)). We load the laser-cooled atoms directly into a crossed optical dipole trap (using a -W -nm laser) and achieve efficient evaporative cooling using the Feshbach resonance in the state at 402.70(3) G Fletcher et al. (2016). This results in a quasi-pure BEC of atoms. We then load the atoms into a cylindrical optical box formed by blue-detuned ( nm) laser light, and cancel out gravity with a magnetic field gradient, as in Gaunt et al. (2013). The loading procedure is essentially 100% efficient and results in a quasi-pure box-trapped BEC of atoms.
The Feshbach resonance in the state has a width of G and the background scattering length is D’Errico et al. (2007). Hence, near the zero-crossing of , at G, the variation of the scattering length with the magnetic field is G. We tune in steps of 50 mG, corresponding to a scattering length resolution of 0.03 .
Appendix B - Scattering Length Calibration
The exact magnetic field at which the scattering length in the state vanishes was independently measured in Ref. Fattori et al. (2008b) to be G. For Fig. 2(a-c) we calculate our values assuming G. Fitting the data in Fig. 2(c) with a free intercept gives an intercept , which is consistent with zero within the systematic error due to the uncertainty in . We take this to be an unbiased confirmation of the zero intercept and the expected scaling , and use this scaling to slightly refine the value of the zero-crossing field, to G. The remaining 30 mG uncertainty in corresponds to a systematic uncertainty in our values of .
For our interaction quenches we have determined, using radio-frequency spectroscopy, that the magnetic field takes 4 ms to change (from 20 to 80 % of the jump). We account for this delay in our determination of the collapse time, and also include an additional 2 ms uncertainty in all the reported values.
Appendix C - From Single to Double collapse
In Fig. 6 we present evidence for a gradual transition between single- and double-collapse events, which strongly supports the interpretation that an increasing number of discrete collapse events occur as is increased. This data was taken with m and initial .
In Fig. 6(a) we show the evolution of after a quench to various . A fine scan of resolves a striking bifurcation of the collapse outcome. We interpret the upper and lower branch as the result of, respectively, one and two collapse events. As is increased, the probability of a double collapse gradually increases. This crossover is highlighted in the histograms shown on the right.
In Fig. 6(b) we show the fractional atom loss versus on a log-log plot. In the regime where a double collapse occurs, the single-collapse branch still clearly follows the weak-collapse scaling . Note that in this data set the double collapse occurs slightly closer to than expected from the simple equilibrium stability criterion (purple band).
References
- Sulem and Sulem (1999) C. Sulem and P.-L. Sulem, The Nonlinear Schrödinger Equation, Self-Focusing and Wave Collapse (Springer-Verlag, New York, 1999).
- Fibich (2015) G. Fibich, The Nonlinear Schrödinger Equation (Spinger International Publishing, Switzerland, 2015).
- Askar’yan (1962) G. A. Askar’yan, “Effects of the gradient of a strong electromagnetic beam on electrons and atoms,” Sov. Phys. JETP 15, 1088–1090 (1962).
- Chiao et al. (1964) R. Y. Chiao, E. Garmire, and C. H. Townes, “Self-trapping of optical beams,” Phys. Rev. Lett. 13, 479–482 (1964).
- Kelley (1965) P. L. Kelley, “Self-focusing of optical beams,” Phys. Rev. Lett. 15, 1005–1008 (1965).
- Pilipetskii and Rustamov (1965) N. F. Pilipetskii and A. R. Rustamov, “Observation of self-focusing of light in liquids,” JETP Lett. 2, 55 (1965).
- Hercher (1964) M. Hercher, “Laser-induced damage in transparent media,” J. Opt. Soc. Am. 54, 563 (1964).
- Zakharov (1972) V. E. Zakharov, “Collapse of Langmuir Waves,” Sov. Phys. JETP 35, 908 (1972).
- Wong and Cheung (1984) A. Y. Wong and P. Y. Cheung, “Three-dimensional self-collapse of Langmuir waves,” Phys. Rev. Lett. 52, 1222–1225 (1984).
- Ruprecht et al. (1995) P. A. Ruprecht, M. J. Holland, K. Burnett, and M. Edwards, “Time-dependent solution of the nonlinear Schrödinger equation for Bose-condensed trapped neutral atoms,” Phys. Rev. A 51, 4704 (1995).
- Kagan et al. (1996) Y. Kagan, G. V. Shlyapnikov, and J. T. M. Walraven, “Bose–Einstein condensation in trapped atomic gases,” Phys. Rev. Lett. 76, 2670 (1996).
- Kagan et al. (1997) Y. Kagan, E. L. Surkov, and G. V. Shlyapnikov, “Evolution and global collapse of trapped Bose condensates under variations of the scattering length,” Phys. Rev. Lett. 79, 2604–2607 (1997).
- Kagan et al. (1998) Y. Kagan, A. E. Muryshev, and G. V. Shlyapnikov, “Collapse and Bose–Einstein condensation in a trapped Bose gas with negative scattering length,” Phys. Rev. Lett. 81, 933 (1998).
- Eleftheriou and Huang (2000) A. Eleftheriou and K. Huang, “Instability of a Bose-Einstein condensate with an attractive interaction,” Phys. Rev. A 61, 043601 (2000).
- Davey and Stewartson (1974) A. Davey and K. Stewartson, “On three-dimensional packets of surface waves,” Proc. R. Soc. Lond. A. 338, 101–110 (1974).
- Papanicolaou et al. (1994) G. C. Papanicolaou, C. Sulem, P.-L. Sulem, and X. P. Wang, “The focusing singularity of the Davey-Stewartson equations for gravity-capillary surface waves,” Physica D 72, 61 – 86 (1994).
- Zakharov and Synakh (1975) V. E. Zakharov and V. S. Synakh, “The nature of the self-focusing singularity,” Sov. Phys. JETP 41, 465 (1975).
- Zakharov et al. (1985) V. E. Zakharov, E. A. Kuznetsov, and S. L. Musher, “Semiclassical regime of a three-dimensional wave collapse,” JETP Lett. 41, 154 (1985).
- Zakharov and Kuznetsov (1986) V. E. Zakharov and E. A. Kuznetsov, “A quasi-classical theory for a three-dimensional wave collapse,” Sov. Phys. JETP 64, 773–780 (1986).
- Bergé and Juul Rasmussen (2002) L. Bergé and J. Juul Rasmussen, “Collapsing dynamics of attractive Bose–Einstein condensates,” Phys. Lett. A 304, 136 – 142 (2002).
- Chin et al. (2008) C. Chin, R. Grimm, P. Julienne, and E. Tiesinga, “Feshbach resonances in ultracold gases,” Rev. Mod. Phys. 82, 1225–1286 (2008).
- Gerton et al. (2000) J. M. Gerton, D. Strekalov, I. Prodan, and R. G. Hulet, “Direct observation of growth and collapse of a Bose-Einstein condensate with attractive interactions,” Nature 408, 692–695 (2000) .
- Roberts et al. (2001) J. L. Roberts, N. R. Claussen, S. L. Cornish, E. A. Donley, E. A. Cornell, and C. E. Wieman, “Controlled collapse of a Bose-Einstein condensate,” Phys. Rev. Lett. 86, 4211–4214 (2001).
- Donley et al. (2001) E. A. Donley, N. R. Claussen, S. L. Cornish, J. L. Roberts, E. A. Cornell, and C. E. Wieman, “Dynamics of collapsing and exploding Bose–Einstein condensates,” Nature 412, 295 (2001).
- Cornish et al. (2006) S. L. Cornish, S. T. Thompson, and C. E. Wieman, “Formation of bright matter-wave solitons during the collapse of attractive Bose-Einstein condensates,” Phys. Rev. Lett. 96, 170401 (2006).
- Altin et al. (2011) P. A. Altin, G. R. Dennis, G. D. McDonald, D. Döring, J. E. Debs, J. D. Close, C. M. Savage, and N. P. Robins, “Collapse and three-body loss in a 85Rb Bose-Einstein condensate,” Phys. Rev. A 84, 033632 (2011).
- Compton et al. (2012) R. L. Compton, Y.-J. Lin, K. Jiménez-García, J. V. Porto, and I. B. Spielman, “Dynamically slowed collapse of a Bose-Einstein condensate with attractive interactions,” Phys. Rev. A 86, 063601 (2012).
- (28) Other experiments have explored amplification of local instabilities Chin et al. (2003) and the -wave collapse driven by dipolar interactions Lahaye et al. (2008); Koch et al. (2008); Aikawa et al. (2012); Kadau et al. (2016); Chomaz et al. (2016); Schmitt et al. (2016) .
- Chin et al. (2003) J. K. Chin, J. M. Vogels, and W. Ketterle, “Amplification of local instabilities in a Bose-Einstein condensate with attractive interactions,” Phys. Rev. Lett. 90, 160405 (2003).
- Lahaye et al. (2008) T. Lahaye, J. Metz, B. Fröhlich, T. Koch, M. Meister, A. Griesmaier, T. Pfau, H. Saito, Y. Kawaguchi, and M. Ueda, “-wave collapse and explosion of a dipolar Bose-Einstein condensate,” Phys. Rev. Lett. 101, 080401 (2008).
- Koch et al. (2008) T. Koch, T. Lahaye, J. Metz, B. Fröhlich, A. Griesmaier, and T. Pfau, “Stabilizing a purely dipolar quantum gas against collapse,” Nat. Phys. 4, 218–222 (2008).
- Aikawa et al. (2012) K. Aikawa, A. Frisch, M. Mark, S. Baier, A. Rietzler, R. Grimm, and F. Ferlaino, “Bose-Einstein condensation of erbium,” Phys. Rev. Lett. 108, 210401 (2012).
- Kadau et al. (2016) H. Kadau, M. Schmitt, M. Wenzel, C. Wink, T. Maier, I. Ferrier-Barbut, and T. Pfau, “Observing the Rosensweig instability of a quantum ferrofluid,” Nature 530, 194–197 (2016).
- Chomaz et al. (2016) L. Chomaz, S. Baier, D. Petter, M. J. Mark, F. Wächtler, L. Santos, and F. Ferlaino, “Quantum-fluctuation-driven crossover from a dilute Bose-Einstein condensate to a macro-droplet in a dipolar quantum fluid,” arXiv:1607.06613 (2016).
- Schmitt et al. (2016) M. Schmitt, M. Wenzel, F. Böttcher, I. Ferrier-Barbut, and T. Pfau, “Self-bound droplets of a dilute magnetic quantum liquid,” arXiv:1607.07355 (2016).
- Santos and Shlyapnikov (2002) L. Santos and G. V. Shlyapnikov, “Collapse dynamics of trapped Bose-Einstein condensates,” Phys. Rev. A 66, 011602 (2002).
- Saito and Ueda (2002) H. Saito and M. Ueda, “Mean-field analysis of collapsing and exploding Bose-Einstein condensates,” Phys. Rev. A 65, 033624 (2002).
- Adhikari (2002) S. K. Adhikari, “Dynamics of collapsing and exploding Bose–Einstein condensate,” Phys. Lett. A 296, 145 – 150 (2002).
- Savage et al. (2003) C. M. Savage, N. P. Robins, and J. J. Hope, “Bose-Einstein condensate collapse: A comparison between theory and experiment,” Phys. Rev. A 67, 014304 (2003).
- Métens et al. (2003) S. Métens, G. Dewel, and P. Borckmans, “Nonadiabatic effects in the dynamics of collapsing Bose-Einstein condensates,” Phys. Rev. A 68, 045601 (2003).
- Ueda and Saito (2003) M. Ueda and H. Saito, “A consistent picture of a collapsing Bose-Einstein condensate,” J. Phys. Soc. Jpn. 72, 127–133 (2003).
- Carr and Brand (2004) L. D. Carr and J. Brand, “Spontaneous soliton formation and modulational instability in Bose-Einstein condensates,” Phys. Rev. Lett. 92, 040401 (2004).
- Wüster et al. (2005) S. Wüster, J. J. Hope, and C. M. Savage, “Collapsing Bose-Einstein condensates beyond the Gross-Pitaevskii approximation,” Phys. Rev. A 71, 033604 (2005).
- Roati et al. (2007) G. Roati, M. Zaccanti, C. D’Errico, J. Catani, M. Modugno, A. Simoni, M. Inguscio, and G. Modugno, “39K Bose–Einstein condensate with tunable interactions,” Phys. Rev. Lett. 99, 010403 (2007).
- Campbell et al. (2010) R. L. D. Campbell, R. P. Smith, N. Tammuz, S. Beattie, S. Moulder, and Z. Hadzibabic, “Efficient production of large 39K Bose–Einstein condensates,” Phys. Rev. A 82, 063611 (2010).
- Gaunt et al. (2013) A. L. Gaunt, T. F. Schmidutz, I. Gotlibovych, R. P. Smith, and Z. Hadzibabic, “Bose-Einstein condensation of atoms in a uniform potential,” Phys. Rev. Lett. 110, 200406 (2013).
- Shotan et al. (2014) Z. Shotan, O. Machtey, S. Kokkelmans, and L. Khaykovich, “Three-body recombination at vanishing scattering lengths in an ultracold Bose gas,” Phys. Rev. Lett. 113, 053202 (2014).
- Lepoutre et al. (2016) S. Lepoutre, L. Fouche, A. Boisse, G. Berthet, G. Salomon, A. Aspect, and T. Bourdel, “Production of strongly bound 39K bright solitons,” arXiv:1609.01560 (2016).
- Fattori et al. (2008a) M. Fattori, C. D’Errico, G. Roati, M. Zaccanti, M. Jona-Lasinio, M. Modugno, M. Inguscio, and G. Modugno, “Atom interferometry with a weakly interacting Bose-Einstein condensate,” Phys. Rev. Lett. 100, 080405 (2008a).
- Malkin (1988) V. M. Malkin, “Bi-self-similar wave collapse,” JETP Lett. 48, 653–655 (1988).
- Vlasov et al. (1989) S. N. Vlasov, L. V. Piskunova, and V. I. Talanov, “Three-dimensional wave collapse in a model of the nonlinear Schrödinger equation,” Sov. Phys. JETP 68, 1125 (1989).
- Zakharov et al. (1989) V. E. Zakharov, N. E. Kosmatov, and V. F. Shvets, “Ultrastrong wave collapse,” Sov. Phys. JETP 49, 492 (1989).
- Saito and Ueda (2001a) H. Saito and M. Ueda, “Intermittent implosion and pattern formation of trapped Bose-Einstein condensates with an attractive interaction,” Phys. Rev. Lett. 86, 1406–1409 (2001a).
- Saito and Ueda (2001b) H. Saito and M. Ueda, “Power laws and collapsing dynamics of a trapped Bose-Einstein condensate with attractive interactions,” Phys. Rev. A 63, 043601 (2001b).
- (55) Note that in general is best defined as the time when the maximum density is reached and the atom loss rate is the highest. In all our data sets we observe the highest loss rate at the onset of atom loss.
- (56) Here each point and its error bar show the average and standard error for a cluster of single-collapse points taken for same and just different , such as seen in Fig. 4(b) for .
- Boiron et al. (1996) D. Boiron, A. Michaud, P. Lemonde, Y. Castin, C. Salomon, S. Weyers, K. Szymaniec, L. Cognet, and A. Clairon, “Laser cooling of cesium atoms in gray optical molasses down to 1.1 K,” Phys. Rev. A 53, R3734–R3737 (1996).
- Salomon et al. (2013) G. Salomon, L. Fouché, P. Wang, A. Aspect, P. Bouyer, and T. Bourdel, “Gray-molasses cooling of 39K to a high phase-space density,” Europhys. Lett. 104, 63002 (2013).
- Nath et al. (2013) D. Nath, R. K. Easwaran, G. Rajalakshmi, and C. S. Unnikrishnan, “Quantum-interference-enhanced deep sub-Doppler cooling of 39K atoms in gray molasses,” Phys. Rev. A 88, 053407 (2013).
- Landini et al. (2012) M. Landini, S. Roy, G. Roati, A. Simoni, M. Inguscio, G. Modugno, and M. Fattori, “Direct evaporative cooling of 39K atoms to Bose-Einstein condensation,” Phys. Rev. A 86, 033421 (2012).
- Salomon et al. (2014) G. Salomon, L. Fouché, S. Lepoutre, A. Aspect, and T. Bourdel, “All-optical cooling of 39K to Bose-Einstein condensation,” Phys. Rev. A 90, 033405 (2014).
- Fletcher et al. (2016) R. J. Fletcher, R. Lopes, J. Man, N. Navon, R. P. Smith, M. W. Zwierlein, and Z. Hadzibabic, “Two and three-body contacts in the unitary Bose gas,” arXiv:1608.04377 (2016).
- Fattori et al. (2008b) M. Fattori, G. Roati, B. Deissler, C. D’Errico, M. Zaccanti, M. Jona-Lasinio, L. Santos, M. Inguscio, and G. Modugno, “Magnetic dipolar interaction in a Bose-Einstein condensate atomic interferometer,” Phys. Rev. Lett. 101, 190405 (2008b).
- D’Errico et al. (2007) C. D’Errico, M. Zaccanti, M. Fattori, G. Roati, M. Inguscio, G. Modugno, and A. Simoni, “Feshbach resonances in ultracold 39K,” New Journal of Physics 9, 223 (2007).