Ultraluminous X-ray bursts in two ultracompact companions to nearby elliptical galaxies
Department of Physics and Astronomy, University of Alabama, Box 870324, Tuscaloosa, Alabama, 35487, USA.
Harvard-Smithsonian Center for Astrophysics, 60 Garden St., Cambridge, MA 02138, USA.
Department of Physics, University of Alberta, CCIS 4-181, Edmonton, AB T6G 2E1, Canada
Department of Physics & Astronomy, San José State University, One Washington Square, San Jose, CA 95192, USA.
University of California Observatories, 1156 High Street, Santa Cruz, CA 95064, USA
Space Science Center, University of New Hampshire, Durham, NH 03824, USA.
Department of Physics and Astronomy, Michigan State University, East Lansing, MI 48824, USA.
Key Laboratory of Optical Astronomy, National Astronomical Observatories, Chinese Academy of Sciences, 20A Datun Rd, Chaoyang District, Beijing, China 100012
College of Astronomy and Space Sciences, University of Chinese Academy of Sciences, 19A Yuquan Road, Beijing 100049, China
Department of Astronomy, The University of Michigan, 1085 South University Avenue, Ann Arbor, Michigan, 48103, USA.
An X-ray flaring source was found near the galaxy NGC 46971. Two flares were seen, separated by four years. The flux increased by a factor of 90 on a timescale of about one minute. Both flares were very brief. There is no optical counterpart at the position of the flares1, but if the source was at the distance of NGC 4697, the luminosities were erg s-1. Here we report the results of a search of archival X-ray data for 70 nearby galaxies looking for similar such flares. We found two flaring sources in globular clusters or ultra-compact dwarf companions of parent elliptical galaxies. One source flared once to a peak luminosity of erg s-1, while the other flared five times to erg s-1. All of the flare rise times were 1 minute, and they then decayed over about an hour. When not flaring, the sources appear to be normal accreting neutron star or black hole X-ray binaries, but they are located in old stellar populations, unlike the magnetars, anomalous X-ray pulsars or soft gamma repeaters that have repetitive flares of similar luminosities.
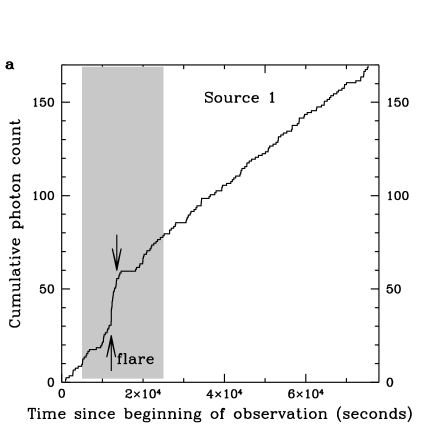
One source (hereafter Source 1) is located at RA=12:42:51.4, Dec=+02:38:35 (J2000) near the Virgo elliptical galaxy NGC 4636 ( Mpc)2,3. The cumulative X-ray photon arrival time plot and a crude background-subtracted light curve for this source derived from a 76,000 second Chandra observation taken on 2003 February 14 are shown in Figure 1. Prior to and after the flare, the X-ray count rate of the source was counts s-1 corresponding to a 0.3–10 keV luminosity of erg s-1 for a power law spectral model with a best-fit photon index of (see Methods) if the source is at the distance of NGC 4636. About 12,000 seconds into the observation, the source flared dramatically, with six photons detected in a 22 second span, leading to a conservative peak flare count rate of counts s-1, a factor of 70–200 increase in emission over its persistent (non-flare) state. Assuming the same spectral model as in the persistent state, the flare peaks at erg s-1. Following the initial 22 second burst, the source emitted at a less intense but still elevated rate for the next 1,400 seconds. In total, 25 photons were emitted during the flare, for an average X-ray luminosity of erg s-1, and a total flare energy of erg. We assess the probability of this burst being due to a random Poisson fluctuation of the persistent count rate is (see Methods). While the photon statistics during the 25-photon burst were limited, there was no evidence that the spectrum of the source differed during the flare. There are no apparent flares in the combined 370,000 seconds of the other Chandra and XMM Newton observations of NGC 4636, both before or after 2003 February 14 (see Extended Data Table 1).
A previous study4 associated Source 1 spatially with a purported globular cluster of NGC 4636 identified through Washington and Kron-Cousins system CTIO Blanco Telescope imaging5. While faint (=23.02), the optical source identified as CTIO ID 6444 had a color consistent with a globular cluster of near-solar metallicity5. Follow-up spectroscopic observations6 of a sub-sample of the globular cluster candidates in the vicinity of the globular cluster hosting Source 1 found that 52/54 (96%) of the objects with a color and magnitude similar to CTIO ID 6444 were confirmed to be globular clusters of NGC 4636, with the two remaining objects identified as foreground Galactic stars. The hard X-ray spectrum of Source 1 during its persistent phase (see Methods) argues against it being a late-type Galactic dwarf star, for which the X-ray emission tends to be quite soft. Galactic RS CVn stars exhibit hard X-ray emission in quiescence and are known to undergo X-ray flares, but RS CVn have much higher optical–to–X-ray flux ratios7 compared to Source 1. Thus, it is highly likely that the optical counterpart of Source 1 is a globular cluster within NGC 4636. Based on its absolute magnitude and , we estimate the globular cluster to have a mass of M⊙ (see Methods).
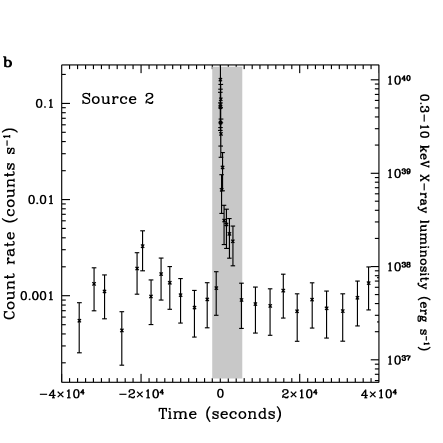
A second X-ray source located near the elliptical galaxy NGC 5128 showed similar flaring behavior. In the 2007 March 30 Chandra observation of NGC 5128, a source at RA=13:25:52.7, Dec=43:05:46 (J2000; hereafter Source 2) began the observation emitting at a count rate of counts s-1 corresponding to a 0.3–10 keV luminosity of erg s-1 using the best-fit power law photon index and a distance8 of 3.8 Mpc for NCG 5128. Midway through the observation, the source flared dramatically, with 10 photons detected in a 51 second time span corresponding to a conservative peak luminosity estimate of erg s-1, after which the flare subsided. Following the flare, Source 2 returned to its pre-flare luminosity for the remainder of the observation.
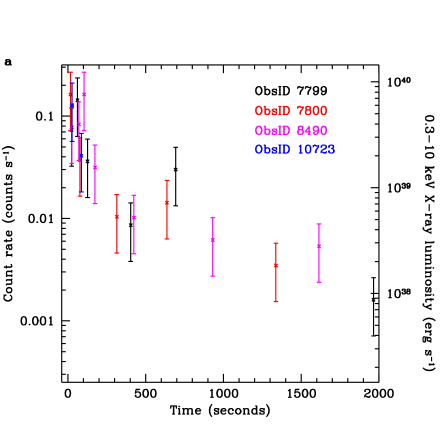
Inspection of other archival Chandra and XMM-Newton data (see Extended Data Table 1) revealed four more flares of Source 2. Three were observed with Chandra on 2007 April 17, 2007 May 30, and 2009 January 4, respectively, while the fourth flare was observed with XMM-Newton on 2014 February 9. In each instance, during the initial fast (30 seconds) rise of the flare the count rate increased by a factor of 200–300 over the persistent count rate to erg s-1, after which the flare subsided. The total flare energy of each of the five flares was erg. The light curves for the four Chandra flares look remarkably similar, as illustrated in Figure 2. We combined these four light curves into a combined background-subtracted light curve (see Methods for details) in Figure 2. Following the fast rise of the source by a factor 200 to a peak luminosity approaching erg s-1, the source remained in a roughly steady ultraluminous state for 200 seconds before decaying over a time span of 4,000 seconds (Figure 2). Fitting a power law to the combined spectra of the four Chandra flares yielded a best-fit photon index of . Thus, much like Source 1, the spectrum of Source 2 did not change appreciably during the flare.
Source 2 has been previously identified with the object HGHH-C21 (also called GC 0320) within NGC 51289-11. With a spectroscopically-determined recessional velocity10 (460 km s-1) within 110 km s-1 of NGC 5128, the source is clearly at the distance of NGC 5128. This implies a projected half-light radius12 of 7 pc. With a velocity dispersion of 20 km s-1 and an inferred stellar mass12 of M⊙, the optical counterpart is either a massive globular cluster or, given its unusual elongated shape, more likely an ultracompact dwarf companion galaxy of NGC 5128.
It is unlikely that the flaring and the steady emission in both sources can be attributed to two unrelated sources in the same host. Since our flare search technique would have found these flares had they been detected by their flare photons alone, we can calculate the probability that these globular clusters would have also hosted steady X-ray emission more luminous than the persistent emission in each globular cluster (see Methods). The globular cluster in Source 1 has a 0.3% probability of having an X-ray source with a luminosity more than erg s-1, while the globular cluster/ultracompact dwarf in Source 2 has a 9% probability of having an X-ray source with a luminosity more than erg s-1. Multiplying these probabilities leads to only a 0.02% chance that both flares are unrelated to the steady emission. Of course, in the unlikely event that the flares are distinct sources from the persistent sources, the flaring sources must be flaring by more than two orders of magnitude over whatever their true non-flare luminosities are.
Summing up all the available archival Chandra and XMM-Newton data (but omitting the Chandra HRC and transmission grating exposures, which are not sensitive enough to detect a flare of similar intensity seen in the ACIS observations) allows us to constrain the duty cycle and recurrence rate of the flares. Source 2 flared five times for a total combined flare time of 20,000 seconds in a total observation time of seconds, yielding one flare every 1.8 days and a duty cycle of 2.5%. Source 1 flared once for 1,400 seconds in a total observation time of 370,000 seconds. This single flare implies a recurrence timescale of 4 days and duty cycle of 0.4%.
In terms of energetics, variability, and survivability, only short and intermediate duration soft gamma repeaters (SGRs)13 and their cousins the anomalous X-ray pulsars (AXPs)14 are comparable to the sources discussed here. However, SGRs/AXPs are believed to be very young and highly magnetized neutron stars, which would not likely be found in an old stellar population such as a globular cluster or red ultracompact dwarf galaxy. Our sources are also unlike SGRs/AXPs in that SGR/AXP flares of this magnitude only last a few to a few tens of seconds15,16 without an hour long decay as seen in our sources. Our sources are also unlikely to be Type II X-ray bursts of neutron stars, believed to result from rapid spasmodic accretion onto the neutron star. In addition to having flare–to–pre-flare luminosity ratios of only 10–20, the only Type II burst to reach erg s-1 (GRO 1744-28 – the Bursting Pulsar) exhibits several sub-minute flares per day when flaring, with much lower total flare energies per burst than our sources and different timing properties from our sources17. Furthermore, the quiescent X-ray luminosity of the Bursting Pulsar is 4–5 orders of magnitude fainter than the long-term luminosities of our sources. Qualitatively, the fast rise–slower decay of Source 2 (Figure 2) resembles that of Type I bursts from Galactic neutron stars, which typically peak near the Eddington limit of a neutron star. However, the peak luminosities from Sources 1 and 2 are 1–2 orders of magnitude greater than the Type I limit for even helium accretion, and last more than an order of magnitude longer. Rare superbursts from Galactic neutron stars have been known to last for an hour18,19 but also have peak luminosities well below those of our sources. Other X-ray flares of unknown source published in the literature20-22 appear to be one-time transient events, indicating that they were (most likely) cataclysmic events with no post-flare emission, unlike our sources.
We have investigated the light curves of several thousand X-ray point sources within 70 Chandra observations of nearby galaxies and found only these two examples. It would appear that the Milky Way has no analogs to our sources. Given the number of X-ray sources in the Milky Way brighter than erg s-1 (40)23, the lack of X-ray binaries more luminous than ergs s-1 in Galactic globular clusters, and the rarity of burst sources in the extragalactic sample, this is not surprising. The nature of these sources remains uncertain. The increased emission might result from a narrow cone of beamed emission crosses our line of sight every few days. It is unclear, however, how a pulsed beam would lead to the distinctly asymmetric fast rise–slower decay profile. Alternatively, the flare might represent a period of rapid highly super-Eddington accretion onto a neutron star or stellar-mass black hole, perhaps during the periastron passage of a donor companion star in an eccentric orbit around a compact object. Such a explanation has been suggested to explain observed (albeit neutron star Eddington-limited) flares in galaxies1,24. Finally, the high X-ray luminosity during the peak of the flare might represent accretion onto an intermediate-mass black hole. If the flares are Eddington-limited, black hole masses of 800 M⊙ and 80 M⊙ are implied for Sources 1 and 2, respectively, assuming a bolometric correction of 1.1 appropriate for a 2 keV disk blackbody temperature spectral model. The fast rise times constrain the maximum mass of a putative black hole, since the rise time cannot be shorter than the light travel time across the innermost stable circular orbit of the black hole. For both sources, the fastest rise happened over a 22 second period, implying an upper limit on the mass of a maximally-rotating black hole of M⊙. A black hole in this mass range is a particularly intriguing explanation for Source 2 if indeed its host is the stripped core of a dwarf galaxy.
References
[1.] Sivakoff, G. R., Sarazin, C. L. & Jordán, A. Luminous X-Ray Flares from Low-Mass X-Ray Binary Candidates in the Early-Type Galaxy NGC 4697. Astrophys. J. 624, L17–L20 (2005).
[2.] Tonry, J. L. et al. The SBF Survey of Galaxy Distances. IV. SBF Magnitudes, Colors, and Distances. Astrophys. J. 546, 681–693 (2001).
[3.] Mei, S. et al. The ACS Virgo Cluster Survey. XIII. SBF Distance Catalog and the Three-dimensional Structure of the Virgo Cluster. Astrophys. J. 655, 144–162 (2007).
[4.] Posson-Brown, J., Raychaudhury, S., Forman, W., Donnelly, R. H., & Jones, C. Chandra Observations of the X-Ray Point Source Population in NGC 4636. Astrophys. J. 695, 1094–1110 (2009).
[5.] Dirsch, B., Schuberth, Y. & Richtler, T. A wide-field photometric study of the globular cluster system of NGC 4636. Astron. Astrophys. 433, 43–56 (2005).
[6.] Schuberth, Y. et al. Dynamics of the NGC 4636 globular cluster system. An extremely dark matter dominated galaxy? Astron. Astrophys. 459, 391–406 (2006).
[7.] Pandey, J. C. & Singh, K. P. A study of X-ray flares - II. RS CVn-type binaries. Mon. Not. R. Astron. Soc. 419, 1219–1237 (2012).
[8.] Harris, G. L. H., Rejkuba, M. & Harris, W. E. The Distance to NGC 5128 (Centaurus A). Publ. Astron. Soc. Australia 27, 457–462 (2010).
[9.] Harris, G. L. H., Geisler, D., Harris, H. C., & Hesser, J. E. Metal abundances from Washington photometry of globular clusters in NGC 5128. Astron. J. 104, 613–626 (1992).
[10.] Woodley, K. A. et al. The Kinematics and Dynamics of the Globular Clusters and Planetary Nebulae of NGC 5128. Astron. J. 134, 494–510 (2007).
[11.] Woodley, K. A. et al. Globular Clusters and X-Ray Point Sources in Centaurus A (NGC 5128). Astrophys. J. 682, 199–211 (2008).
[12.] Mieske, S. et al. On central black holes in ultra-compact dwarf galaxies. Astron. Astrophys. 558, A14 (2013).
[13.] Kouveliotou, C. et al. An X-ray pulsar with a superstrong magnetic field in the soft -ray repeater SGR1806-20. Nature 393, 235–237 (1998).
[14.] Mereghetti, S. & Stella, L. The very low mass X-ray binary pulsars: A new class of sources? Astrophys. J. 442, L17–L20 (1995).
[15.] Olive, J-. F. et al. Time-resolved X-Ray Spectral Modeling of an Intermediate Burst from SGR 1900+14 Observed by HETE-2 FREGATE and WXM. Astrophys. J. 616, 1148–1158 (2004).
[16.] Kozlova, A. V. R et al. The first observation of an intermediate flare from SGR 1935+2154. Mon. Not. R. Astron. Soc. 460, 2008 (2016).
[17.] Younes, G. et al. Simultaneous NuSTAR/Chandra Observations of the Bursting Pulsar GRO J1744-28 during Its Third Reactivation. Astrophys. J. 804, 43 (2015).
[18.] Cornlisse, R., Heise, J., Kuulkers, E., Verbunt, F., & in’t Zand, J. J. M. The longest thermonuclear X-ray burst ever observed?. A BeppoSAXWide Field Camera observation of 4U 1735-44. Astron. Astrophys. 357, L21–L24 (2000).
[19.] Strohmayer, T. E. & Beown, E. F. A Remarkable 3 Hour Thermonuclear Burst from 4U 1820-30. Astrophys. J. 556, 1045–1059 (2002).
[20.] Jonker, P. G. et al. Discovery of a New Kind of Explosive X-Ray Transient near M86. Astrophys. J. 779, 14 (2013).
[21.] Luo, B., Brandt, W. N. & Bauer, F. Discovery of a fast X-ray transient in the Chandra Deep Field-South survey. The Astronomer s Telegram 6541, 1 (2014).
[22.] Glennie, A., Jonker, P. G., Fender, R. P., Nagayama, T., & Pretorius, M. L. Two fast X-ray transients in archival Chandra data. Mon. Not. R. Astron. Soc. 450, 3765–3770 (2015).
[23.] Grimm, H.-J.., Gilfanov, M. & Sunyaev, R. The Milky Way in X-rays for an outside observer. Log(N)-Log(S) and luminosity function of X-ray binaries from RXTE/ASM data. Astron. Astrophys. 391, 923–944 (2002).
[24.] Maccarone, T. J. An explanation for long flares from extragalactic globular cluster X-ray sources. Mon. Not. R. Astron. Soc. 364, 971–976 (2005).
Acknowledgments: We thank Tom Richtler for helpful discussions. J.A.I. was supported from Chandra grant AR6-17010X and NASA ADAP grant NNX10AE15G. G.R.S. acknowledges support of an NSERC Discovery Grant. A.J.R was supported by the National Science Foundation grant AST-1515084. J.S. acknowledges support from NSF grants AST-1308124 and AST-1514763 and the Packard Foundation.
Author Contributions: J.A.I. led the Chandra data reduction and analysis, with contributions from W.P.M for the XMM-Newton data reduction and analysis. T.S., I.P., and D.M. conducted the Chandra galaxy survey that yielded the two flare sources, with oversight from J.A.I. G.R.S., A.J.R., D.L., J.S., J.L., and J.M.M. contributed to the discussion and interpretation.
Competing Interests: The authors declare that they have no competing financial interests.
Correspondence: Correspondence and requests for materials should be addressed to J.A.I. (jairwin@ua.edu).


Methods
Flare Search Technique
We searched for flares from all point sources found in 70 Chandra observations of nearby luminous early-type galaxies. The evt2 files were downloaded from the Chandra archive, and the source detection routine wavdetect in the Chandra Interactive Analysis of Observations (CIAO) package suite on the image files to create a list of sources detected at the 3 level. Our script then extracted the time-ordered photon arrival times for each source found by wavdetect. Next, our routines scanned the photon event list and searched for bursts by finding the time difference between each photon and the photon three photons forward in time from it (i.e., a 4-photon burst) and then calculated the Poisson probability of detecting that many photons over that time interval given the overall count rate of the source over the entire observation and the number of 4-photon burst trials present over the epoch. This was repeated for 5-photon bursts, 6-photon bursts, 7-photon bursts, etc., up to 20-photon bursts. If the probability of a burst of that magnitude from Poisson fluctuations was below our fiducial value (1 in ) and the count rate during the N-photon burst was more than ten times the average count rate of the source over the observation the source was marked for further study. Note that our technique is more sophisticated than a simple KS-test on this distribution. Our technique found several flares from Milky Way M dwarf stars, both previously known and unknown, which were removed from consideration. Among the 7,745 sources detected in the 70 observations, Source 1 and Source 2 were the only non-Galactic sources not previously detected by other groups (which appear to be transients or one-time events20-22) that were identified for which the random Poisson fluctuation probability was less than , and for which peak–to–persistent count ratio exceeded ten (to exclude somewhat variable, but non-flaring sources).
Chandra and XMM-Newton Data Reduction
Those Chandra observations containing flares were then analyzed further using CIAO 4.7 with CALDB version 4.6.9. The sources exhibited flaring only in ObsIDs 3926 (for Source 1) and in ObsIDs 7799, 7800, 8490, and 10723 (for Source 2). The remaining three and 36 ObsIDs for Source 1 and Source 2, respectively, showed no flaring activity, did not have the source in the field of view of the detector, or the data were taken with a lower sensitivity detector (Chandra HRC/LETG/HETG) for which a flare of comparable intensity would not have been detected. Extended Data Table 1 lists all the searched Chandra and XMM-Newton observations of NGC 4636 and NGC 5128. The luminosity of the sources in the non-flare observations were consistent with the persistent luminosities of the sources during the flare observations. All flares occurred in ACIS-I pointings. The event lists were reprocessed using the latest calibration files at the time of analysis with the CIAO tool chandra_repro. None of the Chandra observations had any background flaring time intervals significant enough to warrant their removal considering we are interested in point sources. Energy channels below 0.3 keV and above 6.0 keV were ignored. Both Sources 1 and 2 were located at least from the ACIS-I aim point in all the observations, so we used the CIAO tool psfsize_srcs to determine the extraction radius for each observation that enclosed 90% of the source photons at an energy of 2.3 keV. All subsequent count rates and 0.3–10 keV X-ray luminosities were corrected for these point spread function (PSF) losses. Since each flare occurred at a large off-axis angle from the aim point, the photons were spread over a large PSF. Thus pile-up effects were negligible even at the peak of each flare. We do not believe there is any way for the flares to be an instrumental effect such as pixel flaring or cosmic ray afterglows, for which each recorded event during the flare would occur in a single detector pixel. Inspection of all the flare observations in detector coordinates revealed that the photons were not concentrated in a single detector pixel, but were instead spread out in detector space in accordance with the dither pattern of Chandra as would be expected from astrophysical photons. Furthermore, the photon energies of cosmic ray afterglows decrease with each successive photon which is not the case for the photons occurring during the flare.
While we did not conduct a survey of galaxies observed with XMM-Newton, we did utilize archival XMM-Newton data to search for additional flares from Source 1 and 2. The XMM-Newton observations for Source 1 did not reveal any detectable flaring behavior, but the 2014 February 9 (ObsID 0724060801) of Source 2 revealed a fifth flare for this source detected in both MOS1 and MOS2 detectors separately. To analyze the data, we used the 2014 November 4 release of the XMM-Newton Science Analysis Software (SAS), and the data were processed with the tool emproc, which filtered the data for the standard MOS event grades. Source 2 was only observed with the two MOS instruments, since it was not in the PN camera field of view (the observations used a restricted window due to the high count rate of the central AGN in NGC 5128). Periods of high background at the end of the observation were removed.
Cumulative Photon Arrival Time Plots for Sources 1 and 2
Each X-ray photon collected by Chandra or XMM-Newton is tagged with a position, energy, and time of arrival, allowing a photon-by-photon account of each X-ray source at a time resolution set by the read-out time for the detector (3.1 seconds for Chandra ACIS-I and 2.6 seconds for XMM-Newton EPIC MOS). Cumulative photon arrival time plots are a simple way to observe time variability over the course of the observation. While a source with constant flux will yield a cumulative photon arrival time plot with a constant slope, a flare will appear as a nearly vertical rise in the plot as photons stream in over a short period of time. Figure 1 shows the cumulative photon arrival time plot for Source 1, illustrating the onset of the flare around the 12,000 second mark following the beginning of the observation.
The cumulative photon arrival time plot from each of the five flares from Source 2 is shown in Extended Data Figure 1. In each plot the beginning of the flare is evident. The final Chandra flare (ObsID 10723) occurred just at the end of this short observation. The persistent count rate within the 10′′ source extraction region of the XMM-Newton observation is compromised by background, but the onset of the flare at the 16,000 second mark is evident.
Peak Flare Rate and the Statistical Significance of the Flares
We estimated the peak flare rate of Source 1 based on the arrival times of the first six photons of the flare, which arrived over a 22 second period. Given the uncertainty in when the peak ended, we neglect the sixth photon of the flare to conservatively estimate a count rate of counts s-1 (1 uncertainty) after correcting for the 10% of emission expected to be scattered out of the source extraction region due to PSF losses. Background was negligible during the flare, and accounted for only 7% of the emission inside the source extraction region during persistent times.
Since Source 1 only flared once, it is necessary to determine accurately how many independent trials were contained in the sources searched within our sample of galaxies to determine the likelihood that the flare could result from a random fluctuation in the persistent count rate. The two sources discussed here were found as part of a 70 observation sample observed with Chandra composed primarily of large elliptical galaxies at distances of 20 Mpc and closer, with a majority of the galaxies residing in Virgo or Fornax. Within these 70 observations, 7,745 sources were detected yielding a total of photons. This is equivalent to independent 5-photon groupings. Statistically, the chance of detecting five or more photons in 22 seconds for a source that normally emits at counts s-1 (the count rate in the persistent state before correcting for PSF losses) is . With independent trials throughout our sample, the chance of finding a single 5-photon burst for the Source 1 flare is . Searching over multiple photon burst scales increases the odds of finding a chance statistical fluctuation. A previous study1 performing a similar calculation has calculated this correction factor to be 2.5 using Monte Carlo simulations, so we apply that correction here leading to a false detection rate of . A similar exercise for the entire burst (25 photons in 1,400 seconds) leads to a chance fluctuation probability of .
A similar exercise can be performed for each flare detected in Source 2 by Chandra observations. In each case, the flare at its peak was detected using nine photons in 51 seconds, six photons in 22 seconds, seven photons in 22 seconds, and six photons in 37 seconds, respectively. Given the persistent count rates in each observation, and correcting appropriately for both the number of independent 9-photon, 6-photon, and 7-photon trials (i.e., scaling appropriately from the independent 5-photon trials) and the multi-burst search correction factor of 2.5, we calculate probabilities of , , , and of a false flare detection for each flare, respectively. Since we only considered XMM-Newton data after having detected the flares in the Chandra data, the probability that the flare observed with XMM-Newton was falsely detected is given the 113,000 seconds of total exposure on this source. When combined this gives a probability that all the flares were falsely detected is .
X-ray Light Curves
Owing to the limited photon statistics for the flare in Source 1, only a crude X-ray light curve was obtained by binning photons in groups of five and determining the count rate over which the five photons were collected (Figure 1). The four individual 5-photon bin Chandra light curves for Source 2 showed similar timing behavior (Figure 2), which gave us confidence to combine them into one light curve. For each flare, we determined the average arrival time of the first three photons of the flare and set this to ‘time zero’. Thus, photons before the flare were assigned a negative time value. The four photon lists were then combined at ‘time zero’ to provide a combined photon list. Photons were then binned in groups of ten to calculate count rates during the time period over which the ten photons were collected. The count rates were divided by four to give the average count rate per time bin per flare. Since the fourth Chandra epoch (ObsID 10723) was very short and does not extend from –40,000 seconds to 40,000 seconds from the start of the flare, we corrected the count rate accordingly to account for the temporal coverage of this epoch. The count rates were corrected for the loss of photons outside the extraction region due to the PSF, and for the expected background (while negligible during the flare, this accounted for 14% of the emission during persistent periods). The combined light curve for Source 2 is shown in Figure 2. A sharp rise at the beginning of the flare was followed by a flat ultraluminous state for 200 seconds. The improvement in statistics by combining the four light curves traces the duration of the decay in flux out to 4,000 seconds. Following the flare, the count rate of the source was remarkably consistent with the pre-flare count rate.
Spectral Fitting and Source Luminosities
For Source 1, we extracted a combined spectrum during the pre- and post-flare period using the CIAO tool specextract. Background was collected from a source-free region surrounding our source. Using XSPECv12.8, a power law model absorbed by the Galactic column density in the direction of NGC 4636 ( cm-2)25 using the tbabs absorption model was employed to fit the background-subtracted spectrum. Only energy channels over the range 0.5–6.0 keV were considered in the fit. The spectrum was grouped to contain at least one count per channel and the C-statistic was used in the fit. A best-fit power law photon index of (90% uncertainty) was found. This fit implies an unabsorbed luminosity of erg s-1 during the persistent state (all reported luminosities below have also been corrected for absorption). Since the flare period contained only 25 photons, the flare spectrum was poorly well-constrained (). This led to a peak luminosity during the first 22 seconds of the flare of erg s-1, a factor of 120 greater than during persistent periods combined. Freeing the absorption did not substantially change the fit. Fitting the flare with a disk blackbody model gave a slightly worse fit with keV and a luminosity 30% less than the power law fit.
For Source 2, we combined the spectra from the flare periods of the four Chandra observations using specextract into one spectrum. The same was done for the pre- and post-flare periods combined. The best-fit power law photon indices for persistent and flare periods assuming a Galactic column density in the direction of NGC 5128 ( cm-2)25 were and (90% uncertainty), respectively. Again, this indicates no significant change in the spectral shape during the flare. These spectral models implied persistent and peak flare luminosities of erg s-1 and erg s-1, respectively, an increase of 200 in less than a minute. When we split the flare period into the flat ultraluminous (first 200 seconds) and decay times (200–4,000 seconds), we also found no significant spectral evolution. We allowed the Galactic column density to vary in the fits and found a somewhat softer photon index ( in the persistent state and during the flare) with cm-2 for the persistent state and unconstrained below cm-2 during the flare (90% uncertainties for two interesting parameters). In both instances, freeing the absorption only changed the unabsorbed by 10%. The source does not reside in the dust lane of NGC 5128, so this excess absorption, if real, might be intrinsic to the source. We also fitted the flare spectrum with a disk blackbody model with fixed at the Galactic value and found a best-fit temperature of keV, with a comparable goodness-of-fit to that of the power law model and a luminosity 20% below that derived from the power law fit.
For the XMM-Newton observation, the spectrum and response files were generated using the standard SAS tasks evselect, backscale, arfgen, and rmfgen. Since the count rate during the pre- and post-flare time period is dominated by background (owing to the much larger extraction region compared to Chandra and higher background rates), we did not extract a spectrum for the persistent period. We extracted the background-subtracted flare spectrum in a 30′′ region around the source and fitted it with the absorbed power law described above for Chandra observations. The slope of the power law was poorly-constrained () owing to the low number of photons detected in the flare, but the slope was consistent with the fit from the co-added Chandra spectrum. The peak luminosity of the flare was erg s-1, again consistent with the Chandra flares.
Probability of the Flare and Persistent Emission Being From Two Different Sources
We have assumed that the persistent and flare emission emanate from a single source within the globular cluster hosts of Sources 1 and 2, but it is possible that two separate sources in the same cluster are responsible for the emission. The probability that a globular cluster hosts an X-ray binary of a particular X-ray luminosity depends on the luminosity of the source26, as well as the properties of the globular cluster such as its mass, concentration, and metal abundance27,28. From previous work27, the number of X-ray sources more luminous than erg s-1 in a globular cluster that has a mass , stellar encounter rate , half-light radius , and cluster metallicity is , where .
The globular cluster hosting Source 1 has photometry in Kron-Cousins -band and Washington filters; and . This color corresponds to a photometrically derived metallicity of /H = –0.08 dex ( = 0.8 )29. Using a single population model30 given a Kroupa initial mass function, 13 Gyr age, and /H = –0.08 dex, an of 4.1 in -band is expected for this cluster. Given the distance to NGC 4636 (), the -band referenced above, and , we estimate a globular cluster mass of M⊙. Since we have no size measurement for this globular cluster, we conservatively estimate a minimum size of 1.5 pc, which is the 3 lower limit based on a survey of globular clusters in the Virgo cluster31. With these values, we estimate the globular cluster is expected to have 0.017 X-ray binaries above erg s-1. To determine the number of X-ray binaries expected above the observed persistent X-ray luminosity of Source 1, we apply the X-ray luminosity function in globular clusters found in a previous study26, which predicts that the Source 1 persistent luminosity ( erg s-1) is ten times less likely to be found in a globular cluster than a erg s-1 source. This leads to an estimate of 0.0017 X-ray sources equal to or more luminous than Source 1. Thus, after having found a flaring source, the probability that the persistent emission comes from a different X-ray binary in this cluster is 0.17%. If we conservatively assume that the predicted number of LMXBs could be 50% higher (approximately convolving all of the uncertainty sources), the probability is 0.24%.
The globular cluster/ultracompact dwarf galaxy hosting Source 2 has a spectroscopically-determined metallicity of /H = –0.85 dex ( = 0.14 )32. The derived stellar mass12 of the source is M⊙. Given its size12 of 7 pc, and correcting for the luminosity function26 (which predicts that a erg s-1 source is ten times more likely to be found in a globular cluster than a erg s-1 source), we estimate the globular cluster is expected to have 0.064 X-ray binaries above erg s-1. Thus after having found a flaring source, the probability that the persistent emission comes from a different X-ray binary in this cluster is 6.4%. If we conservatively assume that the predicted number of LMXBs could be 50% higher (approximately convolving all of the uncertainty sources), the probability is 9.1%. We note that this might be an overestimate given that ultracompact dwarfs appear to harbor X-ray sources at a lower rate than globular clusters33.
Even in the most conservative case, the combined probability that both sources arise from different sources than the persistently emitting sources is .
For both sources, we determined the position of the sources separately during its flare phase and persistent phase and found no statistical difference within the positional uncertainties. This is not highly constraining, however, given the large PSF of Chandra at the off-axis location of the flares.
Code availability:
The code to find X-ray flares is available at
http://pages.astronomy.ua.edu/jairwin/software/.
References
[25.] Dickey, J. M. & Lockman, F. J. H I in the Galaxy. Annu. Rev. Astron. Astrophys. 28, 215–261 (1990).
[26.] Zhang, Z. et al. Luminosity functions of LMXBs in different stellar environments. Mon. Not. R. Astron. Soc. 533, A33 (2011).
[27.] Sivakoff, G. R. et al. The Low-Mass X-Ray Binary and Globular Cluster Connection in Virgo Cluster Early-Type Galaxies: Optical Properties. Astrophys. J. 660, 1246–1263 (2007).
[28.] Kundu, A., Maccarone, T. J. & Zepf, S. E. Probing the Formation of Low-Mass X-Ray Binaries in Globular Clusters and the Field. Astrophys. J. 662, 525–543 (2007).
[29.] Harris, W. E. & Harris, G. L. H. The Halo Stars in NGC 5128. III. An Inner Halo Field and the Metallicity Distribution. Astron. J. 123, 3108–3123 (2002).
[30.] Maraston, C. Evolutionary population synthesis: models, analysis of the ingredients and application to high-z galaxies. Mon. Not. R. Astron. Soc. 362, 799–825 (2005).
[31.] Jórdan, A. et al. The ACS Virgo Cluster Survey. X. Half-Light Radii of Globular Clusters in Early-Type Galaxies: Environmental Dependencies and a Standard Ruler for Distance Estimation. Astrophys. J. 634, 1002–1019 (2005).
[32.] Beasley, M. A. et al. A 2dF spectroscopic study of globular clusters in NGC 5128: probing the formation history of the nearest giant elliptical. Mon. Not. R. Astron. Soc. 386, 1443–1463 (2008).
[33.] Pandya, V., Mulchaey, J. & Greene, J. E. A Comprehensive Archival Chandra Search for X-Ray Emission from Ultracompact Dwarf Galaxies. Astrophys. J. 819, 162 (2016).
| Source | Telescope/Detector | ObsID | Observation Date | Exposure (ksec) | Flare? |
|---|---|---|---|---|---|
| 1 | Chandra/ACIS-I | 324 | 1999-12-04 | 8.5 | N |
| 1 | Chandra/ACIS-S | 323 | 2000-01-26 | 53.1 | N |
| 1 | XMM-Newton/EPIC | 0111190101 | 2000-07-13 | 27.2 | N |
| 1 | XMM-Newton/EPIC | 0111190501 | 2000-07-13 | 6.6 | N |
| 1 | XMM-Newton/EPIC | 0111190201 | 2000-07-13 | 66.3 | N |
| 1 | XMM-Newton/EPIC | 0111190701 | 2001-01-05 | 64.4 | N |
| 1 | Chandra/ACIS-I | 3926 | 2003-02-15 | 75.7 | Y |
| 1 | Chandra/ACIS-I | 4415 | 2003-02-15 | 75.3 | N |
| 2 | Chandra/HRC-I | 463 | 1999-09-10 | 19.7 | N |
| 2 | Chandra/HRC-I | 1253 | 1999-09-10 | 6.9 | N |
| 2 | Chandra/ACIS-I | 316 | 1999-12-05 | 36.2 | |
| 2 | Chandra/HRC-I | 1412 | 1999-12-21 | 15.1 | N |
| 2 | Chandra/HRC-I | 806 | 2000-01-23 | 65.3 | N |
| 2 | Chandra/ACIS-I | 962 | 2000-05-17 | 37.0 | N |
| 2 | XMM-Newton/EPIC | 0093650201 | 2001-02-02 | 23.9 | N |
| 2 | Chandra/ACIS-S/HETG | 1600 | 2001-05-09 | 47.5 | N |
| 2 | Chandra/ACIS-S/HETG | 1601 | 2001-05-21 | 52.2 | N |
| 2 | XMM-Newton/EPIC | 0093650301 | 2002-02-06 | 15.3 | N |
| 2 | Chandra/ACIS-S | 2978 | 2002-09-03 | 45.2 | |
| 2 | Chandra/ACIS-S | 3965 | 2003-09-14 | 50.2 | |
| 2 | Chandra/ACIS-I | 7797 | 2007-03-22 | 98.2 | N |
| 2 | Chandra/ACIS-I | 7798 | 2007-03-27 | 92.0 | N |
| 2 | Chandra/ACIS-I | 7799 | 2007-03-30 | 96.0 | Y |
| 2 | Chandra/ACIS-I | 7800 | 2007-04-17 | 92.1 | Y |
| 2 | Chandra/ACIS-I | 8489 | 2007-05-08 | 95.2 | N |
| 2 | Chandra/ACIS-I | 8490 | 2007-05-30 | 95.7 | Y |
| 2 | Chandra/ACIS-I | 10723 | 2009-01-04 | 5.2 | Y |
| 2 | Chandra/ACIS-I | 10724 | 2009-03-07 | 5.2 | N |
| 2 | Chandra/HRC-I | 10407 | 2009-04-04 | 15.2 | N |
| 2 | Chandra/ACIS-I | 10725 | 2009-04-26 | 5.0 | N |
| 2 | Chandra/ACIS-I | 10726 | 2009-06-21 | 5.2 | N |
| 2 | Chandra/ACIS-S | 10722 | 2009-09-08 | 50.0 | |
| 2 | Chandra/HRC-I | 10408 | 2009-09-14 | 15.2 | N |
| 2 | Chandra/ACIS-I | 11846 | 2010-04-26 | 4.8 | N |
| 2 | Chandra/ACIS-I | 11847 | 2010-09-16 | 5.1 | |
| 2 | Chandra/ACIS-I | 12155 | 2010-12-22 | 5.1 | N |
| 2 | Chandra/ACIS-I | 12156 | 2011-06-22 | 5.1 | N |
| 2 | Chandra/ACIS-I | 13303 | 2012-04-14 | 5.6 | N |
| 2 | Chandra/ACIS-I | 13304 | 2012-08-29 | 5.1 | N |
| 2 | Chandra/ACIS-I | 15294 | 2013-04-05 | 5.1 | N |
| 2 | XMM-Newton/EPIC | 0724060501 | 2013-07-12 | 12.0 | N |
| 2 | XMM-Newton/EPIC | 0724060601 | 2013-08-07 | 12.0 | N |
| 2 | Chandra/ACIS-I | 15295 | 2013-08-31 | 5.4 | N |
| 2 | XMM-Newton/EPIC | 0724060701 | 2014-01-06 | 26.5 | N |
| 2 | XMM-Newton/EPIC | 0724060801 | 2014-02-09 | 23.4 | Y |
| 2 | Chandra/ACIS-I | 16276 | 2014-04-24 | 5.1 | N |
| 2 | Chandra/ACIS-I | 16277 | 2014-09-08 | 5.4 | |
| 2 | Chandra/ACIS-I | 17471 | 2015-03-14 | 5.4 | N |
| 2 | Chandra/ACIS-S/LETG | 17147 | 2015-05-13 | 49.7 | N |
| 2 | Chandra/ACIS-S/LETG | 17657 | 2015-05-17 | 50.4 | N |
Extended Data Table 1: Summary of the Chandra and XMM-Newton Observations of Source 1 and 2
![[Uncaptioned image]](/html/1610.05781/assets/x6.png)
![[Uncaptioned image]](/html/1610.05781/assets/x7.png)
![[Uncaptioned image]](/html/1610.05781/assets/x8.png)
![[Uncaptioned image]](/html/1610.05781/assets/x9.png)
![[Uncaptioned image]](/html/1610.05781/assets/x10.png)
Extended Data Figure 1: The cumulative X-ray photon arrival time plots for the five flares of Source 2 in NGC 5128. The first four flares were observed by Chandra with the fifth flare by XMM-Newton. In ObsID 10723, the first photon of the observation was not received until 1100 seconds after the observation began, and the observation ended mid-flare.