22institutetext: Graduate School, University of the Chinese Academy of Science, 19A, Yuquan Road, Beijing 100049, China
What is the right way to quench star formation in semi-analytic model of galaxy formation?
Abstract
Semi-analytic models of galaxy formation are powerful tools to study the evolution of galaxy population in a cosmological context. However, most models over-predict the number of low-mass galaxies at high redshifts and the color of model galaxies are not right in the sense that low-mass satellite galaxies are too red and centrals are too blue. The recent version of the L-Galaxies model by Henriques et al.(H15) is a step forward to solve these problems by reproducing the evolution of stellar mass function and the overall fraction of red galaxies. In this paper we compare the two model predictions of L-Galaxies (the other is Guo et al. , G13) to the SDSS data in detail. We find that in the H15 model the red fraction of central galaxies now agrees with the data due to their implementation of strong AGN feedback, but the stellar mass of centrals in massive haloes is now slightly lower than the data. For satellite galaxies, the red fraction of low-mass galaxies () also agrees with the data, but the color of massive satellites () is slightly bluer. The correct color of centrals and bluer color of massive satellites indicate that the quenching in massive satellites are not strong enough. We also find that there are too much red spirals and less bulge-dominated galaxies in both H15 and G13 models. Our results suggest that additional mechanisms, such as more minor merger or disk instability, are needed to slightly increase the stellar mass of central galaxy in massive galaxies, mainly in the bulge component, and the bulge dominated galaxy will be quenched or then be quenched by any other mechanisms.
keywords:
galaxies:evolution - galaxies:formation - galaxies:star formation1 Introduction
The standard cold dark matter model is now very successful to explain the structure formation in the universe from the very early beginning up to the present (see the review by Frenk & White 2012). The nature of dark matter and dark energy is the main science goal of next generation sky surveys, such as EUCLID and LSST. On the other hand, the wealth data of galaxy from the ongoing and future surveys is very useful for the study of galaxy formation and evolution. Although many efforts have been made to modelling of galaxy formation, it is fair to say that there is no any model which can simultaneously well reproduce the various properties of galaxies from the local surveys, for example the Sloan Digital Sky Survey. In that sense, our understanding of galaxy formation lags behind our knowledges about the evolution of dark structure which is accessible using large N-body simulations (e.g., Springel et al. 2005) .
Hydro-dynamical simulation and semi-analytic models are powerful physical tools to study galaxy formation and evolution in a cosmological context. The state-of-art hydro-dynamical simulations are now being able to reproduce many properties of galaxies in typical cosmological volumes (e.g., Vogelsberger et al. 2014; Schaye et al. 2015), but due to the expensive cost of running huge and high-resolution hydro-dynamical simulations, it is difficult to test how galaxy properties correspond to adopted physical models of star formation and feedback. Unlike hydro-dynamical simulations, SAMs are based on N-body simulations, and they take simple phenomenological descriptions of the physical precesses about galaxy formation, such as cosmic reionization, hot gas cooling and cold gas infall, star formation and metal production, SN feedback, gas stripping and tidal disruption of satellites, galaxy mergers, bulge formation, black hole growth and AGN feedback. SAMs are developing quickly in the past decades and most basic features of galaxy formation are already included in the earlier versions of SAMs (e.g. White & Frenk 1991; Somerville & Primack 1999; Kang et al. 2005; Bower et al. 2006; Somerville et al. 2008). The main goal of SAMs is to reproduce as more as possible the statistical properties of galaxies seen in the data. What is more important of SAM is not to make predictions of new observations, but to test our understanding of physical model of galaxy formation in a fast and easy way.
SAMs have achieved great progress in recent years. They can reproduce the observed local stellar mass function down to the low mass end (Guo et al. 2011, Kang et al. 2012), cold gas mass function (Fu et al. 2013), and some scaling relations like the Tully-Fisher relation (Guo et al. 2011, hereafter G11), Faber-Jackson relation (Tonini et al. 2016). However, most (if not all) models can not reproduce the color distribution of galaxies. The color of low-mass satellite galaxies are too red (e.g., Weinmann et al. 2006), the color of central galaxies are too blue (Kang et al. 2006). These problem are also persist in the model of Guo et al. (2013, hereafter G13) which have included more advanced treatments of gas cooling and star formation in satellite galaxies. The color discrepancy indicates that quenching of low mass galaxies is too strong, while quenching of massive galaxies is not enough. So the quenching mechanism might be different in low mass and high mass galaxies: the low-mass red galaxies in models are mainly satellites which are often related to environment quenching, like ram-pressure and tidal stripping. However, Luo et al. (2016) pointed it is not purely of environmental origin. The blue massive galaxies in models is related to insufficient feedback.
The recent version of the L-Galaxies model, Henriques et al. (2015), has achieved progress to solve the color distribution in the model. They use Markov Chain Monte Carlo (MCMC) method to search the parameter space to simultaneously fit the stellar mass function at different redshifts and the overall red fraction of galaxies. Although their success comes at no surprise, it indicates that our understanding of galaxy formation is on the right way. For detail of how they succeed in reproducing the two observations, we refer the readers to their paper. However, it is still not clear of the H15 model can also reproduce the color distribution of satellite and central galaxies respectively since the quenching mechanism might be different for satellite and central galaxies. In this paper we will compare the model predictions of G13 and H15 on the red fraction of satellite and central galaxies, which is the main goal of our paper. On the other hand, it is well known that star formation quenching is close related to galaxy morphology that most red/passive galaxies are bulge dominated (e.g., Kauffmann et al. 2004), we also use the data to check the morphology mix in the model.
This paper is organized as follows. In Section 2, we briefly summarize the L-Galaxies models and describe the main modifications in H15. In Section 3, we analyze the galaxy quenching in H15, comparing them to the G13 model and the SDSS data, such as: quenching fraction, morphology of central galaxies, conditional stellar mass functions and stellar mass-halo mass relation. In Section 4, we summarize our results and discuss the possible improvement.
2 The L-Galaxies semi-analytic models
In this section, we briefly introduce the L-Galaxies models and the simulation they used, then describe the main changes of physics recipes between H15 and G13.
2.1 The models and simulations
The L-Galaxies is one of the most successful semi-analytic galaxy formation model. It is continuously developed by Kauffmann et al.(1999); Springel et al.(2001); Croton et al.(2006); De Lucia & Blaizot (2007) in last two decades. Recently, the L-Galaxies model of G11 and G13 had been improved comprehensively which can well reproduce observed galaxy populations from dwarf spheroidals to cD galaxies. Fu et al. (2010 & 2013) have developed a model in which the cold gas is partitioned into atomic and molecular components. Yates et al. (2014) adopted a more realistic model for chemical evolution. After that, Henriques et al.(2015) published the latest trunk version of the L-Galaxies, which is claimed to match the observed evolution of stellar mass function, galaxy colors, star-formation rates, in the Planck cosmology. In this work we will use the data produced from the G13 and H15 models.
Both G13 and H15 models are implemented on two N-body simulations: Millennium (here after MS, Springel et al. 2005) and Millennium-II (here after MS-II, Boylan-Kolchin et al. 2009). Both simulations use the cosmological parameters from the first-year WMAP data and particles. The simulation box of MS is , and MS-II has box size of , so it is 125 times higher mass resolution than MS. Using the technique developed by Angulo & White (2010) and Angulo & Hilbert (2014), G13 rescaled the cosmological parameters from WMPA1 to WMAP7: and , while H15 rescaled to Planck cosmology: and .
H15 applied the MCMC procedures to find best parameter by fitting to a series of fiducial observational data: the evolution of stellar mass function and the passive galaxy fraction as a function of stellar mass from to . Both galaxy catalogues from H15 and G13 are publicly available on Millennium data base. 111http://gavo.mpa-garching.mpg.de/Millennium
2.2 The main modifications in H15 model
Compared to G13, H15 modified a few treatments of baryonic processes to best fit the observed evolution of star-formation rates, colours and stellar mass up to . For more details about the modifications, please refer the supplementary material in H15. Here we list the main modifications by H15 compared to G13 model:
(i) delay the reincorporation rate of ejected gas into the halo: changing the ejected gas reincorporation rate from to . This change leads to a slower gas reincorporation rate in low-mass haloes and a quicker reincorporation rate in massive haloes.
(ii) decrease the threshold density for star formation: changing the gas density threshold from to . In this way satellite galaxy with poor gas can still form stars.
(iii) ignoring the ram-pressure stripping in less massive haloes: setting a ram-pressure threshold . So the hot gas of satellites in low-mass haloes is not stripped and available for continuous cooling and star formation.
(iv) increasing the radio-mode AGN feedback: the new efficiency of hot gas accretion onto the central black hole, , is equivalent to the one in G13 divided by a factor of . The larger accretion efficiency in H15 leads to a quicker growth of black hole and a stronger AGN feedback (which is related to gas accretion rate). So the suppress of gas cooling in mediate and massive galaxies is stronger in H15 model.
3 Model predictions
In this section, we compare the model predictions of H15 and G13 to the data on the red fraction of central and satellite galaxies, the fraction of galaxies with different morphology, and the stellar mass to halo mass relation.
3.1 Quenched fraction of satellites and central galaxies
In Luo et al. (2016), they compared the quenched fraction with the SDSS DR7 data, based on the model of Fu et al. (2013). In agreement with previous results they also found that there are too many low-mass quenched satellites and too few quenched central galaxies. Since H15 has fitted the fraction of passive (quenched) galaxies as a function of stellar mass and redshift, now we check this fraction more carefully in this section.
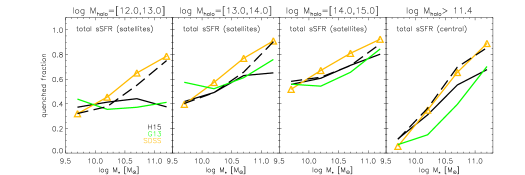
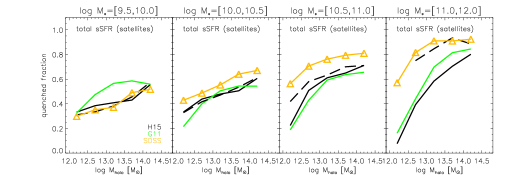
Following Luo et al. (2016), we define galaxies with as quenched galaxies and select galaxies with from H15. The data points are from Luo et al. (2016) using the MPA-JHU SDSS DR7 catalogue and Yang et al.(2007) group catalog with at and at . In Fig. 1 and 2, we plot the quenched fraction of galaxies at fixed halo mass and fixed stellar mass, but for central galaxies and satellites separately.
By looking at Fig. 1 and Fig. 2, we find that compared to G13 model, the H15 model is able to reproduce the red fraction of central galaxies (right panel in Fig.1) and that of low-mass satellite galaxies with (left panel in Fig.2). The improvement is slightly better from the MS-II simulation. Compared to the G13 model, H15 increases the quenched fraction of central galaxies significantly at , suggesting that increasing the AGN feedback does play a more role in quenching massive galaxies. While at , the quenching fractions of central galaxies from H15 and G13 models are similar, at which AGN feedback is not efficient.
Fig. 2 is more interesting. It shows that the H15 can reproduce the fraction of red satellites at the low-mass end (left panel), but at mediate stellar mass of (middle two panels) the red fraction is still lower than the data. This prediction is very similar to that from G13 model from MS. In G13 model, the over-prediction of blue satellites at this mass scale can be understood because the central galaxies is also bluer. However, the blue fraction of central in H15 model now agrees with the data. We will later see from Fig. 4 and Fig. 5 that the stellar mass of centrals at z=0 in H15 model is actually lower than the data at given halo mass, this is because they tune the model parameters to fit the stellar mass functions at high redshift and the overall red fraction by introducing strong AGN feedback in massive galaxies and a longer reincorporation time of gas in low mass galaxies. In order to fit the total SMF at z=0, H15 increase the star formation efficiency in satellites by lowering the star formation threshold and ignoring ram pressure stripping in halo mass less than . But by doing so, the mediate stellar-mass galaxies are now bluer.
So the right color of central galaxies and too blue color of mediate stellar-mass satellites () in H15 model means that star formation efficiency should be slightly lower for them. This could be achieved by using a threshold as function as galaxy mass, or include ram-pressure stripping of hot gas in the mediate stellar-mass satellites.
And at most massive stellar mass bins (right panel in Fig. 2), there is a significant discrepancy for the quenched fraction of satellites between MS and MS-II (solid and dashed lines). This resolution problem in SAMs might be due to the inconsistent description of physics for satellites whose subhaloes can not be resolved in simulation, or the different merger history since the merger trees of some massive haloes may be not well resolved at higher redshifts in the low resolution simulations. The resolution problem has been discussed in detail in Luo et al. (2016).
3.2 The morphology of the central galaxies
It is well known that star formation activity is close related to the galaxy morphology (e.g., Kauffmann et al. 2004), so the morphology is also a good indicator of a galaxy to be passive or star forming. As H15 model now fit the quenched fraction of the central galaxies, it would be interested to check if they are able to predict the morphology of galaxies. In the following we study the fraction of galaxies divided into ellipticals and spirals.
In the SAMs, every galaxy has a disk plus a bulge, we use to define the morphology of the galaxy. Normally,galaxies with are bulge dominated galaxy (i.e. elliptical galaxy), with are normal spirals, with are pure disks (see Sec.3.8 in G11). Similarly, in the SDSS there is a photometric parameter to determine the galaxy morphology. In SDSS, the surface luminosity distribution of each galaxy is the linear combination of the exponential and the de Vaucouleurs profiles, and is the coefficient of the de Vaucouleurs term. Therefore is most similar to the , which reflects the contribution of the bulge component to the whole galaxy. Bernardi et al. (2005) used to define the early-type (i.e. elliptical) galaxies. Shao et al. (2007) used to define the spiral galaxies. In this work, we use as the criterion of early-type galaxies for SAMs, while use at r-band as the criterion of early-type galaxies for our SDSS sample (the same sample as Sec.3.1). Correspondingly, the galaxies with or are selected as late-type galaxies.
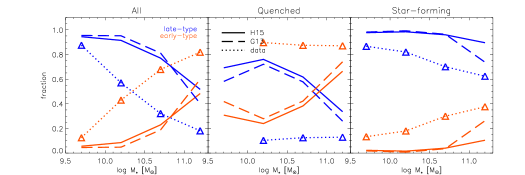
In Fig. 3, we plot the fraction of central galaxies’ morphology as a function of stellar mass. Red curves are for early-type (elliptical) galaxies, blue curves are for late-type (spirals) galaxies. Solid and dashed curves are results for H15 and G13, triangle dotted curves are results from our SDSS sample. The left panel is the results for all the galaxies, the middle and right panels are for quenched and star-forming galaxies.
From the left panel, we find H15 and G13 have almost same morphology fractions and trend for the whole sample: early-type/late-type galaxies fraction increases/decreases with stellar mass. But that is different from the SDSS data. There are more early-type central galaxies and less late-type central galaxies in the data than H15 and G13 models at . Furthermore, in the data early-type is the majority in central galaxies at , while for H15 and G13 model late-types is the majority through all the stellar mass. This indicates that galaxy morphology in the tao models is quite different with the SDSS data: there are more late-type central galaxies in models than in the SDSS.
We further divide the sample into quenched and star-forming galaxies to examine the morphology fraction. For quenched central galaxies (middle panel), the early-type fraction is almost at in SDSS, yet it is totally different with H15 and G13 models: early-type dominated only at . Even the fraction trends are different between SDSS and models: the fraction in SDSS does not change with stellar mass. Comparing the H15 with G13, we find their results almost similar, and there are slightly more late-type and less early-type central galaxies in H15 than that in G13. This implies there is slightly more late-type galaxies quenched in H15 model. For star-forming central galaxies, the fraction trends are almost similar, whereas in the models there are still more (at least ) late-type central galaxies than in the SDSS.
We can then conclude that the H15 model has correct fraction of quenched central galaxies, but the quenching mechanism in H15 may be not correct. It seems that H15 model quenches too many late-type central galaxies in stellar mass range at . In the H15 model the quenching is mainly by increasing the efficiency of AGN feedback, not related with the increasing formation of a bulge. We think that a more efficient quenching should be related to the mass growth in the bulge and will discuss this in the last session.
3.3 The conditional stellar mass functions
The conditional stellar mass function (CSMF, firstly proposed by Yang et al. 2003) describes the average number of galaxies as a function of stellar mass in dark matter haloes of given mass. The CSMF which closely relates to correlation functions, provides additional constraints on galaxy formation and evolution, as in principle the formation of dark matter haloes depend on their mass, so their galaxy population should be different. Kang et al. (2012) have shown that the CSMFs in G13 model is inconsistent with the data by producing more stellar mass in satellite galaxies. Since H15 model provide better fits to the observed SMFs at different redshifts and the correct fraction of quenched central galaxies, it is deserved to check their model predictions on the CSMFs.
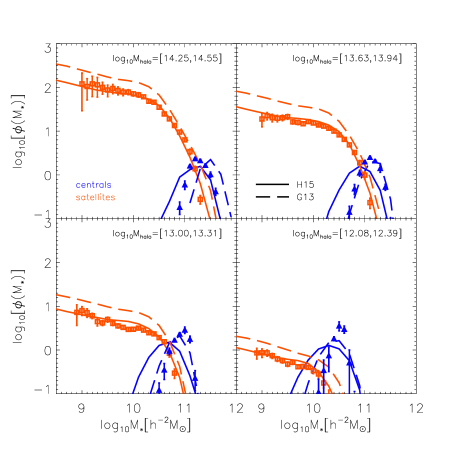
In Fig. 4, we show the CSMFs in different halo mass bins, and separate the contributions by central (blue curves) and satellite (red curves) galaxies. The solid and dashed lines are for H15 and G13 models, and the data points are from the Yang et al. (2012) which is measured from their constructed group catalog using the SDSS DR7.
We find that, the CSMFs of satellite galaxies in the H15 model are in good agreement with the SDSS data through the whole halo mass, and they are lower than the results of G13 about at least 0.2 dex at low stellar mass ends. But for central galaxies, except for the highest halo mass bins , G13 model is more consistent with the SDSS data than the H15 model. The stellar mass of central in H15 model is systematically lower than the data by 0.2-0.3 dex. This is related to the high AGN feedback in H15 model, which is enhanced by 1 dex than G13 model at , see Fig. S4 in the supplementary material of H15. This fast quenching leads to a lower stellar mass in H15 model.
However, the fact that the quenched fraction of central galaxies in H15 is consistent with SDSS data, suggests that increasing quenching of central galaxies in the model is necessary. This indicates that we need to quench more central galaxies to match the observed red fraction, but only after the central galaxy has the right amount of stellar mass. It is still not clear how to achieve the two facts at the same time, we will touch this in the discussion part.
3.4 The stellar mass-halo mass relation
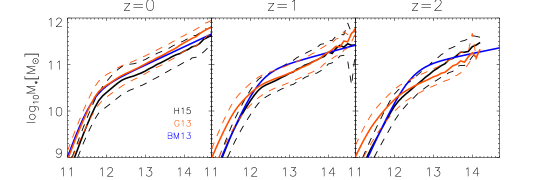
In previous section we have found at given halo mass the central galaxies in H15 model are have lower stellar mass than the data. In this section we further comparing the models prediction of H15, G13 to the data by showing the stellar mass-halo mass (SMHM) relation. The SMHM relation is a very basic and important relation for constraining galaxy formation physics, as shown by many others (e.g., Guo et al. 2010; Kang et al. 2012) that once this relation is well determined, it would be easily to fit the stellar mass function and galaxy clustering.
We plot the SMHM relations for central galaxies at different redshift in Fig. 5, black lines are from H15, red lines are from G13, blue lines are from the abundance matching results (Moster et al. 2013). It is found that at (left panel), at fixed halo mass stellar mass of H15 is lower than the abundance matching results and H13. At high redshifts (middle and right panels) For massive haloes, the stellar mass from H15 and G13 models are similar, except at the H15 model predicts a higher stellar mass. For low-mass haloes, the stellar mass from H15 is also lower than G13 model. This is consistent with what H15 did in their model. H15 used MCMC method to find the best parameters to fit the SMFs at high-z where they predicted slightly more massive galaxies at (see their Fig.2) so their stellar mass in massive haloes at is higher. But for low-mass haloes, they adopted a longer gas reincorporation time to best fit the faint end of SMFs, so their stellar mass is lower than G13 model.
In the model of H15, the AGN feedback at is stronger than that of G13, so they are able to produce more red central galaxies, as stated before, to fit the red fraction in the data. This is why their stellar mass in massive haloes is lower than both G13 model and the abundance matching of Moster et al. (2013).
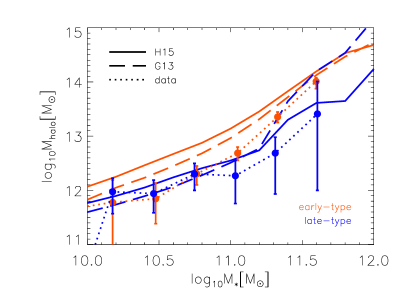
At the SMHM relation of Moster et al. (2013) is obtained from abundance matching, it is not the observed halo mass, so in Fig. 6 we plot SMHM relation using the observed data by Mandelbaum et al. (2006) where the halo mass is measured from weak lensing results from SDSS, which is more reliable. We separately the central galaxies sample into early-type and late-type, and show the results at . Here, early-type is defined as for the models.
It is easy to see from Fig.6 that at given stellar mass, the early-type galaxies from both G13 and H15 models are higher than the data. We note that there might be some systematic difference in the stellar mass obtained in the models and observations. So we do not focus on the absolute halo mass or stellar mass from this relation. What is more interesting is difference in the SMHM relations for the early-type and late-type galaxies. Fig.6 shows that in the data (points with error bar) the halo mass of early-type and late-type galaxies are very similar for . For more massive galaxies, at given stellar mass the early-type galaxies have higher halo mass. But note that the error bar of late-type galaxies is very large at the high mass end due to their lower number density. However, it is seen that in both the G13 and H15 models, the halo mass of early-type galaxies is higher than late-type galaxies at given stellar mass, inconsistent with the data at . The discrepancy is slightly larger in the H15 model. This indicates that the AGN feedback is either over-estimated in bulge dominated galaxies or under-estimated in disk dominated galaxies. As both G13 and H15 model have too many disk dominated galaxies, lowering their AGN feedback will lead to more stellar mass growth and will ruin the agreement with the observed SMFs. We thus conclude that it is more likely the AGN feedback in the both models is too strong, and being more stronger in the H15 model.
4 Conclusions and Discussion
In this paper, we compare the predictions from the latest two versions of the L-Galaxies model, H15 and G13 to the SDSS data. The H15 model has introduced a few modifications to the G13 model and is tuned to better match the evolution of stellar mass function and the fraction of red galaxies as a function of stellar mass. By comparing the model predictions to the data in more detail, we have obtained the following results:
(I) We examine the quenched fraction of central galaxies and satellites separately. It is found that, compared to the over-prediction of blue central galaxies in G13, the H15 model can reproduce the red fraction of central galaxies. The over-prediction of low-mass red satellites are also solved in H15 model to match the data. But the quenched fraction of satellite galaxies at in both G13 and H15 models is still lower than the SDSS data.
(II) We check the morphology of the central galaxies. We find there are too many late-type galaxies and too few early-type galaxies in both G13 and H15 models compared to the SDSS data. In addition, too many late-type galaxies in H15 at are quenched.
(III) We examine the stellar mass function of central and satellite galaxies in different halo mass bins, and find that H15 produces better match to the observed stellar mass function of satellites than G13 model, but the match to the stellar mass of central is worse than G13. The stellar mass of central galaxies is lower by about 0.2 dex than the data suggests.
(IV) We compare the stellar mass-halo mass relation to the data, and find that G13 fits better the observed stellar mass-halo mass relation, and at given halo mass, the stellar mass of central galaxies in H15 is lower than the data, especially for the early-type galaxies.
H15 have clearly shown that a long reincorporation time of supernova ejected gas is helpful to suppress the star formation rate in low-mass galaxies, thus providing a better match to the stellar mass function at high redshifts. To solve the over-red of these low-mass satellite galaxies () they use a lower threshold gas density for star formation and ignore the ram-pressure stripping in low-mass haloes. However, we found that such a extension of star formation in satellites produce slightly more blue satellites at . This could be solved by using a density threshold as function as galaxy stellar mass, not a constant in current H15 model.
By introducing a AGN feedback parameter which higher than the G13 one at low redshift, H15 model can reproduce the red fraction of central galaxies. However, the stellar mass of those quenched central galaxies is now slightly lower (by about 0.2dex) than the data. Our results also show that in the G13 and H15 models there are too many disk dominated galaxies, and especially too many red disk galaxies. To solve these two problems simultaneously, we need some mechanisms to increase the growth of the bulge component in central galaxies, and the feedback (whatever AGN or others) from the bulge formation is used to quench the galaxy. In this way, the stellar mass of central can be increased to match the data, and we can have more bulge dominated quenched galaxies.
In L-Galaxies, the bulge formation are through three channels: major, minor mergers and disk instability. For major mergers, two galaxies merger with mass ratio () larger than 0.3, then all the star in both two galaxies and the newly formed stars during the merger are assumed to form a new bulge. For minor mergers, only the stars in satellite are added into the bulge of central galaxy. Normally, during major merger the strong starburst will consume almost all the cold gas and suppress the further star formation. In L-Galaxies major mergers are better modelled due to their rapid dynamical friction time, so we do not think there is no more space to increase the major merger rate. On the contrary, there is some freedom to increase the minor merger rate, as shown by van Daalen et al. (2016) that a shorter merger time is really needed to match the galaxy clustering using the H15 model.
Disk instability is another important channel to form a bulge. Due to this dynamic instability, the unstable disk will transfer some stellar mass transferred into bulge to make the disk stable again. Also some new stars can form during the instability. G11 has pointed disk instability is a major way to form bulge in the intermediate mass galaxies like the Milky Way. This is also the mass range where the bulge grow insufficiently in H15. So increasing the disk instability might be the possible solution.
Recently, Tonini et al. (2016) present a comprehensive theoretical prescription of growth of disks and bulges in SAM. They distinguish the bulges into two populations: merger-driven bulges and instability-driven bulges. Their model can reproduce some observations, such as the mass-size relation, Faber-Jackson relation. They found that the merger-driven ellipticals are dominated in both low-mass and high-mass ends of stellar mass, while instability-driven bulges dominate the intermediate mass range. These also indicate that increasing the disk instability is the suitable solution to improve the quenching and morphology of central galaxies in SAMs. We expect future solutions will reconcile the conflicts between stellar mass functions, colour and morphology distributions in SAMs.
5 Acknowledgement
We thank Qi Guo for helpful discussion and Lei Wang for providing the SDSS DR7 catalog. The Millennium Simulation data bases used in this paper and the web application providing online access to them were constructed as part of the activities of the German Astrophysical Virtual Observatory (GAVO). This work is supported by the National basic research programme of China (2015CB857003, 2013CB834900), NSF of Jiangsu Province (No. BK20140050), the NSFC (No. 11333008) and the Strategic Priority Research Program ’The Emergence of Cosmological Structure’ of the CAS (No. XDB09010403).
References
- [Angulo & White(2010)] Angulo, R. E., & White, S. D. M. 2010, MNRAS, 405, 143
- [Angulo & Hilbert(2015)] Angulo, R. E., & Hilbert, S. 2015, MNRAS, 448, 364
- [Bernardi et al.(2005)] Bernardi, M., Sheth, R. K., Nichol, R. C., Schneider, D. P., & Brinkmann, J. 2005, AJ, 129, 61
- [Bower et al.(2006)] Bower, R. G., Benson, A. J., Malbon, R., et al. 2006, MNRAS, 370, 645
- [Boylan-Kolchin et al.(2009)] Boylan-Kolchin, M., Springel, V., White, S. D. M., Jenkins, A., & Lemson, G. 2009, MNRAS, 398, 1150
- [De Lucia & Blaizot(2007)] De Lucia, G., & Blaizot, J. 2007, MNRAS, 375, 2
- [Frenk & White(2012)] Frenk, C. S., & White, S. D. M. 2012, Annalen der Physik, 524, 507
- [Fu et al.(2010)] Fu, J., Guo, Q., Kauffmann, G., & Krumholz, M. R. 2010, MNRAS, 409, 515
- [Fu et al.(2013)] Fu, J., Kauffmann, G., Huang, M.-l., et al. 2013, MNRAS, 434, 1531
- [Guo et al.(2013)] Guo, Q., White, S., Angulo, R. E., et al. 2013, MNRAS, 428, 1351
- [Guo et al.(2011)] Guo, Q., White, S., Boylan-Kolchin, M., et al. 2011, MNRAS, 413, 101
- [Guo et al.(2010)] Guo, Q., White, S., Li, C., & Boylan-Kolchin, M. 2010, MNRAS, 404, 1111
- [Henriques et al.(2015)] Henriques, B. M. B., White, S. D. M., Thomas, P. A., et al. 2015, MNRAS, 451, 2663
- [Kang et al.(2005)] Kang, X., Jing, Y. P., Mo, H. J., Börner, G. 2005, ApJ, 631, 21
- [Kang et al.(2006)] Kang, X., Jing, Y. P., & Silk, J. 2006, ApJ, 648, 820
- [Kang et al.(2012)] Kang, X., Li, M., Lin, W. P., & Elahi, P. J. 2012, MNRAS, 422, 804
- [Kauffmann et al.(1999)] Kauffmann, G., Colberg, J. M., Diaferio, A., & White, S. D. M. 1999, MNRAS, 303, 188
- [Kauffmann et al.(2004)] Kauffmann, G., White, S. D. M., Heckman, T. M., et al. 2004, MNRAS, 353, 713
- [Luo et al.(2016)] Luo, Y., Kang, X., Kauffmann, G., & Fu, J. 2016, MNRAS, 458, 366
- [Mandelbaum et al.(2006)] Mandelbaum, R., Seljak, U., Kauffmann, G., Hirata, C. M., & Brinkmann, J. 2006, MNRAS, 368, 715
- [Moster et al.(2013)] Moster, B. P., Naab, T., & White, S. D. M. 2013, MNRAS, 428, 3121
- [Schaye et al.(2015)] Schaye, J., Crain, R. A., Bower, R. G., et al. 2015, MNRAS, 446, 521
- [Shao et al.(2007)] Shao, Z., Xiao, Q., Shen, S., et al. 2007, ApJ, 659, 1159
- [Somerville et al.(2008)] Somerville, R. S., Hopkins, P. F., Cox, T. J., Robertson, B. E., & Hernquist, L. 2008, MNRAS, 391, 481
- [Somerville & Primack(1999)] Somerville, R. S., & Primack, J. R. 1999, MNRAS, 310, 1087
- [Springel et al.(2005)] Springel, V., White, S. D. M., Jenkins, A., et al. 2005, Nature, 435, 629
- [Springel et al.(2001)] Springel, V., White, S. D. M., Tormen, G., & Kauffmann, G. 2001, MNRAS, 328, 726
- [Tonini et al.(2016)] Tonini, C., Mutch, S. J., Croton, D. J., & Wyithe, J. S. B. 2016, MNRAS, 459, 4109
- [van Daalen et al.(2016)] van Daalen, M. P., Henriques, B. M. B., Angulo, R. E., & White, S. D. M. 2016, MNRAS, 458, 934
- [Vogelsberger et al.(2014)] Vogelsberger, M., Genel, S., Springel, V., et al. 2014, MNRAS, 444, 1518
- [Weinmann et al.(2006)] Weinmann, S. M., van den Bosch, F. C., Yang, X., et al. 2006, MNRAS, 372, 1161
- [White & Frenk(1991)] White, S. D. M., & Frenk, C. S. 1991, ApJ, 379, 52
- [Yang et al.(2003)] Yang, X., Mo, H. J., & van den Bosch, F. C. 2003, MNRAS, 339, 1057
- [Yang et al.(2012)] Yang, X., Mo, H. J., van den Bosch, F. C., Zhang, Y., & Han, J. 2012, ApJ, 752, 41
- [Yates & Kauffmann(2014)] Yates, R. M., & Kauffmann, G. 2014, MNRAS, 439, 3817