BP Piscium: its flaring disk imaged with SPHERE/ZIMPOL††thanks: The observations were taken during SPHERE science verification by the European Southern Observatory, Chile (ESO program ID: 60.A-9375(A)
Abstract
Whether BP Piscium (BP Psc) is either a pre-main sequence T Tauri star at pc, or a post-main sequence G giant at pc is still not clear. As a first-ascent giant, it is the first to be observed with a molecular and dust disk. Alternatively, BP Psc would be among the nearest T Tauri stars with a protoplanetary disk (PPD). We investigate whether the disk geometry resembles typical PPDs, by comparing polarimetric images with radiative transfer models. Our VLT/SPHERE/ZIMPOL observations allow us to perform Polarimetric Differential Imaging; Reference Star Differential Imaging; and Richardson-Lucy deconvolution. We present the first visible light polarization and intensity images of the disk of BP Psc. Our deconvolution confirms the disk shape as detected before, mainly showing the southern side of the disk. In polarized intensity the disk is imaged at larger detail and also shows the northern side, giving it the typical shape of high inclination flared disks. We explain the observed disk features by retrieving the large-scale geometry with MCMax radiative transfer modeling, which yields a strongly flared model, atypical for disks of T Tauri stars.
keywords:
circumstellar matter – protoplanetary discs – stars: evolution – techniques: polarimetric – polarization – techniques: high angular resolution1 Introduction
Circumstellar disks appear at different stages of stellar evolution. During early stages of star formation, collapsing molecular clouds result in protoplanetary disks (PPDs) and later debris disks (Williams & Cieza, 2011). Although mass ejections of post-main sequence stars are often spherical, they are known to create disk-like surroundings for (post)AGB stars (Skinner et al., 1998; Jeffers et al., 2014; Kervella et al., 2015).
Zuckerman et al. (2008, Z08) detect a circumstellar gas disk around BP Piscium (hereafter BP Psc) in 12CO (3-2) with SMA and in 12CO (2-1) with OVRO interferometric measurements, and by deconvolving Keck and band images they detected a dust disk at high inclination (, with for a face-on disk) and position angle PA . Since no reliable parallax has been determined, the distance () to the star is highly uncertain. For two possible evolutionary scenarios with an effective temperature K, the luminosities are matched to observations by varying . Z08 propose two possible evolutionary scenarios for BP Psc: 1) at a distance pc, it is one of the nearest pre-main sequence Classical T Tauri Stars (CTTSs) with an age Myr; or 2) at pc, BP Psc is a post-main sequence star of a few Gyr at its first-ascent, or hydrogen shell burning phase. A more luminous (therefore pc) (post-) Asymptotic Giant Branch (AGB, helium shell burning) star is ruled out due to its large Tycho 2 proper motion ( mas yr-1, mas yr-1, Høg et al., 2000). For a star on the first-ascent giant branch, the associated molecular disk, accretion and Herbig Haro objects would be the first ever to be detected. The growing primary star would have recently enveloped a previous companion, hence creating the disk. Z08 favor the G giant scenario for BP Psc , mainly because of low lithium abundance, low surface gravity, and lack of an associated star forming region. The stellar photosphere, obscured by the disk in visible and near-infrared wavelengths, is directly detected in X-rays with CHANDRA (Kastner et al., 2010). The authors argue that the ratio of X-ray over bolometric luminosity is too low for typical CTTSs but does agree with other rapidly rotating G giant stars. Furthermore, the G giant scenario is supported by the disk modeling of Melis et al. (2010, M10): the disk model for the Herbig Be star HD 100546 matches the Spectral Energy Distribution (SED) of BP Psc, yielding an inner disk morphology which suggests that BP Psc is too luminous to be CTTS and leads them to suggest the presence of a massive planet carving a gap in the disk. However, early studies of PPDs (e.g. Espaillat et al., 2011; Andrews et al., 2011; Dong et al., 2012) have shown disk models based on the SED to be highly degenerate for many disk parameters, which can be solved by including high spatial resolution images of the disks in the analysis.
We compare visible light polarimetric images of BP Psc’s disk with radiative transfer modeling to constrain the 3D geometry of the system. The recent increase of detected and modeled PPDs will allow a qualitative assessment of the CTTS scenario.
2 Observations and data reduction
2.1 Observations with VLT/SPHERE/ZIMPOL
We observed BP Psc and reference star TYC 5259-446-1 (T52) on 6 December 2014, during science verification of the Spectro-Polarimetric High-contrast Exoplanet REsearch (SPHERE) instrument (Beuzit et al., 2008), the new high-contrast imager of the Very Large Telescope (VLT). We used the Zurich IMaging Polarimeter (ZIMPOL, Thalmann et al. (2008) in field-tracking, polarimetric (P2) mode. We used the ( nm; nm) and ( nm; nm) filters simultaneously. The filter choice implied the use of the ‘grey’ beam splitter, which sends of all visible light to the SPHERE eXtreme Adaptive Optics (SAXO, Fusco et al., 2014) wave front sensor (WFS) and the remaining to ZIMPOL. The stellar magnitudes and air mass during observation of BP Psc (V = 11.9 mag, ) and T52 (V = 11.4 mag, ) posed an additional challenge for the WFS. As a result, we reached a Strehl ratio in the -band of and a Full Width at Half Maximum (FWHM mas. In the -band, we reached , FWHM mas.
We briefly summarize how ZIMPOL works, but refer to Schmid et al. (2012) for details on the instrument. A full polarimetric cycle consists of 4 exposures of s for each of the 4 half wave plate (HWP) angles: ; ; ; . We recorded 1 polarimetric cycle ( min on target) for T52 and 3 polarimetric cycles ( min on target) for BP Psc. During each individual exposure, the Ferro-electric Liquid Crystal (FLC) reverses the polarization state, by switching its fast axis from the initial (A) state at to (B state), at a frequency of Hz (= per integration). In the first frame (the 0-phase), ‘charge shuffling’ ensures that the light observed during the FLC’s A state is stored in the odd rows of the detector while the light observed in the B state (where the measured polarization has changed sign) is stored in the even detector rows. For the next frame (the -phase), the storage order is reversed: A is saved in the even rows, B in the odd rows. Therefore the 4 exposures per consist of ‘0-frames’ and ‘-frames’.
2.2 Polarimetric Differential Imaging (PDI)
We applied different filters to the two beams of the beam splitter. Therefore, we perform the reduction for each beam separately, with our custom-made reduction pipeline. After dark subtraction and flat field correction, odd and even pixel rows are extracted into FLC A and B frames, which we subtract for the 0-frames () and the -frames (). Next, we subtract the difference images from the 0 ones, and stack the 2 resulting images for each subsequent . For we obtain the intensity () and linear polarization () by combining 0 and images:
| (1) | |||||
| (2) |
Similarly, for we obtain and ; gives and ; and yields and . To correct for charge trapping (a problem inherent to charge shuffling, described by Povel et al. (1994) and Schmid et al. (2012)), the afore mentioned procedures are done before any centering routine is applied.
The initial separation of the odd and even pixel rows leads to different plate scales for the vertical and horizontal axes. We obtain ‘square’ mas pixels by binning pixels. We center the images by cross correlating the images with a centered Moffat function and apply the same shift to the corresponding or image. The final Stokes components are:
| (3) | |||||
| (4) | |||||
| (5) | |||||
| (6) |
from which we can compute the Polarized Intensity , and the polarization angle .
2.2.1 Correcting Instrumental Polarization
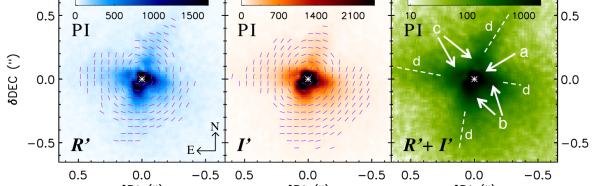
Computing the difference images (same for ) with Equations 4 & 6 corrects for Instrumental Polarization (IP) created downstream from the HWP (Witzel et al., 2011; de Boer et al., 2014; Canovas et al., 2011, C11). However, this does not remove IP induced by the third mirror (M3) of the telescope and the first mirror (M4) of SPHERE, both of which are upstream from the HWP. We cannot distinguish between this instrumental and real (inter)stellar and/or disk polarization at the location of the star. C11 describe the correction for IP in imaging polarimetry, which assumes that the central star is unpolarized. Therefore we consider any signal measured over a small aperture at the center to be IP, which is the best we can do. Figure 1 shows the IP corrected images for -band (left), -band (center) and combined (right). The purple lines in the and -band images show the direction of .
2.3 Reference Star Differential Imaging (RDI)
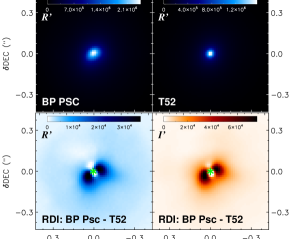
When we compare the Stokes I (or total intensity ) images of BP Psc and the point source T52 in the two top panels of Figure 2, we already see that BP Psc is not just a point source: the disk contributes a significant part of the signal. T52 was observed at lower air mass than BP Psc (see Section 2.1), which results in a smaller FWHM and higher Strehl ratio for T52. For Reference star Differential Imaging (RDI Smith & Terrile, 1984), where we subtract a reference star from our target, this difference in FWHMs becomes a problem, which could lead to over-subtraction (i.e. removal of disk light) close to the star and under-subtraction (insufficient removal of stellar speckle halo) at larger separations.
To adjust the Point Spread Function (PSF) of T52 to the lower Strehl ratio of the BP Psc observations, we convolve T52 with a Gaussian of FWHM mas to match the width of the image of BP Psc at PA , which is roughly perpendicular to the disk PA of Z08. In this direction, we expect the influence of the disk on the shape of the PSF to be negligible. Finally, we scale the peak flux of the reference PSF to match the peak value for BP Psc and subtract the former from the latter. The bottom panels of Figure 2 show the RDI images for (left) and (right).
2.4 Deconvolution of the total intensity image
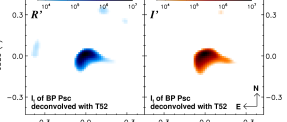
The only images of the resolved disk known to date are the deconvolved images of Z08, which display a different structure than our images in Figure 1. To confirm the detection of Z08, we apply the same method and perform the Richardson-Lucy (RL) deconvolution (using Equations 19 and 20 in Lucy, 1974) of the image of BP Psc, for which we show in Section 2.3 that the disk signal forms a substantial part. The observed is used as a starting guess for the deconvolution. As in Section 2.3, the PSF is obtained by convolving the image of T52 with a Gaussian (FWHM mas). RL recovers structures on scales larger than the FWHM within only a few () iterations. Because our FWHM is comparable to the angular size of the disk we require more iterations to converge. To monitor the convergence of the deconvolution we convolve the deconvolved images and subtract this from the original images. After 2000 iterations, the residuals show little change. Figure 3 shows the final RL deconvolved images for both filters.
3 Results
We detect the disk of BP Psc for the first time in in both and -bands (Figure 1). Additionally, we retrieve the intensity image of the disk with RDI in Figure 2, and confirm the detection of Z08 with the very similar results of our deconvolution (Figure 3). The overall appearance of the images of Figure 1 is the same for both filters, and resembles a (nearly) edge-on flaring disk, similar to e.g. HH 30 (Burrows et al., 1996, CTTS with ). To give a flux calibrated surface brightness of the disk requires a detailed calibration of (e.g. the polarimetric efficiency of) ZIMPOL, which is beyond the scope of this paper. We confine this study to a qualitative description and analysis of the observations. The main features are highlighted in the right-hand panel of Figure 1. A bright blob appears in the center of the images (feature a) covering the position of the star (highlighted with a white asterisk). The two bright regions (at position angles (PA and ) within 0.15” from the star (feature b) show the ‘bowl’ of a flared disk south of the mid-plane. This southern bowl dominates both the RDI images (Figure 2) and the deconvolutions (Figure 3) as well. For the northern counterpart of this bowl, only two elongated regions are detected in the images (features c in Figure 1). However, two faint extended ‘fingers’ (feature d in Figure 1), starting at the features c, going outward to seem to trace the extended surface of the flared disk, north of the mid-plane. Less clearly, similar fingers can be seen extending outward to the south and west from the b regions.
Compared to high Strehl ratios reached for much brighter, mag stars (, Fusco et al., 2014), where high angular resolutions are reached (e.g. FWHM mas for Kervella et al., 2015), the low Strehl ratios reached for BP Psc ( mag, ) naturally result in lower resolution: FWHM mas. Both RDI and RL deconvolution are very sensitive to errors in the PSF. Due to the varying Strehl ratios, T52 can only be considered as an approximate PSF (e.g. we have to broaden T52 to fit the FWHM of BP Psc). Therefore, we do not put too much emphasis on either the deconvolutions or the RDI images, we only emphasize that our deconvolved images in Figure 3 look very similar to the ones obtained by Z08 in and band. We base the main focus of our analysis on the images in Figure 1.
4 Discussion
4.1 Modeling the disk
To find the evolutionary stage of BP Psc, ideally we would compare disk models to those typical for disks around CTTSs and those around G-giants. To the best of our knowledge no radiative transfer models exist for disks around other first-ascent giants. Models exist for more evolved systems (e.g. Jeffers et al., 2014; Kervella et al., 2015) However, a disk around a first-ascent giant must have formed very recently, which makes our knowledge on the large scale geometry of such systems very uncertain. Therefore, we do not consider a comparison of this system to AGB disk models as a viable option. Instead, we choose to treat BP Psc as if it were a CTTS, at pc, represented by a Kurucz stellar model atmosphere (Kurucz, 1979) with surface temperature K, luminosity , and mass , and see if our best model resembles those created for disks around other CTTSs. The disk radii and scale height () do essentially scale with distance, while leaving the overall shape unchanged. We do not aim to describe the dust properties of the disk, rather constrain the disk geometry by creating a model that fits the SED, while producing images that capture the major features of our observations.
We use the Monte Carlo radiative transfer code MCMax (Min et al., 2009)111 see the MCMax website: http://www.hetisikke.nl/mcmax/, or the manual: https://sites.google.com/site/manualmcmax/home. to fit the SED of BP Psc. The disk models are made up of silicates and contain carbon with a carbon mass fraction , which is comparable to the fraction in the solar system. Grain sizes lie between m and 3 mm and decrease with a power law. Similar to the results of M10, our models contained two disk components: An inner disk at au au and an outer disk at au. The scale height () of both ( inner; outer) disk components increases with a power law (Equation 18 of M09). The inner disk maintains this power law component () for all radii. The increase of the outer disk goes with the power of () up to a radius from where declines exponentially, causing a rapid decrease in the scattering of starlight. The scale height decreases with particle size, due to settling of large dust grains towards the disk mid-plane. Dust settling is higher (or is smaller) when turbulent mixing decreases. Turbulent mixing is described by the viscosity parameter (Dubrulle et al., 1995; Woitke et al., 2016).
We allowed the inclination () to vary such that the line of sight optical depth at nm , and found an inverse relationship between and . Even though we created fits to the SED with similar quality with a variety of parameters, the ZIMPOL observations placed lower limits on , and therefore on , which in turn required an . A degeneracy exists between the disk dust mass () and for the fit of the Near and Mid IR range, where lower require higher values of (i.e. settling becomes less efficient). The mass of the outer dust disk has a lower limit beneath which is no longer affected by and only near edge-on configurations could still maintain the requirement. This lower limit of effectively gives us an upper limit for the viscosity parameter . This means that the dust settling in the disk of BP Psc is much stronger than the example of strong settling given by Woitke et al. (2016), who use .
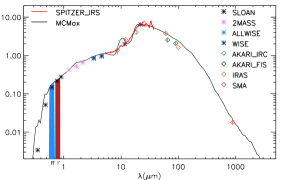
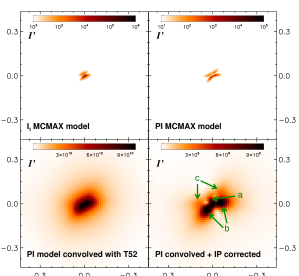
The final model (Figure 4) has (in agreement with of Z08); au; ; and and for the inner and outer disk respectively. The model f its the SED very well, except for a strong silicate feature at m. We have found that increasing the carbon/silicate fraction can remove this feature, but using this chemical composition we did not achieve a good fit to the SED overall so far. Since we consider the chemical composition of the disk to be outside of the scope of this paper, we did not pursue the removal of the silicate feature any further. The Stokes images of the disk model in the direction of the line of sight are convolved with the image of the reference star, after which we applied the same procedure of IP correction as we did for the observations. The model will not truly be plagued by such an artifact, but as we explain in Section 2.2.1, we cannot distinguish between true polarization at the location of the star and IP in our observations. Applying the IP correction therefore ensures the best comparison between model and observation (as demonstrated by Min et al., 2012).
Figure 4 shows for -band the unconvolved model and images (top left and right respectively), and the image after convolution with the PSF (bottom left), and IP correction (bottom right). The convolved + IP corrected image shows a striking similarity with the reduced images of Figure 1. The features a, b and c, described in Section 3, are visible in the convolved + IP corrected model image. Comparing the top-right and bottom-right images of Figure 4 teaches us that features b and c represent the upper and lower arcs of a nearly edge on disk, while feature a is an artifact, caused by the convolution + IP correction. We did not achieve to create a model with features, similar to d. However, from the morphology of the unresolved disk model, we can deduce that they are likely to be extensions of the northern arc of the disk. This explanation is supported by the fact that the c features lie at the base of the d features. In an alternative explanation the second disk component is surrounded by a third and outermost disk component.
The angle between the northern and southern arc () seems to be smaller for the model than for the ZIMPOL observations. Therefore, we do not claim to have found a unique solution for either or of the disk. We rather created a model with a morphology comparable enough to explain the observations. Our model is strongly flared for its small grains, but extremely flat for the larger grains. ALMA long baseline observations should be able to confirm if our modeling results are correct. Since small dust grains are coupled to the gas, we predict that the molecular disk shows a much stronger flaring than the large grain dust disk.
The parameters (especially flaring and settling) used for the presented model are far from the classical Keplerian disk in hydrostatical equilibrium, which means that the disk of BP Psc is not a stereo-typical protoplanetary disk for a CTTS. This could be explained by a very young star, with infall from its native star-forming nebula. However, since no associated star-forming region has been found, we do not consider this to be a plausible scenario. An alternative explanation for the atypical behavior of the disk is that it is not a protoplanetary disk surrounding a pre-main sequence star, but rather a disk around a first-ascent G-giant. Unfortunately we lack G-giant disk models which allow for a proper comparison. An open question remaining for the G-Giant scenario is whether the formation of the disk in a way as proposed by Z08 and M10 (i.e. enveloping a massive companion) is compatible with the strong flaring of small grains and settling of the larger grains.
4.2 Disk morphology
Even though both sides of a strongly inclined (but ) disk will be dominated by forward scattering, we expect the forward facing side (or top) to be brighter than the backward facing side (or bottom). The asymmetry originates from the smaller optical depth of the forward facing side of the disk (the starlight reaches us more efficiently). From the MCMax model images, we determine that the top side of the disk is pointing south and the bottom side north. An interesting test to confirm that the southern side is facing us will be to check whether the associated southern HH-object (Z08) is blue shifted, and the northern counterpart red shifted.
We determine the PA by assuming (as we see for the disk model images in Figure 4) that the largest symmetry will be acros the axis PA , while the symmetry acros the PA will always be broken for a disk with . We mirror the disk image along the PA and subtract the mirror image from the original disk image. For regions where the SNR is high in the original image, we take the absolute value of the residual (image - mirror). We repeat this method for varying PA. The angle which provides the smallest residual signal yields PA , in good agreement with Z08 (PA ).
5 Conclusion
Our ZIMPOL observations of BP Psc confirm the presence of a circumstellar disk. Despite a modest AO correction, we resolved the disk for the first time in the visible ( and band), and present the first polarimetric images of this object. Our deconvolved image in Figure 3 confirms the disk images of Z08, and retrieve the PA with a higher accuracy than was known until now.
The MCMax modeling yields images comparable to the observations. They require a model which is strongly flared for small grains, yet strong settling occurs for large grains. Both flaring and settling values are atypical for a proto-planetary disk of a T-Tauri type star. Without strongly discarding the CTTS scenario, our study therefore is more inclined towards a G-giant evolutionary stage for this system. The comparison between model and observations allows us to determine that the forward facing side is pointing south (), while the backward facing side points north (). The specific disk features detected in Figure 1 can be explained by the model as either resolved components of the forward facing side of the disk (‘b’ features); the backward facing side (‘c’ & ’d’ features) or as a residual of the convolution with the telescope PSF and IP subtraction (‘a’ feature).
Acknowledgements
We are thankful to the ESO support staff on Paranal and the SPHERE science verification team for their support and the successful observations. H.C. acknowledges support from the Spanish Ministerio de Economía y Competitividad under grant AYA2014-55840P.
References
- Andrews et al. (2011) Andrews S. M., Wilner D. J., Espaillat C., Hughes A. M., Dullemond C. P., McClure M. K., Qi C., Brown J. M., 2011, ApJ, 732, 42
- Beuzit et al. (2008) Beuzit J.-L., et al., 2008, in Ground-based and Airborne Instrumentation for Astronomy II. p. 701418, doi:10.1117/12.790120
- Burrows et al. (1996) Burrows C. J., et al., 1996, ApJ, 473, 437
- Canovas et al. (2011) Canovas H., Rodenhuis M., Jeffers S. V., Min M., Keller C. U., 2011, Astronomy & Astrophysics, 531, A102
- Dong et al. (2012) Dong R., et al., 2012, ApJ, 750, 161
- Dubrulle et al. (1995) Dubrulle B., Morfill G., Sterzik M., 1995, Icarus, 114, 237
- Espaillat et al. (2011) Espaillat C., Furlan E., D’Alessio P., Sargent B., Nagel E., Calvet N., Watson D. M., Muzerolle J., 2011, ApJ, 728, 49
- Fusco et al. (2014) Fusco T., et al., 2014, in Marchetti E., Close L. M., Véran J.-P., eds, SPIE Astronomical Telescopes + Instrumentation. SPIE, p. 91481U
- Høg et al. (2000) Høg E., et al., 2000, A&A, 355, L27
- Jeffers et al. (2014) Jeffers S. V., et al., 2014, A&A, 572, A3
- Kastner et al. (2010) Kastner J. H., Montez Jr. R., Rodriguez D., Grosso N., Zuckerman B., Perrin M. D., Forveille T., Graham J. R., 2010, ApJ, 719, L65
- Kervella et al. (2015) Kervella P., et al., 2015, A&A, 578, A77
- Kurucz (1979) Kurucz R. L., 1979, ApJS, 40, 1
- Lucy (1974) Lucy L. B., 1974, AJ, 79, 745
- Melis et al. (2010) Melis C., Gielen C., Chen C. H., Rhee J. H., Song I., Zuckerman B., 2010, ApJ, 724, 470
- Min et al. (2009) Min M., Dullemond C. P., Dominik C., de Koter A., Hovenier J. W., 2009, arXiv.org, pp 155–166
- Min et al. (2012) Min M., Canovas H., Mulders G. D., Keller C. U., 2012, A&A, 537, A75
- Povel et al. (1994) Povel H. P., Keller C. U., Yadigaroglu I. A., 1994, Applied Optics, 33, 4254
- Schmid et al. (2012) Schmid H. M., et al., 2012, in Ground-based and Airborne Instrumentation for Astronomy IV. Proceedings of the SPIE.
- Skinner et al. (1998) Skinner C. J., Meixner M., Bobrowsky M., 1998, MNRAS, 300, L29
- Smith & Terrile (1984) Smith B. A., Terrile R. J., 1984, Science, 226, 1421
- Thalmann et al. (2008) Thalmann C., et al., 2008, in Ground-based and Airborne Instrumentation for Astronomy II. p. 70143F, doi:10.1117/12.789158
- Williams & Cieza (2011) Williams J. P., Cieza L. A., 2011, ARA&A, 49, 67
- Witzel et al. (2011) Witzel G., et al., 2011, Astronomy & Astrophysics, 525, 130
- Woitke et al. (2016) Woitke P., et al., 2016, A&A, 586, A103
- Zuckerman et al. (2008) Zuckerman B., et al., 2008, ApJ, 683, 1085
- de Boer et al. (2014) de Boer J., Girard J. H., Mawet D., Snik F., Keller C. U., Milli J., 2014, in Society of Photo-Optical Instrumentation Engineers (SPIE) Conference Series. p. 87, doi:10.1117/12.2054970